


Services on Demand
Journal
Article
 English (pdf)
 Article in xml format
 Article references
 Send this article by e-mail
Indicators
-
 Cited by SciELO
 -
 Access statistics
Related links
-
 Cited by Google
 -
 Similars in
SciELO
Similars in
SciELO -
 Similars in Google
Share

 Permalink
Ingeniería e Investigación
Print version ISSN 0120-5609
Ing. Investig. vol.35 no.1 Bogotá Jan.Apr. 2015
https://doi.org/10.15446/ing.investig.v35n1.41832
DOI: http://dx.doi.org/10.15446/ing.investig.v35n1.41832
R. M. Capelini1, J. F. Adami2, M. L. B. Martinez3 and M. F. C. Parentoni4
1Renato Massoni Capelini. B. Sc. in Electrical Engineering, Federal University of Itajubá, Brazil. M. Sc. in Electrical Power Systems, Federal University of Itajubá, Brazil. Affiliation: High Voltage Laboratory of the Federal University of Itajubá (LAT-EFEI), Brazil. E-mail: renato@lat-efei.org.br
2José Feliciano Adami. B. Sc. in Electrical Engineering, Telecomunications National Institute (INATEL), Brazil. M. Sc. in Electrical Engineering, Federal University of Itajubá, Brazil. D. Sc. in Electrical Engineering, Federal University of Itajubá, Brazil. Affiliation: Univ. Estadual Paulista (UNESP), Brazil. E-mail: josefeliciano@feg.unesp.br
3Manuel Luis Barreira Martinez. B. Sc. in Electrical Engineering, Federal University of Itajubá, Brazil. M. Sc. in Electrical Power Systems, Federal University of Itajubá, Brazil. Phd in High Voltage, Polytechnique University of São Paulo, Brazil. Affiliation: High Voltage Laboratory of the Federal University of Itajubá (LAT-EFEI), Brazil. E-mail: martinez@lat-efei.org.br
4Marcel Fernando da Costa Parentoni. B. Sc. in Electrical Engineering, Federal University of Itajubá, Brazil. M. Sc. in Electrical Power Systems, Federal University of Itajubá, Brazil. D. Sc. in Electrical Power Systems, Federal University of Itajubá, Brazil Affiliation: Federal University of Itajubá, Brazil. E-mail: parentoni@unifei.edu.br
How to cite: Capelini, R. M., Adami, J. F., Martinez, J. F., & Parentoni, M. F. C. (2015). Development of a system for detecting and locating damaged insulator strings with signals collected at substations. Ingeniería e Investigación, 35(1), 43-48. DOI: http://dx.doi.org/10.15446/ing.investig.v35n1.41832
ABSTRACT
This paper presents a novel technique for remotely identifying and locating of damaged insulator strings based on an analysis of noise signals recorded on the ground connection of current transformers installed on transmission line substations. Damaged insulators usually present electrical surface activity. Surface and corona discharges may result in the generation of high frequency signals that can travel through the transmission line conductors, which are recorded by a data acquisition system. Each signal generated by the surface or corona discharge has a unique signature. This signature changes according to the position of the source, i.e., the damaged string along the line, which enables the association between the signal signature and the location of the string along the line. A method proposed to achieve this association is discussed in this paper as well as the tools and tests carried out during its development. An innovative way for capacitive coupling, which reduce detection system implementation costs is presented.
Keywords: insulator strings, transmission line, neural network, current transformer.
RESUMEN
Este artículo presenta una nueva técnica para la identificación y la localización remota de las cadenas de aisladores dañadas basadas en el análisis de las señales de ruido registradas en la conexión a tierra de los transformadores de corriente instalados en subestaciones de línea de transmisión. Aisladores dañados suelen presentar actividad eléctrica superficial que pueden resultar en la generación de señales de alta frecuencia que pueden viajar a través de los conductores de la línea de transmisión y ser registrados por un sistema de adquisición de datos. Cada señal generada por la descarga superficial o corona tiene una firma única. Esta firma cambia con la posición de la fuente (aislador dañado) a lo largo de la línea, lo que hace posible la asociación entre la firma de la señal y la localización de la cadena a lo largo de la línea. Un método propuesto para lograr esta asociación se analiza en este trabajo, así como las herramientas y pruebas llevadas a cabo durante el desarrollo. Se utiliza una forma innovadora de acoplamiento capacitivo, lo que reduce los costos de implementación del sistema de detección.
Palabras clave: cadenas de aisladores, línea de transmisión, redes neuronales, transformador de corriente.
Received: January 30th 2014 Accepted: November 18th 2014
Introduction
The inspection of insulator strings in transmission lines has traditionally required a lot of resources and time to be conducted. Well trained personnel, sophisticated and expensive tools and vehicles are necessary as radio frequency and ultra-sonic locators, corona sensitive cameras, pickup trucks and helicopters are applied in the most difficult situations. Despite the high cost and importance of this activity, the obtained results are usually not precise and depend highly on the experience and skill of linemen.
Much has been investigated and discussed on traditional inspection methods in order to make them more effective.
Acoustic (ultra-sonic) and radio frequency are among the most common methods to detect partial discharges in all sort of electrical equipments (Lundgaard, 1992; Acevedo, 2012). Inspections based on ultra-violet imaging can also be applied (Bologna et al, 2002; Costa et al, 2009), where corona sensitive cameras are used to scan electrical components. These cameras are usually installed in aerial vehicles for inspecting large transmission lines, consisting in one of the most costly solutions available for transmission line maintenance, nevertheless, all of these inspection methods have to be carried out in loco.
The development herein discussed focuses on an inspection method of insulator strings in transmission lines that can be applied from the substations, without the necessity of scanning the transmission line in loco. The method is based on signals from surface and corona discharges that can possibly take place on damaged insulators strings. These signals can travel through the transmission line, which are recorded at the ends of the line. As the signals pattern depends on the electrical circuit between the point of discharge occurrence and the point of signal recording, the system can associate the detected patterns with the position of the strings along the transmission line. This association is performed by a piece of software based on neural networks (Haykin, 1999).
An innovative way for signal coupling is applied in this method where the capacitance between the primary terminals and the metal body of current transformers (CTs) is used as coupling capacitor. This avoids the installation of any specific coupler, as a capacitive voltage transformer (CVT), in substations, reducing the implementation cost of the proposed technique. Details of this coupling method were discussed in an early stage of this research in (Adami, 2009) and (Capelini, 2012).
Fundamentals of the Proposed Method
Some conditions may lead to the occurrence of an external electrical activity on the insulator strings: a cracked insulator, excess of humidity, rain, contamination and so on. Partial discharges in air (Trinh, 1995) result in the emission of acoustic and radiofrequency signals that can interfere with communication systems and slightly increase losses of the transmission lines. Moreover, it leads to the appearance of high frequency signals that can travel through the transmission lines. The Power Line Carrier (PLC) noise increase, observed during long range operation of transmission lines and that precedes a fault to ground due to damaged insulator strings, is a common example of this phenomenon. These signals can be acquired from the transmission line by coupling devices or using a structure similar to the PLC systems (IEEE, 2004).
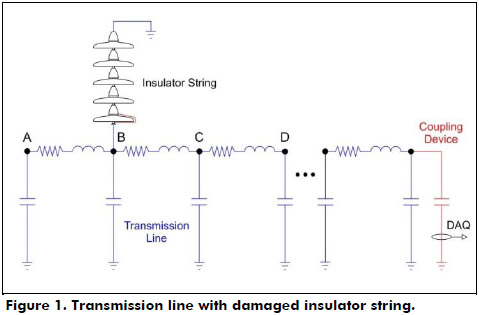
Each signal generated on the insulator strings has some particular characteristics that depend on the electrical circuit between the point where the signal is generated and the one where it is recorded. In other words, these signals have a unique signature. For example, consider the transmission line theoretical π model shown in Figure 1. It has four points (A, B, C and D) where the insulator strings can be connected. If an insulator string containing one damaged insulator, in this case the first one, is connected to one of these points surface or corona discharges may occur on this insulator. When the string is connected to point A, high frequency signals are acquired by the data acquisition system (DAQ), which is installed at one of the ends of the transmission line. These signals present a typical signature. When the connection point is changed from A to B, the signature is changed as well. The same occurs if the string is connected to points C and D.
As the signature changes with the electrical circuit between the signal source and the data acquisition system, then it is possible to associate the signatures of the recorded signals with their location in the transmission line where they are generated. In other words, once the signatures are identified, it is possible to locate the damaged insulator strings where the electrical activities occur. For this task neural, networks were chosen due to being a technique that has achieved good results in similar applications (Zin et al, 2013; Tadeusiewicz et al, 2000).
Laboratory Development
Laboratory Facilities
The method was initially developed in laboratory, where a transmission system mock-up was designed to represent a single phase to ground high voltage transmission line and feeding substation as shown in Figure 2.
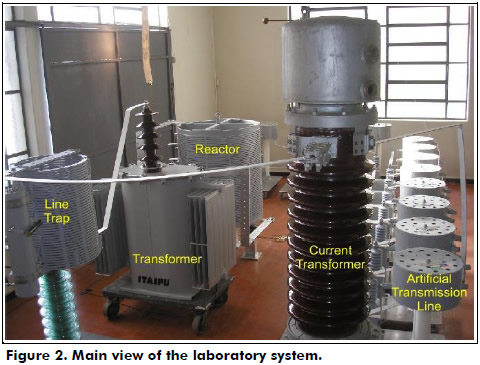
From Figure 2, it is possible to observe that the single-phase artificial transmission line is fed by a variable autotransformer (0 – 240V) connected to a power transformer (240 V – 35 kV). This artificial transmission line is composed of eleven complete π sections and represents a real 69 kV transmission line with a length of 48 km. As the transmission line mock-up has no load, a reactor is used for reactive power compensation, reducing the laboratory power demand. There are 48 connection points along the transmission line, one point per kilometer, where the insulator strings can be connected.
A coupling device is connected to the feeding point of the mock-up. It provides a way for high frequency signals to be acquired by the data acquisition system. A line trap is installed between the transformer and the line model end to block high frequency signals from leaving and entering the transmission line. An 8 bit and 100 MS/s data acquisition board and a computer are responsible for digitalizing the noise signals. A high frequency current transformer (HFCT) was developed specifically for this application and installed at the grounding cable of the coupling device. Its output is connected to the data acquisition board through a protective device. At the beginning of this research, a HFCT capable of working until 10 MHz was applied, covering the most important frequency components observed in laboratory. With the development of the acquisition system for real transmission lines, where important higher frequency components were detected, it was designed a new HFCT. This new HFCT covers frequency components until 50 MHz and was applied in laboratory as well.
During the development tests five suspension insulators (made of glass and porcelain) were connected to form an insulator string. Due to designing limits of the artificial transmission line capacitors, as suggested by the manufacturer, it was not applied the phase to ground voltage to the insulator strings connected to the transmission line. The maximum voltage applied was around 15 kV. Therefore, even with a heavily damaged insulator string connected to the mock-up, the occurrence of electrical activity can be assumed as a low probability event. The solution for this problem was the use of the surface-corona simulation device as previously discussed (Capelini, 2012). It consists of a metal wire installed between the pin and the socket cap of one insulator. Once connected to the pin, the wire is positioned to create a small gap with the socket cap, where partial discharges take place. In addition to increasing the probability of occurrence of surface-corona electrical activity, the resulting signals present acceptable similarity when compared to signals from real surface-corona activity. An example of the signal obtained from this simulation can be observed in (Capelini, 2012). The signal properties, as the frequency composition and time duration, are very similar to those obtained in (Cavallini, 2007). In this case, the authors obtained surface and corona signals from artificially polluted and wetted ceramic insulator strings. Despite some differences between the partial discharges types, as amplitude and dispersion, there is no significant influence on the method development in the case of the present paper.
Software Development and Tests
All software applied in this research was developed in laboratory. Although the acquisition board PicoScope 3206® offers its own software for data acquisition, a new one was developed based on the C++ development kit provided by Pico Technology®. While the original software works as a virtual oscilloscope, presenting very low storage capacity regarding the possible amount of signals to be recorded (1000 signals maximum), the new one allows that much storage capacity to be used for this purpose. In fact, its limit is determined by the hard disk storage capacity installed in the computer, once the signals are automatically acquired by the data acquisition board and stored in the hard disk. Operating in a different mode, the original software acquires a batch of signals and stores them in the internal memory of the data acquisition board. Once the internal memory limit is achieved, the user is requested to store the signals in the hard disk manually. Moreover, the new software allows a remote operation by Internet. This is a great advantage considering that this system is to be installed in substations far from the operation center.
The pattern recognition software, based on neural networks, was initially developed in MATLAB R2009b® using the Neural Network Toolbox®. This piece of software fitted the necessities for the laboratory tests well, where the amount of signals and the computational effort were relatively low. If it were applied in real transmission lines it could require very powerful computers to run it properly, though. The training process of neural networks usually requires a long time to be carried out and may be a critical point depending on the application. In the case of this research, the training process was taking many hours to be completed for few patterns. For this reason, a new pattern recognition software was developed in C++ using the Fast Artificial Neural Network Library® (FANN). This software is quite faster, about 3 times in average, requiring less computational effort and presenting a more adequate interface for field applications. As an example, it can be cited the results of a comparison test between the same neural network training in these two pieces of software. The feed-forward neural networks, containing 20 neurons in the hidden layer, were trained in order to recognize 5 different patterns. The training sets were prepared with 4200 signals per pattern and each signal was represented by a vector of 2001 elements. The training time of the MATLAB® based software was about 6 hours, while the FANN® based software required about 2 hours to perform the same task. The recognition process, where 60 signals were submitted to the neural networks, was completed in around one minute in the case of the MATLAB® based software, and less than half a minute in the case of the FANN® based software. The computer applied to this test has a Intel Core 2 Duo P8700® 2.53GHz processor and a 2GB DDR2 800MHz RAM, running Windows 7® Pro 64 bit.
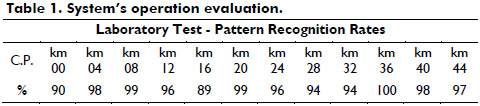
The results of the following test, chosen among many others carried out in laboratory, are discussed to exemplify how the software works. Considering the mock-up, twelve connection points were chosen. These points are represented by the distances from the feeding point of the line, as shown in Table 1. A string consisting of five ceramic insulators was prepared with the surface-corona simulation device connected at one of these insulators.
For the neural network training, the following procedure was adopted: first of all, it was confirmed that the mock-up was free of noises. Then, the insulator string was connected to each one of the twelve points of the transmission line and 800 signals were recorded per point. In other words, a data bank containing 9600 signals, 800 per pattern, was created. Each signal was represented by a vector of 505 elements. In order to reduce the computational effort a compression algorithm was developed and applied to all signals of the data bank. It is called the percentage filter and transforms the original vector into a new one containing 50 elements (Capelini, 2011). Each element of this new vector corresponds to the energy of a specific frequency band of the signal. The first band is 0 – 1 MHz, the second one is 1 – 2 MHz and so on. This algorithm has a better performance when compared to the Linear Predictive Coding (LPC) that was previously applied in this research (Capelini, 2012). In spite of resulting in 2.5 times more elements, the vectors obtained from this algorithm present more significant information from the original signal. It was observed from the tests that when this algorithm was applied, the precision of the recognition process was considerably higher. Using the MATLAB Neural Network Toolbox® a feed-forward neural network, containing 50 neurons in the hidden layer, was created. For the training process, the Scale Conjugate Gradient algorithm was applied. The training data sets were randomly divided as follows: 60% for training, 20% for evaluation during the training process (in order to avoid over fitting) and 20% for the final test. The Mean Squared Error was used for performance evaluation.
After the neural network training the pattern recognition software was theoretically able to recognize signals coming from the twelve connection points of the transmission line. In other words, it was theoretically able to locate damaged insulator strings along the mock-up. In order to assess the operation of the whole system regarding the insulator strings location, a new data bank was created applying the same testing procedures discussed earlier. In this case, 200 signals were collected per pattern. All signals of the data bank were presented to the software for a pattern recognition process. Table 1 contains the recognition rates from the twelve patterns related to the connection points (C.P.) of the transmission line. For all patterns, the rates were higher than 90%. The recognition rate can be understood as the probability with which the damaged insulator string is detected and located when a respective surface-corona signal is recorded and processed by the system installed at the substation. Concerning the portion of signals which was not recognized by the system, it was observed that they were understood by the neural networks as simply unknown or, in the worst case scenario, as belonging to another known pattern. In the last hypothesis, the signal can be classified as a false alarm. However, as the surface-corona partial discharge is a repetitive phenomenon and the "correctly recognized" signals are the vast majority this is not a cause of concern. As reported in (Cavallini, 2006), the pollution severity can be assessed by verifying the repetition rate of the surface-corona partial discharges, among other parameters. A solution for the false alarm problems is discussed further.
Tests carried out with the mock-up have shown that the accuracy of the system depends on the number of patterns are considered for training the neural networks. The test discussed before considered only the recognition of patterns previously known by the system. This situation corresponds, in real transmission lines, to train the neural networks with signals from all the towers. Meanwhile, if for any reason training the neural networks with patterns from all the towers is not possible, some towers can be chosen for the training and the system still operates. Therefore, the intermediate towers, whose patterns are unknown, could still have damaged insulator strings located. However, the trained patterns would cover not only the selected tower, but the intermediate towers as well. In this case, the towers should be, if possible, equally distributed along the line. Considering IT as the number of intermediate towers, the accuracy of the location is ± IT/2 and the system would report the location of a damaged insulator string as follows: Location = Tower ± IT/2.
During the laboratory tests, different configurations of insulator strings were applied: association of porcelain insulators, association of glass insulators and association of both types. Regarding the similarity of the signals obtained from these strings, no differences were noticed from the point of view of the neural networks. This is an important result once the insulator strings installed in real transmission lines, in the case of the sponsor of this research, may present all these configurations.
Field Development
Software and Hardware Adaptation
Once the method was validated in laboratory, the next step of the research was the adaptation to real transmission lines. For field development, a 69 kV and 60 km transmission line was selected by AES Sul, an electric utility which is part of AES Corp. AES Sul is the sponsor of this research and is responsible for part of the transmission and distribution networks of the State of Rio Grande do Sul, Brazil.
As the characteristics of the real transmission line are different from the characteristics of the artificial transmission line some modifications had to be made. Although the same model of data acquisition board was chosen for this system, the current sensors, coaxial cables and surge protectors had to be changed. For the specification of these components, a study had been initially performed which was aided by simulations in ATP®. The real transmission line was modeled from the electrical and geometrical parameters provided by AES Sul, which was represented by a series of LCC blocks (Bergeron model). Transposition towers and the skin effect were considered in the simulation. The CTs (couplers) were represented by a series element composed of a capacitor and a resistor, corresponding to the capacitance between primary terminal and the metal body and the grounding resistance. The adopted capacitance was 0.78 nF, the same from the CT applied to the laboratory tests. The resistance had an adopted value of 5 Ω. The current sensors were modeled as linear transformers, representing the transformer ratio of 0.02. Damaged insulator strings were also modeled, initially from the model proposed by (Adami, 2008). However, as the resulting signals from this model had not enough similarity regarding frequency composition, when compared to the signals obtained in laboratory, a new solution was adopted. A surface-corona signal obtained from the simulation device in laboratory was acquired from a shunt resistor installed at the grounding cable of the insulator string. This signal was modeled in ATP® by inserting its corresponding vector, after correcting the amplitude level, in a current source model. Then, the signal was injected into the transmission line model and recorded at the acquisition point. It was observed which this signal had a substantially different frequency composition when compared to the signals recorded from the laboratory mock-up. The chosen current transformer ratio was adequate, matching the signal amplitude necessities for the data acquisition board. In addition to the surface-corona discharges, switching transients were simulated in order to determine the necessity of surge protection for the data acquisition system. A surge of 80 V was observed at the output of the current sensor. As the maximum voltage for the PicoScope® 3206 input channels is 20 V, the application of a surge protector was mandatory.
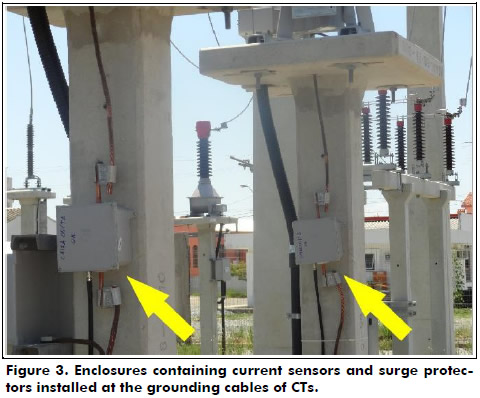
From the results of the simulations, new types of current sensors were studied. After simulating and testing new configurations of sensors, among them Rogowski coils (Robles et al, 2008) and HFCTs (Birlasekaran et al, 2007; Luo and Zhang, 2010; Mallikarjunappa and Ratra, 1990) assembled with different material cores, the HFCT was chosen. Although no important frequencies were observed beyond 10 MHz in the simulations, it was decided to apply a HFCT responding to higher frequencies in order to verify the possible existence of frequency components in the field that were not detected in laboratory and in the simulations. For the new sensor, an iron powder core (Magmattec MMT02T4416) was chosen and the transformer ratio was the same applied in the simulations, resulting in a 50-turn secondary. The current sensor was mounted in a metallic enclosure, which also contains the surge protector, and submitted to frequency response tests carried out with a Franalyzer®. Once verified other units were manufactured in laboratory and installed at the grounding cables of the CTs in two substations located at the ends of the transmission line, as it can be observed in Figure 3. The current sensors are connected to the PicoScope 3206® data acquisition board through RG213 coaxial cables, that are much more adequate for field application when compared to the cables used in laboratory (RG58). The data acquisition board is operated by a computer, that contains the acquisition and pattern recognition software modules.
During the field development, many tests were performed for the calibration of both hardware and software. The first version of the data acquisition system was installed in a substation in February 2012. The enclosures containing the current sensors and the surge protectors were installed at the grounding cables of three CTs. The data acquisition board and computer were installed inside a panel, as the coaxial cables were laid in the trenches. The acquisition software was fully operational at this time. Once all the system is installed, linemen crew applied a surface-corona simulation device to some sound insulator strings for testing the system. This device is different from that applied in laboratory, consisting of a metallic fork, as shown in (Adami, 2009). The working principle and the results, however, are the same. As it was expected the data acquisition system worked properly, but the recorded signals presented some differences when compared to the signals from laboratory and simulations: higher frequency components were observed as well as longer signal duration.
Switching transients were also provoked and compared with the results from the simulations. As substantial differences were noted, with maximum voltages of 500 V, the surge protectors had to be replaced with more suitable units.
This replacement was brought in on in May 2012, when new tests were carried out and new versions of the software modules containing the neural network training and recognition features were installed. The switching transients were generated again and the performance of the surge protectors was verified. With the acquisition system being properly protected, the major test of this phase was started.
The objective of this test was to evaluate the pattern recognition software operation. Some structures of the transmission line were selected to have surface-corona simulated on their insulator strings. Initially, the intention was to substitute the sound insulators strings of these structures with strings mounted with damaged insulators. However, this operation was not permitted by AES Sul due to the risk that is implied for the transmission system. The surface-corona simulation device was again applied to generate partial discharges on the insulator strings that had already been installed. Meanwhile, before the signal acquisition started, it was confirmed that there was no significant noise in the transmission line. It was necessary to avoid interferences on the processes of training and recognition. From the signals acquired during these tests, data banks were created for training and testing the pattern recognition software. In a further step in laboratory, the software was calibrated to obtain maximum performance, mainly on the training process. All parameters of the neural network were reviewed and new filter algorithms were applied. Some problems detected on previous tests were tackled as well.
On June 2013, the third and last phase of field tests was performed. The final versions of the software modules were installed on both substations. For the signal acquisition module test, few partial discharges were generated on some insulator strings close to one of the substations. The following step was to test the pattern recognition module. Eight from almost 240 structures of the transmission line were considered for this test. For each structure, the surface-corona simulation device was applied to all insulators of all strings after confirming that no noise was present in the transmission line. The signals were grouped per structure resulting in eight patterns to be used in the pattern recognition software. Thus, several tests were carried out with different neural network configurations. These configurations depend on the amount of patterns and signals, and the properties of the signal (length of the vector and the values of each element).
For example, one of the tests was carried out with a data bank containing 1000 signals per pattern for the neural network training and 200 signals per pattern for the neural network test. Each signal was originally represented by a 2000 elements vector. In order to save computational resources, the algorithm percentage filter was applied. After the application of this algorithm each signal was represented by a 50 element vector and the neural network was trained. After the training, test signals were submitted to pattern recognition to evaluate software operation. The results are shown in the Table 2.
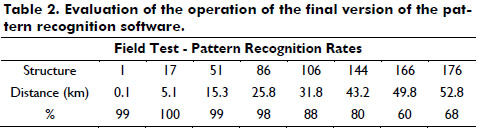
From Table 2, it can be observed that the accuracy is not as high as that observed in laboratory. Nevertheless the results are still good. Even the lower pattern recognition rate, in this case related to structure 166, is not worthy of concern. As electrical activity on damaged insulators is a repetitive phenomenon, the amount of signals that are not correctly recognized is not a major problem as aforementioned. During the tests it was noticed that, in average, around 9% of the signals are recognized as not belonging to any pattern. On the other hand, 8% of the signals approximately are recognized as belonging to wrong patterns, consisting in false alarms. The system, however, has auxiliary tools to deal with it, avoiding that the false alarms are reported to the operator.
In this test, it was used the acquisition system installed in the substation next to structure #1. For this reason, the pattern recognition rate for patterns composed of signals acquired from closer structures – 1 to 86 – is higher. For the farthest structures, the pattern recognition rate decreases considerably. This happens because of the vertical resolution of the data acquisition board. After the field tests, it was clear that an 8 bit resolution was not adequate for this purpose. When the structures are too distant from the acquisition point, the amplitude of the signals are too low and the acquisition system cannot perform a good digitalization. In the case of this research this issue is settled by using acquisition points on both ends of the transmission line. The ideal scenario, however, is the replacement of the data acquisition board, choosing a model with higher vertical resolution. No problem was noted with the horizontal resolution.
Conclusions
The application of neural networks for pattern recognition in this research has proved to be a right choice, once it has fitted very well for the properties of the considered partial discharges signals. Combined with the compression algorithm percentage filter, the pattern recognition system has achieved very good results, presenting high recognition rates, both in laboratory and field.
The signal acquisition system developed for this application had a satisfactory behavior in the laboratory tests as well as during field tests. Presenting good performance, this system is a low-cost solution that can be applied in many other cases. The use of the CT as a coupling device, which worked properly in the case of this research, avoids unnecessary and costly CVT installation.
The installed system in the AES Sul substations is ready to operate in order to detect damaged insulator strings and being remotely operated by the internet. Until now the system is able to find out problems in the insulator strings of eight structures as discussed in this paper. However, the whole transmission line can be covered by the system if signals from the remaining structures are included in the training process.
References
Acevedo, J. E. (2012). Field Experiences Using Radio Frequency Scanning (RFS) to Detect Partial Discharge (PD) in Bus Duct and Metal Clad Switchgear of Electrical Generating and Transmission Substations. IEEE X International Conference on the Properties and Applications of Dielectric Materials. [ Links ]
Adami, J. F. (2008). Detection and Identification of Arcs on Insulator Strings in Transmission Lines Using Signal Processing Techniques. (Doctoral thesis), Federal University of Itajubá [ Links ].
Adami, J. F., Silveira, P. M., Martinez, M. L. B., Perez, R. C., & Dallbello, A. C. (2009). New Approach to Improve High-Voltage Transmission Line Reliability. IEEE Transactions on Power Delivery, 24(3). [ Links ]
Adami, J. F., Martinez, M. L. B., Bertoleti, P. H. F., & Sene, I. (2010, August). The use of current transformers for noise detection due to sparking in insulators strings in high voltage transmission lines. International Conference on High Voltage Engineering and Application. [ Links ]
Birlasekaran, S., Leong, W. H. (2007). Comparison of known PD signals with the developed and commercial HFCT sensors. IEEE Transactions on Power Delivery, 22(3), 1581-1590. [ Links ]
Bologna, F. F., Nahatho, N., & Hoch, D. A. (2002). Infra-red and ultra-violet imaging techniques applied to the inspection of outdoor transmission voltage insulators. In IEEE VI Africon Conference in Africa (pp. 593-598). [ Links ]
Capelini, R. M. (2011). Localização de cadeias de isoladores defeituosas em linhas de transmissão através de redes neurais. (M. Sc. Dissertation). Universidade Federal de Itajubá, Itajubá [ Links ].
Capelini, R. M., Adami, J. F., Martinez, M. L. B., Parentoni, M. F. C., & Sene, I. (2012). Use of neural networks for location of defective insulators in power lines. Journal of Energy and Power Engineering, 6, 1308-1314. [ Links ]
Cavallini, A., Chandrasekar, S., & Montanari, G. C. (2007). Infering ceramic insulator pollution by an innovative approach resorting to PD detection. IEEE Transctions on Dielectrics and Electrical Insulation, 14(1), 23-29. [ Links ]
Cavallini, A., Montanari, G. C., Chandrasekar, S., & Puletti, F. (2006). A novel approach for the inference of insulator pollution severity. IEEE International Symposium on Electrical Insulation. [ Links ]
Costa, E. G., Ferreira, T. V, Nero, M. G. G., Queiroz, I. B., & Germano, A. D. (2009). Characterization of polymeric insulators using thermal and UV imaging under laboratory conditions. IEEE Transactions on Dielectrics and Electrical Insulation, 16(4), 985-992. [ Links ]
Haykin, S. (1999). Neural Networks: A comprehensive foundation (2nd ed.). Prentice Hall. [ Links ]
IEEE (2005, Jun.). Guide for power-line carrier applications. IEEE Standard 643-2004. [ Links ]
Lundgaard, L. E. (1992). partial discharge - part XIII: Acoustic partial discharge detection - Fundamental considerations. IEEE Electrical Insulation Magazine, 8(4), 25-31. [ Links ]
Luo, G., Zhang, D. (2010). Study on performance of developed and industrial HFCT sensors. In XX IEEE Universities Power Engineering Conference (pp. 1-15). [ Links ]
Mallikarjunappa, K., Ratra, M. C. (1990). Detection of partial discharges in power capacitors using high frequency current transformers. In IEEE Conference on Electrical Insulation and Dielectric Phenomena (pp. 379-384). [ Links ]
Robles, G., Martínez, J. M., Sanz, J., Tellini, B., Zappacosta, C., & Rojas, W. (2008). Designing and tuning an air-cored current transformer for partial discharges pulses measurements. In IEEE Instrumentation and Measurement Technology Conference (pp. 2021-2025). [ Links ]
Tadeusiewicz, R., Wszolek, W., Izworski, A., & Wszolek, T. (2000). Recognition of defects in high voltage transmission lines using the acoustic signal of corona effect. IEEE Signal Processing Society Workshop, 2, 869-875. [ Links ]
Trinh, N. G. (1995). Partial discharge XIX: Discharge in air part I: Physical mechanisms. IEEE Electrical Insulation Magazine, 11(2), 23-29. [ Links ]
Zin, A. A. M., & Karim, S. P. A. (2013). Protection System Analysis Using Fault Signatures in Malaysia. Elsevier International Journal of Electrical Power & Energy Systems, 45(1), 194-205. [ Links ]
