


Services on Demand
Journal
Article
 English (pdf)
 Article in xml format
 Article references
 Send this article by e-mail
Indicators
-
 Cited by SciELO
 -
 Access statistics
Related links
-
 Cited by Google
 -
 Similars in
SciELO
Similars in
SciELO -
 Similars in Google
Share

 Permalink
Ingeniería e Investigación
Print version ISSN 0120-5609
Ing. Investig. vol.35 no.1 Bogotá Jan.Apr. 2015
https://doi.org/10.15446/ing.investig.v35n1.44063
DOI: http://dx.doi.org/10.15446/ing.investig.v35n1.44063
F. Moreno1, E. Restrepo2 and J. A. Guzmán3
1Francisco Javier Moreno Arboleda. Ph. D. en Ingeniería de Sistemas, Universidad Nacional de Colombia, Colombia. Affiliation: Universidad Nacional de Colombia, Colombia. E-mail: fjmoreno@unal.edu.co
2Eduardo Restrepo Acosta. Ingeniero de Sistemas, Universidad Nacional de Colombia, Colombia. Affiliation: Universidad Nacional de Colombia, Colombia. E-mail: eduardorestrepo89@gmail.com
3Jaime Guzmán Luna. Ph. D. en Ingeniería de Sistemas, Universidad Nacional de Colombia, Colombia. Affiliation: Universidad Nacional de Colombia, Colombia. E-mail: jaguzman@unal.edu.co
How to cite: Moreno, F. J., Restrepo, E., & Guzmán, J. (2015). Recognition of highly frequented sets of tourist sites. Ingeniería e Investigación, 35(1), 71-78. DOI: http://dx.doi.org/10.15446/ing.investig.v35n1.44063
ABSTRACT
In this paper we propose an algorithm to identify sets of the most frequently visited tourist sites. We do this by examining the trajectories followed by tourists and by considering their visits to these sites. We propose a second algorithm that recommends a specific order to visit these sites. To accomplish this task, we consider variables such as tourist preferences, departure and arrival locations, and time constraints. To validate our proposal, a prototype website application was developed, which experiments with real vehicle trajectories in Rio de Janeiro. Although more exhaustive experiments will be required to deal with different possible scenarios, preliminary results show the usefulness of our proposal for displaying sets of neighborhoods frequented by vehicles as they move about a city.
Keywords: Tourism, routes, tourist recommender, heuristic algorithms, trajectories, frequent routes.
RESUMEN
En este artículo se propone un algoritmo para identificar los conjuntos de sitios turísticos más frecuentemente visitados. Para ello se examinan las trayectorias seguidas por turistas y se consideran sus visitas a los sitios turísticos. Se propone un segundo algoritmo que sugiere el orden en el que deben ser visitados los sitios identificados por el primer algoritmo.
Para lograr esto se consideran variables como preferencias turísticas, lugar de partida y de llegada y restricciones de tiempo. La propuesta se validó mediante una aplicación web prototipo y se experimentó con trayectorias reales de vehículos en Río de Janeiro. Aunque se requieren experimentos más exhaustivos y se deben considerar otros escenarios, los resultados preliminares mostraron la utilidad de la propuesta al identificar conjuntos de barrios que son frecuentados por los vehiculos a medida que estos se desplazan por la ciudad.
Palabras clave: turismo, rutas, recomendador turístico, algoritmos heurísticos, trayectorias, rutas frecuentes.
Received: June 18th 2014 Accepted: November 18th 2015
Introduction
In recent years, due to the many technological advances in the internet, mobile devices, GPS (Kaplan 2006), and web applications, many tools and services have been developed to assist in every aspect of the tourism industry. Tourists, travel agents, and guides all benefit from tools that create personalized tours, provide real-time language translation (Lord 2012), find and book hotel reservations and tickets for shows, sport events, etc., based on budget and preferences.
Planning services are today primarily focused on creating tourist tours in a practical, fast, and efficient manner. Indeed, mobile applications such as i) mTrip Guides (http://www.mtrip.com) and TouristEye (http://www.touristeye.es) can create a personalized travel itinerary according to user preferences, dates of travel, user departure and arrival points, tourist attraction’s opening hours, and ratings submitted by other tourists; ii) Everytrial (http://www.everytrail.com) allows users to connect with other tourists and share tourism plans; and iii) Guru (http://www.ciudadguru.com.co) presents tourist sites which are located near the user through a geo-location system.
In an alternative approach, Álvares (2007) proposes the SMoT (Stops and Moves of Trajectories) algorithm (see Section 2) to identify stops and moves from a moving object trajectory, e.g., the trajectory followed by a tourist. A stop represents a period during which a trajectory visited a site and remained there a minimum time Δt, i.e., the trajectory actually visited the site. A move represents a period during which the trajectory did not visit any site or visited a site but the threshold Δt was not met. The sites and their Δt are defined by the application analysts.
In this paper we propose, from the results obtained by the SMoT algorithm, the statisticsSetsOfNSites algorithm which identifies, from the visited sites during the stops of tourists’ trajectories, the sets of sites that are included more frequently in such trajectories (a simplified and very brief version of this algorithm can be seen in
(Restrepo 2013)). For example, most tourists who visit Paris usually include in their tour the Eiffel Tower, the Arc de Triomphe, and the Champs Elysées. To tour the set of sites identified as the most visited ones we consider variables such as time constraints, tourists departure and arrival location, and their preferences. Note that our proposal is not a recommender system but a part/subsystem of it, because we do not focus on profile representation, knowledge acquisition, or knowledge source.
This paper is organized as follows: In Section 1, we provide an overview of related works. In Section 2, we present the statisticsSetsOfNSites algorithm. Then, we present a second algorithm, orderNearestNeighbor, to recommend an order to tour the identified sites by the first algorithm. In Section 3, we present some experiments with real trajectories of vehicles in Rio de Janeiro. In Section 4, we conclude the paper and propose future works.
Related works
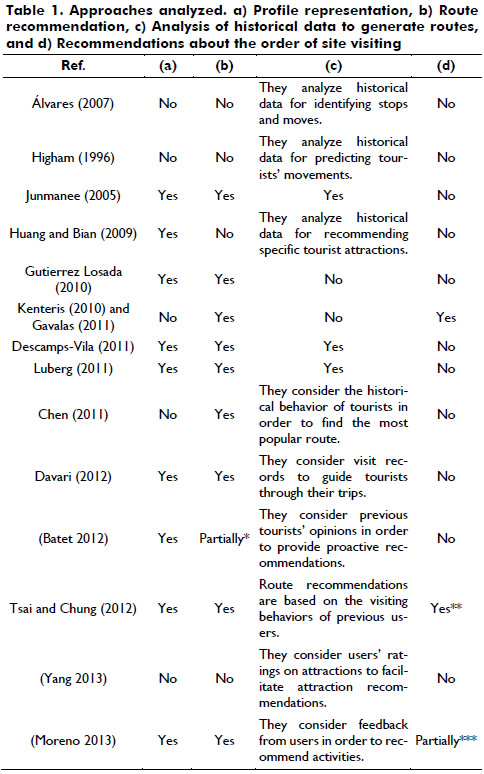
Higham (1996) proposed the TERRY-TOURIST system to predict tourist’s movement according to historical data. The system applies techniques based on case-based reasoning (Leake 2003) to model the movement patterns of tourists.
Junmanee (2005) proposed methods in a mobile environment to provide tourists with travel tips, routes, and information about the sites to visit. The methods are based on user data (types of favorite tourist), demographic data, and users with similar profiles.
Huang and Bian (2009) proposed an intelligent recommendation system that provides personalized recommendations of tourist attractions in an unfamiliar city. Through a tourism ontology, a Bayesian network technique, and the analytic hierarchy process method, they focus on recommending specific tourist attractions based on the travel behavior both of the user and of other users.
Gutierrez Losada (2010) proposed an ontology for walking and cycling tours in natural spaces. The traveler is guided based on his/her position (provided by his/her mobile device), his/her preferences, and the time of the day. These aspects are the basis of what the authors called Location Based Services. The ontology includes route characteristics such as duration, length, type of route (circular or linear), weather conditions, and road difficulty level, among others. They also consider users’ aspects such as the recommended physical condition or the necessary mobility and orientation skills.
Kenteris (2010) considers the problem of designing the tourist itinerary (Tourist Itinerary Design Problem), i.e., to find the order in which a set of sites should be visited. Subsequently, Gavalas (2011) included the sites’ time availability to design the tour.
Descamps-Vila (2011) proposed the Itiner@ system. The system creates personalized tourist routes for the d’Esterri d’Aneu region in Spain. The system uses an ontology called OntPersonal (Ocegueda Hernández 2012) along with tourist glossaries. OntPersonal models the profile of each user and considers touristic preferences and restrictions related to travelling companions. The system also gets the most relevant tourist sites for every user based on a set of rules and an ontology about sites.
Luberg (2011) proposed the Smart City system in order to recommend and plan tourist routes. Based on a user´s profile (considering his available time, his preferences, and his location), the system chooses a set of tourist sites for the user, assigning them a rating and representing them through a map.
Adomavicius (2011) considers recommendation systems aware of the context, e.g., systems that consider aspects such as time, sites and company of other people, among others. These systems can be oriented to tourism, to customize the contents of a web page, or to recommend background music.
Chen (2011) addressed the issue of finding the most popular route (PMR)between two sites based on the historical behavior of other tourists. First, a network with all possible routes between the two sites is built; and then the PMR is created from the popularity of each of the nodes in the network.
Davari (2012) proposed the TKGS system (Tourists Keeping and Guiding System). TKGS allows users to plan short or long trips based on their location, records of visits, physical condition, and personal characteristics. TKGS also tries to avoid crowded places according to their peak hours.
Turist@ (Batet 2012) is an agent-based recommender system. Users interact with the system through a User Agent (a GUI) that provides access to tourist attractions. The system also includes a Recommender Agent that stores each user’s preferences,, which are continuously refined through the analysis of his/her actions. Turist@ provides proactive location-based recommendations (e.g, a warning about an activity that is near the location of the tourist and that may be of interest for him/her) based on the user profile, the tourist location, touristic activities, and previous tourists’ opinions.
Tsai and Chung (2012) developed a route recommendation system that provides personalized routes for tourists in the context of theme parks (e.g., Disney World, Universal Studios, Six Flags, etc.). Their system takes into the consideration that visitors typically do not have enough time to visit all the attractions in a park and, therefore, create a subset of attractions they want to visit. Route suggestions are made based on previous user behavior, and estimated crowd sizes to provide the least congested routes. The authors note that most tourist recommendation systems suggest places that are worth visiting, but provide no guidance about the order for visiting these sites. This is one of the aspects we face in our paper.
In (Yang 2013) the authors proposed the iTravel system. The main goal is to exploit the tourists' ratings about visited attractions. The idea is that a user can detect nearby tourists and directly exchange information with them by using mobile devices without additional infrastructures. The authors claim that their experiments confirmed the conjecture that tourist who visit the same places tend to have similar traveling tastes or needs. They also conclude that it would be interesting to design a method to derive ratings from tourists' behavior, e.g., the time they stay at an attraction. Note that we are facing this issue by applying the SMoT algorithm through the analysis of stops.
In (Moreno 2013) the authors proposed a tourism recommender system called SigTur/E-Destination.. The system integrates GIS and artificial intelligence algorithms. The GIS stores geospatial information related to tourism and leisure activities. The artificial intelligence tools integrate the geospatial information within the recommender system and provide personalized recommendations thanks to the exploitation of user profiles by means of an ontology-based model that includes an ontology for the classification of the main types of activities in order to match with the motivations of the user. The reader is also referred to the International Conference in Information and Communication Technologies in Tourism’s paper collection, and the works therein in the last years. Table 1 summarizes these approaches. In our application we focus on the last three criteria.
Proposed Method
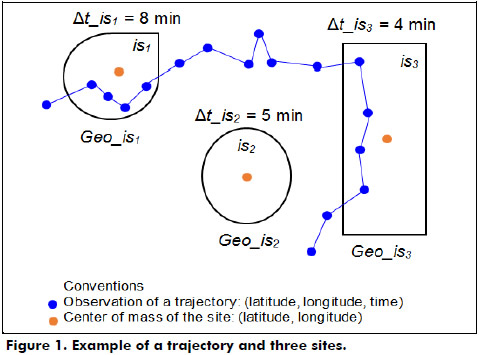
Subsequently, in Listing 1 we present the SMoT algorithm, and in Figure 1, we show a trajectory and three sites. Note that this trajectory has two possible stops: one at is1 and one at is3.

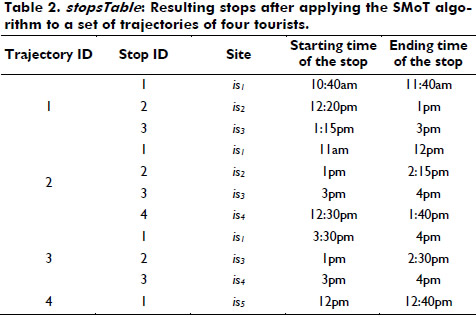
Suppose that after applying the SMoT algorithm to a set of trajectories of four tourists we obtained the results shown in Table 2 (stopsTable). The first row of the table indicates that the trajectory 1 had its first stop in the site is1 between 10:40 am and 11:40 am in a specific day. This trajectory had two other stops, one at site is2 and the other one at site is3.
Suppose that results indicate that the average time of tourists’ stops is one hour, and the average time of moves is half an hour. In addition, suppose that a tourist has four hours to do a tour. Consider the Equation (1).

N represents the number of sites that a tourist could visit considering time availability and the average time of stops and moves. With the previous information, N = ceil (4/(1 + 0.5)) = 3 (the ceil function rounds up to the next integer).
Let lSites be a set of N sites included in the set of all sites visited by a trajectory. The statisticsSetsOfNSites algorithm (Listing 2) finds the total number of trajectories, which visited each set of sites lSites that can be formed from the trajectories in the stopsTable.
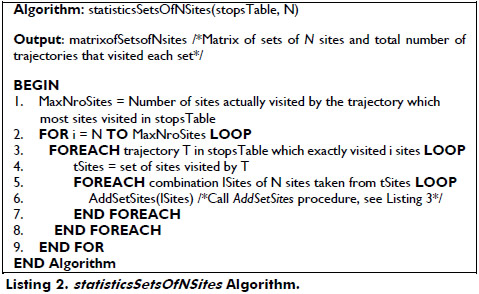
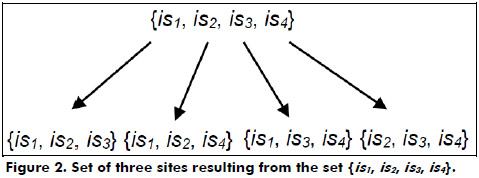
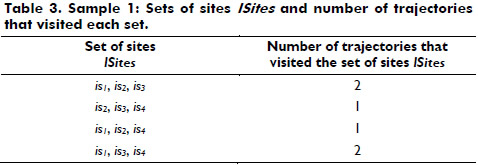
Considering the stopsTable shown in Table 2 and N = 3, the algorithm operates as follows: first it finds all the trajectories that visited exactly three sites. In this example, trajectory 1 visited the set of sites {is1, is2, is3} and trajectory 3 visited the set of sites {is1, is3, is4}. These two sets are added to the matrixofSetsofNsites matrix through the AddSetSites procedure. Then it finds all the trajectories that visited exactly four sites. In this example, trajectory 2 visited the set of sites {is1, is2, is3, is4}. From this set of four sites, all the sets of three sites are obtained (combinations of three in four) as shown in Figure 2. These are added to the matrixofSetsofNsites matrix through the AddSetSites procedure.
Note that the set {is1, is2, is3} was visited by two trajectories, trajectory 1 and trajectory 2. Similarly, the set of sites {is1, is3, is4} was also visited by two trajectories, trajectory 2 and trajectory 3.
The same process is then executed with all the trajectories that visited exactly 5, 6, 7,..., MaxNroSites sites, where MaxNroSites is the number of sites visited by the trajectory which most sites visited. In the example, trajectory 2 visited four sites. In Table 3 we show the results for this example. Note that if MaxNroSites >> N the execution time of the algorithm can be excessive due to the number of resulting combinations. In order to avoid this, a lower value may be considered for MaxNroSites. However, MaxNroSites must be greater than or equal to N.
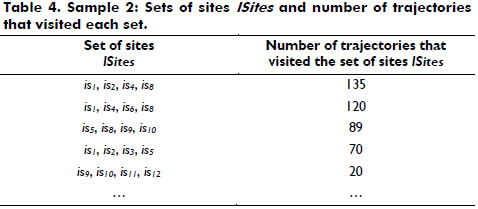
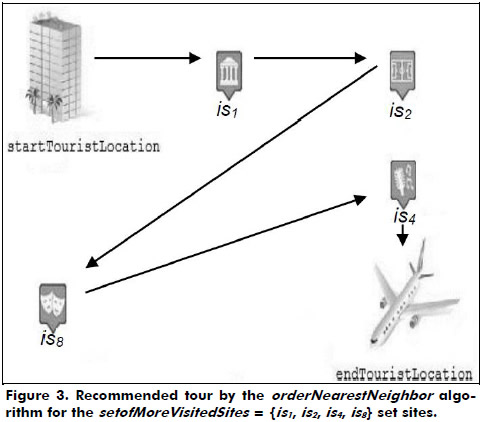
As a second example consider Table 4, generated by the statisticsSetsOfNSites algorithm, where N = 4. Table 4 indicates that the set of four sites that tends to be the most frequently included in tourists’ trajectories is setofMoreVisitedSites = {is1, is2, is4, is8}. In fact, 135 trajectories included these four sites.
Although the tourist could tour the set of sites setofMoreVisitedSites in any order, a tour order could be suggested according to a given criterion (a user preference). For example, consider the following criteria:
- Tourist classification: To first tour the sites that have the highest rankings by the tourists.
- Cost: To tour the sites according to their entrance fee, e.g., from the cheapest to the most expensive one.
- Distance: To tour the sites in such a way that the total distance could be minimized.
- Means of transportation: To tour the sites using the least number of transportation links, but meeting the tourist’s available time.
- Type of favorite sites: To first tour the most interesting sites for the user according to his preferences. For example, if the user prefers religious sites, the tour would give priority to sites such as churches.
- Type of activity: To tour the sites considering their type of activity and their schedules. For example, a nightclub should be visited at night, and a monument or museum in a dangerous neighborhood should be visited during the morning.
- Movement quality: To tour the sites in order to minimize turns, slopes (Nadi 2011), or to avoid travelling on roads that are in bad condition.
For example, if the goal is to minimize the travel distance (criterion three), we must face the well-known travelling salesman problem. To do this,, whose complexity is NP-hard, several heuristic algorithms, such as the nearest neighbor one and the heuristic insertion one (Nilsson 2003) have been proposed. Although these algorithms do not guarantee an optimal solution, they usually provide satisfactory solutions in a reasonable time for online applications.
Thus, we now propose a variant to the nearest neighbor algorithm (see Listing 4). The orderNearestNeighbor algorithm builds a tour that starts and finishes at the closest site to the tourist’s departure point (departureTouristLocation) and at the tourist’s arrival point (arrivalTouristLocation) according to the set of sites to be toured (setofMoreVisitedSites). For example, the departure point could be a hotel, and the arrival point could be an airport or the same hotel.
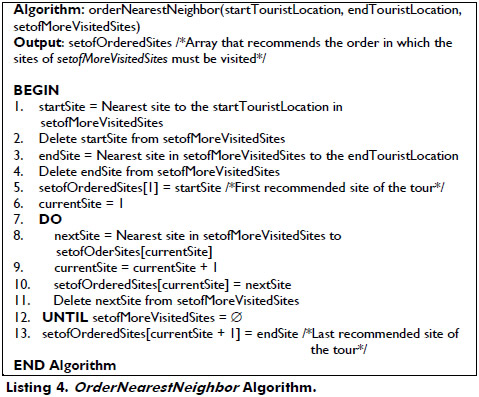
Example: For the set setofMoreVisitedSites = {is1, is2, is4, is8}, the orderNearestNeighbor algorithm works as follows:
- The two nearest sites to the departure point (startTouristLocation) and to the arrival point (endTouristLocation) of the tourist are chosen, is1 and is4, respectively (see Figure 3).
- Therefore, the tour starts at is1. The other sites (except is4 which will be the last site to be visited) are sorted according to the nearest neighbor algorithm.
- Considering that is2 and is8, is2 are the nearest to is1, the tour continues there and then to is8.
- The tour ends up at is4.
Although the orderNearestNeighbor algorithm recommends an order to tour the sites in setofMoreVisitedSites, this tour is not necessarily the shortest in distance. For example, Figure 4 shows the tour recommended by the orderNearestNeighbor algorithm for the set of sites {is11, is13, is15, is21, is24}. The total distance of this tour is 8 (1 +1 +1 +5) (considering the distance of the straight lines among the sites). However, we show that the optimal solution has a total distance of 7 (2 +3 +1 +1).
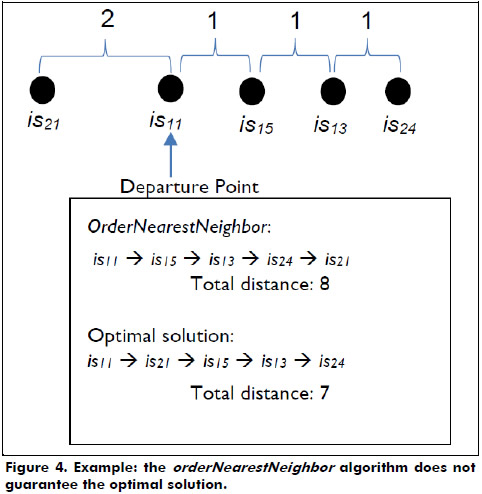
As a consequence, if the tour of minimum total distance is desired, it must be considered that this is an NP problem. Besides, in an urban context it is not always possible to travel from one place to another in a straight line due to obstacles such as buildings, traffic conditions, etc. (Krause 1987).
Experiments
For our experiments we developed a prototype oriented Google Maps application which implements the algorithms described in the previous section. This application presents a four layers architecture (Figure 5). Note that our prototype is not intended as a recommendation system but as a test application for our experiments.
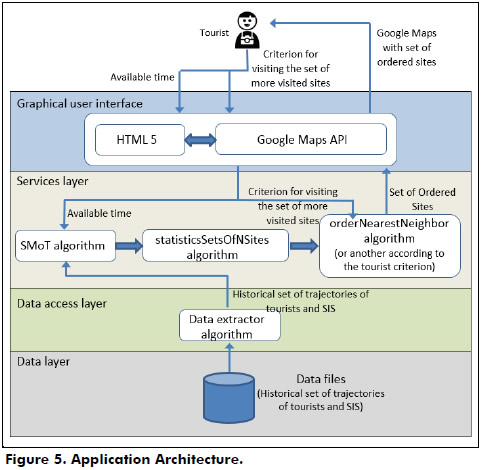
a) Data layer. Data layer stores historical trajectory datasets (data files). A trajectory is a set of records (x, y, t) where x and y represent latitude and longitude, and t represents time. This layer also stores the data of the interesting sites (SIS set, see SMoT algorithm).
b) Data access layer. The goal of Data access layer is to retrieve data (Data extractor algorithm) from the data files (trajectory datasets and SIS). This data is used as input parameters for SMoT algorithm.
c) Services layer. The Services layer receives data from the Data access layer. The SMoT algorithm processes the data in order to identify stops and moves of trajectories. These results are fed to the statisticsSetsOfNSites algorithm in order to generate the most visited sites sets. Next, the third algorithm in this layer receives this data along with the user criterion for visiting the most visited sites sets, and generates a tour order for this set.
d) Graphical user interface. The Graphical user interface is responsible for delivering user data (available time and criterion for visiting the most visited sites set) to Services layer, and for sending the results (set of ordered sites) to the user. More details are given below.
The data file for the data layer included 100 trajectories of vehicles in Rio de Janeiro. Data were provided by CET-Rio (2014). The total number of observations was 268000, i.e., an average of 2680 observations per trajectory. An observation is a tuple (x, y, t), where x and y are the co-ordinates representing the spatial location of the vehicle and t represents the time when the observation was generated. The time between observations was on average 2.5 minutes. 144 neighborhoods were considered as the sites to be analyzed.
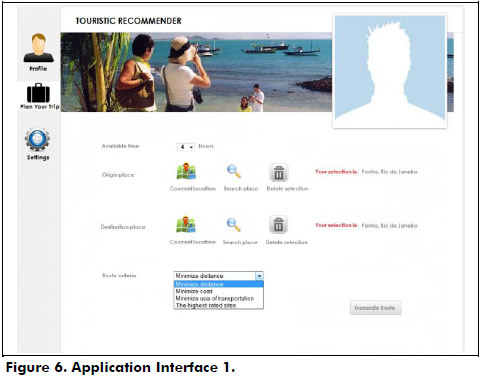
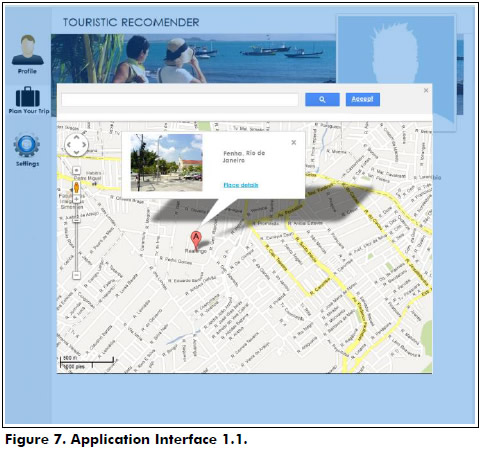
The Graphical user interface was developed with HTML 5 and the Google Maps API to display the results graphically. Thus, through this interface the user can enter the options for planning his tour. (Figure 6) In the interface, after clicking on "Plan your Trip", the user enters the available time for the tour. The user can also enter his departure and arrival sites. To enter his departure site, the user can click: i) in the "Current location" icon and using geo-location systems, the user’s location can be automatically obtained, or ii) in "Search place" where a pop-up window appears (see Figure 7) displaying the map of the selected city. There, the user can choose a site by clicking on one of the neighborhoods, or he/she can use the search box at the top of the window to locate a specific neighborhood. Using this latter option, the user can also enter his arrival neighborhood. In addition, he/she can select, from a drop-down list, the criterion that the algorithm will use to sort the set of sites to be visited (see Section 3). Finally, the user must click the "Generate Route" button.
The application was executed on a computer with 4 GB of RAM and a 2 GHz Intel ® Core ™ 2 Duo Processor. The average execution time was less than a second. After applying the SMoT algorithm with Δt = 3 minutes, we obtained 306 stops. The maximum number of visited neighborhoods by a trajectory was 16 (MaxNroSites) and the average number of stops by trajectory was 4. The average time of stops and moves was 45 minutes.
In our first experiment, we considered an available time of four hours to take a tour, and the departure and arrival point was the Penha neighborhood. The "Minimize distance" criterion was selected as shown in Figure 5. By applying the Equation (1) we obtained:
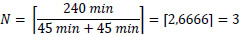
After executing the statisticsSetsOfNSites algorithm with N = 3, we obtained the results of Table 5.
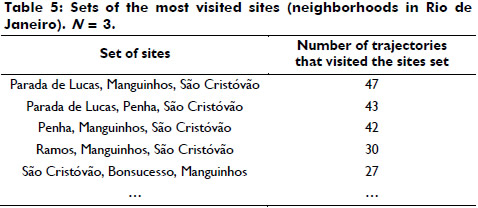
Our results showed that the set of neighborhoods most visited by the tourists was {Parada de Lucas, Manguinhos, São Cristóvão}. The Parada de Lucas neighborhood is crossed by the Avenida Brasil (the main avenue of Rio de Janeiro), which is one of the reasons why this neighborhood is highly frequented.
The Avenida Brasil also crosses the Manguinhos neighborhood and the Moorish Pavilion, one of the few Neo-Moorish style buildings in Brazil. Finally, the São Cristóvão neighborhood is a historic district of Rio de Janeiro where several highly frequented buildings and museums are located. Tourists often come to this neighborhood through the Avenida Brasil, which makes the set of neighborhoods {Parada de Lucas, Manguinhos, São Cristóvão} highly frequented.
Note that the system displays the results sorted according to the number of trajectories that visited each set of sites. In addition, when the user moves the mouse over any of the sites an emerging window appears (see Figure 8) where information about the site can be seen: means of transportation to get to it, tourist attractions, level of security, and environmental data. The user can also mark the site as a favorite one and score it from 0 to 5.
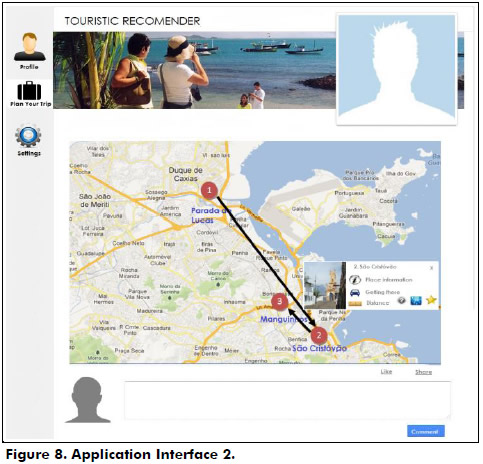
The user can now select the set of sites that he wants to tour (e.g., not necessarily the set of the most visited sites) or allow the system, by default, to indicate the tour for the most visited sites set.
When clicking on the "Generate" button, the application displays the tour on the map (the black arrows in Figure 8; note that we use the center of mass (latitude, longitude), see Figure 1, of the geometry that represents a site, as the co-ordinates that will be used in Google Maps). The sites’ names are highlighted in blue and their order on the tour with red circles according to the tour criterion selected by the user.
In a second experiment, we considered an available time of 7.5 hours to do a tour, and the departure and arrival point was the Penha neighborhood. "The highest rated sites" criterion was chosen. By applying the Equation (1) we obtained:
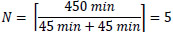
After executing the statisticsSetsOfNSites algorithm with N = 5, we obtained the results shown in Table 6.
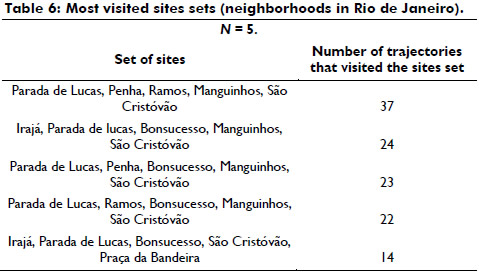
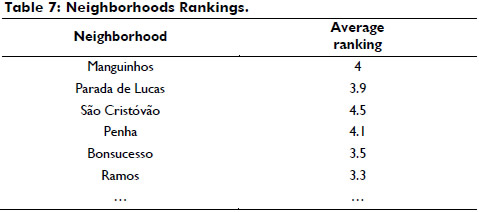
Our results showed that the most visited set of neighborhoods by tourists was {Parada de Lucas, Penha, Ramos, Manguinhos, Sao Cristovao} and according to the selected tour criterion, based on the average ratings of the sites (see Table 7), the recommended tour was: Sao Cristovao, Penha, Manguinhos, Parada de Lucas, and Ramos.
In another experiment, we considered 80 trajectories of tourists in the city of Medellín (Colombia). The data was provided by the AVIS (http://www.avis.com.co) car rental company. Due to private information protection, personal data was not revealed. Once again, we considered the neighborhoods as the interesting sites and N = 4. The results are shown in Table 8.
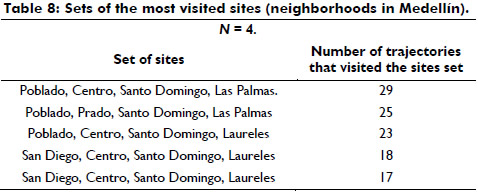
Subsequently, we considered the top 8 ranked sites in Medellín according to TripAdvisor (http://www.tripadvisor.com): Medellin Metrocable, Parque Explora, Museo de Antioquia, Jardín Botánico de Medellín, Plaza Mayor, Planetario de Medellín, Parque Biblioteca España, and Plaza Botero. Our results showed that the set of neighborhoods most visited by tourists was {Poblado, Centro, Santo Domingo, Las Palmas}.
We observed that our results were consistent with the TripAdvisor's ranked sites: Medellín Metrocable and Parque Biblioteca España are in Santo Domingo neighborhood; Parque Explora and Jardín Botánico are near the Prado neighborhood and Museo de Antioquia, Plaza Botero, and Plaza Mayor are in the downtown area (Centro). Poblado and Laureles are neighborhoods with hotels. Las Palmas and San Diego are neighborhoods with discos, restaurants, hotels, and shopping malls.
Conclusions and Future Works
In this paper, we proposed the statisticsSetsOfNSites algorithm to identify sets of N sites that are usually included (visited) in a set of trajectories of moving objects, e.g., tourists. This information may be useful not only in tourism (since it identifies tours including the most visited sites), but also in other fields. For instance, in advertising it would be very helpful to identify the sites where certain ads should be placed in order to increase their visibility; in urban planning to determine the point to locate a new attraction in order to promote its visits; and in traffic to create road corridors and transport routes which lead to improved traffic flow. We also presented a second algorithm, the orderNearestNeighbor algorithm, which recommends an order in which sites should be visited according to different criteria.
As future works, we plan the following additional studies: i) in a future version we will consider the start cold problem: currently we rely on the results of the SMoT algorithm which in turn rely on a historical dataset of trajectories. Without this information our system is unable to generate results; ii) the set of sites generated by statisticsSetsOfNSites algorithm could be far away from the user’s departure and arrival points, or their access could be difficult from these points (e.g., few transportation options, dangers associated with the tour). The system may then suggest a set of alternative sites which minimize these problems; iii) another issue is to identify tours that do not exceed the minimum stay threshold Δt (in practical terms this means that these sites were not actually visited). This information could be useful to discover sets of sites by which tourists passed near but did not enter, e.g., due to lack of knowledge (this suggests adding signals to make certain sites more visible) or because the sites are in dangerous areas; and iv) for the order of the tour we may consider additional variables such as a) the urban geometry, e.g., in a city, it is usually not possible to move from one place to another in a straight line (taxicab geometry (Krause 1987)), b) the ease of changing the route in real time (for example, let {is1, is2, is4, is8} be the set of sites to be toured in this order. Suppose that the user is at site is2 and then a problem prevents him to travel to is4 (e.g., a road or a site closure); the system could then re-program the set of remaining sites to be toured (Pillac 2011), and c) composition of plans, e.g., to plan different tours for a user, e.g., one for each day of a week in such a way that they fit the user requirements.
Acknowlegdements
We would like to thank Richard Romley for proofreading this paper and his many useful suggestions.
References
Adomavicius, G., Mobasher, B., Ricci, F., & Tuzhilin, A. (2011). Context-aware recommender systems. AI Magazine, 32(3), 67-80. [ Links ]
Álvares, L. O., Bogorny, V., Kuijpers, B., Vaisman, A., Moelans, B., & Fernandes de Macedo, J. A. (2007). A model for enriching trajectories with semantic geographical information. 15th annual ACM international symposium on Advances in geographic information systems (GIS '07), Bruxelles, Belgium. [ Links ]
Batet, M., Moreno, A., Sánchez, D., Isern, D., & Valls, A. (2012). Turist@: Agent-based personalised recommendation of tourist activities. Expert Systems with Applications, 39(8), 7319-7329. [ Links ]
CET-Rio Companhia de Engenharia de Tráfego do Rio de Janeiro. Available: http://www.rio.rj.gov.br/web/smtr/cet-rio. (Last access October 2014). [ Links ]
Chen, Z., Shen, H., & Zhou, X. (2011). Discovering popular routes from trajectories. In IEEE International Conference on Data Engineering (ICDE) (pp. 900-911). Hannover, Germany: IEEE. [ Links ]
Davari, N., Masoud Rahmani, N., & Taghizadeh, L. (2012). TKGS: Tourists keeping and guiding system. International Journal of Computer Applications, 48(22), 13-25. [ Links ]
Descamps-Vila, L., Casas, J., Conesa, J., Pérez Navarro, A., & Gutiérrez, I. (2011). Hacia la mejora de creación de rutas turísticas a partir de información semántica. In V Jornadas SIG Libre de Girona (pp. 107-119). Spain. [ Links ]
Gavalas, D., Kenteris, M., Konstantopoulos, C., & Pantziou, G. (2011). Personalized routes for mobile tourism. In IEEE 7th International Conference on Wireless and Mobile Computing, Networking and Communications (WiMob'2011) (pp. 295-300). Shanghai, China: IEEE. [ Links ]
Gutiérrez Losada, I., Conesa, J., & Geva, F. (2010). Ontologías turísticas geográficas: creación de una ontología sobre rutas turísticas (a pie o en bicicleta) por espacios naturales (pp. 1-21). Tech. Report, Universitat Oberta de Catalunya, Spain. [ Links ]
Higham, E., Holt, A., & Kearsley, G. (1996). Tourist flow reasoning: the spatial similarities of tourist movements. In 8th colloquium of the spatial information research center (pp. 69-78). Dunedin, New Zealand. [ Links ]
Huang, Y., & Bian, L. (2009). A bayesian network and analytic hierarchy process based personalized recommendations for tourist attractions over the Internet. Expert Systems with Applications, 36(1), 933-943. [ Links ]
Junmanee, S., & Hinze, A. (2011). Advanced recommendations in a mobile tourist information system. In ODBASE'06/OTM'06 Confederated international conference on On the Move to Meaningful Internet Systems: CoopIS, DOA, GADA, and ODBASE (Vol. I) (pp. 643-660). Montpellier, France. [ Links ]
Kaplan, E., & Hegarty, C. (2006). Understanding GPS principals and applications (2nd ed.). Artech House. [ Links ]
Kenteris, M., Gavalas, D., Pantziou, G., & Konstantopoulos, C. (2010). Near-optimal personalized daily itineraries for a mobile tourist guide. In 15th IEEE Symposium on Computers and Communications (ISCC'2010) (pp. 862-864). Riccione, Italy. [ Links ]
Krause, E. K. (1987). Taxicab geometry: An adventure in non-euclidean geometry. Dover Publications. [ Links ]
Leake, D. B. (2003). Case-based reasoning. Chichester, UK: John Wiley and Sons Ltd. [ Links ]
Lord, J. R. (2012). Voice activated language translation. Patente US 8103508 B2, USA. [ Links ]
Luberg, A., Tammet, T., & Järv, P. (2011). Smart City: A Rule-based tourist recommendation system. In R. Law, M. Fuchs, & F. Ricci (Eds.), Information and Communication Technologies in Tourism: ENTER 11 (pp. 51-62). Innsbruck, Austria: Springer-Verlag. [ Links ]
Moreno, A., Valls, A., Isern, D., Marín, L., & Borrís, J. (2013). SigTur/E-Destination: Ontology-based personalized recommendation of Tourism and Leisure Activities. Engineering Applications of Artificial Intelligence, 26(1), 633-651. [ Links ]
Nadi, S., & Delavar, M. R. (2011). Multi-criteria, personalized route planning using quantifier-guided ordered weighted averaging operators. International Journal of Applied Earth Observation and Geoinformation, 13(3), 322-335. [ Links ]
Nilsson, C. (2003). Heuristics for the Traveling Salesman Problem (pp.1-6). Tech. Report, Linköping University, Sweden. [ Links ]
Pillac, V., Gendrau, M., Gueret, C., & Medaglia, A. (2013). A review of dynamic vehicle routing problems. European Journal of Operational Research, 225(1), 1-11. [ Links ]
Restrepo, E., Moreno, F., & Sánchez Lasheras, F. (2013). Identification of frequent touristic routes using the SMoT algorithm. AIP Conference Proceedings, 1558(1558), 2325-2328. [ Links ]
Tsai, C., & Chung, S. (2012). A personalized route recommendation service for theme parks using RFID information and tourist behavior. Decision Support Systems, 52(2), 514-527. [ Links ]
Yang, W., Hwang, S. (2013). iTravel: A recommender system in mobile peer-to-peer environment. Journal of Systems and Software, 86(1), 12-20. [ Links ]
