


Services on Demand
Journal
Article
 English (pdf)
 Article in xml format
 Article references
 Send this article by e-mail
Indicators
-
 Cited by SciELO
 -
 Access statistics
Related links
-
 Cited by Google
 -
 Similars in
SciELO
Similars in
SciELO -
 Similars in Google
Share

 Permalink
Ingeniería e Investigación
Print version ISSN 0120-5609
Ing. Investig. vol.35 no.2 Bogotá May/Aug. 2015
https://doi.org/10.15446/ing.investig.v35n2.47773
DOI: http://dx.doi.org/10.15446/ing.investig.v35n2.47773.
Spatial and temporal estimation of the erosivity factor R based on daily rainfall data for the department of Atlántico, Colombia
Estimación espacial y temporal del factor de erosividad de la lluvia R a partir de registros diarios de precipitación para el departamento del Atlántico, Colombia
B. Ávila1, and H. Ávila2
1 Boris Ávila. Civil Engineer, Universidad del Norte, Colombia. PhD student, Universidad Federal de Río de Janeiro, Brasil. Affilation: Institute for Hydraulic and Environmental Studies, Universidad del Norte, Colombia. Email: boriavila@gmail.com.
2 Humberto Ávila. PhD. MS.c. Water Resources Engineering, University of Alabama, USA. MSc., Universidad de los Andes, Colombia, Civil Engineer, Universidad del Norte, Colombia. Affiliation: Assistan Professor at the Department of Civil and Environmental Engineering, Director Institute for Hydraulic and Environmental Studies, Universidad del Norte, Colombia. Email: havila@uninorte.edu.co.
How to cite: Ávila, B., & Ávila H. (2015). Spatial and temporal estimation of the erosivity factor r based on daily rainfall data for the department of Atlántico, Colombia. Ingeniería e Investigation, 35(2), 23-29. DOI: http://dx.doi.org/10.15446/ing.investig.v35n2.47773.
ABSTRACT
Soil erosion caused by rain is the detachment and movement of soil particles caused by the impact of raindrops on the surface. Erosivity factor R is a measure of the rain erosive power used for estimating the erosion rate with the RUSLE method (Revised Universal Soil Loss Equation). Estimating R factor requires rainfall intensity records of storms greater than 12.5 mm or greater than 6 mm but longer than 15 min. However, most of the Colombian rainfall stations have daily rainfall records with which it is not possible to estimate the intensity of each storm and, therefore, makes it difficult to estimate the R factor for a specific area. In this paper a methodology for estimating the erosivity factor R for the department of Atlántico, Colombia from daily records of 16 IDEAM stations is presented. The spatial distribution of the erosivity factor R in the department and its temporal distribution throughout the year are also shown. The results showed a minimum erosivity factor R of 6,894 MJ·mm·Ha-1·Hr-1·yr-1 and a maximum of 10,925 MJ·mm·Ha-1·Hr -1·yr-1. The average erosivity factor R for the department of Atlántico was 8,697 MJ·mm·Ha-1·Hr-1·yr-1. This methodology might be used for estimating the erosion factor R in different Colombian regions where high-resolution precipitation data is limited, but seasonal and orographic conditions should be considered for selecting the rain gages and the area of study.
Keywords: Soil erosion, erosivity factor, erosivity, RUSLE, soil erosion rate.
RESUMEN
La erosión del suelo por lluvia es el desprendimiento y movilización de las partículas del suelo a causa del impacto de gotas de lluvia sobre la superficie. El factor de erosividad R es una medida de la energía erosiva de la lluvia utilizada para la estimación de la tasa de erosión en el método de RUSLE (Revised Universal Soil Loss Equation). La estimación de este factor requiere de registros de intensidad de precipitación superiores a 12.5 mm o superiores a 6 mm con duración mayor a15 min con intervalos de captura menores a 30 min. Sin embargo, en gran parte del territorio colombiano se cuenta con registros diarios de precipitación con los que no es posible estimar la intensidad de cada evento de lluvia, y por lo tanto se dificulta la estimación del factor R para una zona específica. En este artículo se presenta una metodología para la estimación del factor de erosividad R para el departamento del Atlántico, Colombia a partir de registros diarios de 16 estaciones IDEAM. También se muestra la distribución espacial del factor de erosividad R en el departamento y su distribución temporal a lo largo del año. Los resultados obtenidos mostraron un factor de erosividad R mínimo de 6,894 MJ·mm·Ha-1·Hr-1·año-1 y un máximo de 10,925 MJ·mm·Ha-1·Hr-1·año-1. Y para todo el departamento del Atlántico, un factor de erosividad R promedio 8,697 MJ·mm·Ha-1·Hr-1·año-1. Esta metodología podría ser usada para estimar el factor de erosión R en distintas zonas de Colombia con limitados registros de precipitación de alta resolución, siempre y cuando se tenga en cuenta condiciones estacionales y orográficas para la selección de estaciones de lluvia y el área de estudio.
Palabras clave: Erosión de suelo, factor de erosividad, erosividad, RUSLE, tasa de erosión del suelo.
Received: December 10th 2014 Accepted: May 07th 2015
Introduction
Soil erosion due to rainfall is associated with the impact of rain drops on the soil surface which detach soil particles that are exposed to movement by flowing water. This type of soil erosion comes from exposing the soil to the erosive power of the rainfall energy and flowing water (Barfield, et al. 1983) and depends on the soil parameters (Huang, et al. 1983). One of the most used methods to estimate the soil erosion rate is the Revised Universal Soil Loss Equation RUSLE (Renard, et al. 1987) which was based on the The Universal Soil Loss Equation (USLE) (Wischmeier and Smith 1959, 1965, 1978), but includes the modifications in some factors after incorporating new research results.
The RUSLE method is given as:
A = R · K · LS · C · P (1)
where,
A = rate of erosion per unit area (Tonne·Ha-1)
R = erosive power of the rain (MJ·mm·Ha-1·Hr-1yr1)
K = soil erodibility factor (Mg·Ha·Hr·Ha-1·MJ-1·mm-1·yr-1)
LS = land slope and length factor
C = degree of soil cover
P = conservation practices
The erosivity factor R corresponds to the erosion power of the rain that causes soil erosion. This factor is not constant during a year but depends on the average annual hydro-logical rainfall regime for a specific area. The estimation of factor R is based on the sum of the erosivity index of individual storms greater than 12.5 mm or storms greater than 6 mm and longer than 15 min. The erosivity factor R Equation is given by:
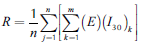
where,
E= total storm kinetic energy (MJ·Ha-1)
I30= maximum 30-minute rainfall intensity (mm·hr1)
j= counter for each year used to produce the average
k= counter for the number of storms in a year
m= number of storms in each year
n= number of years used to obtain the average R
The total storm kinetic energy is calculated as:

where,
ek= energy for each rain event
ΔVk= amount of rain during the increment k
k= time interval during which the intensity could be consider constant
p= number of interval of the hyetograph.
Wischmeier and Smith (1959) proposed the following Equation to estimate ek:
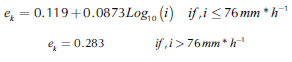
However, other authors suggest that the equation developed by Brown and Foster (1987) should be used for RUSLE equation (Renard et al. 1987), which is given by:
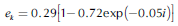
where,
i= average rainfall intensity (mm/hr)
The Equation on the metric system was reviewed by Foster et al. (1981)
The method requires having precipitation data with intervals lower than 30 min in order to estimate the average rainfall intensity. However, the available data in most of the Colombian regions are daily, which makes it difficult to get a good estimation of the factor R.
Different authors have estimated the erosion factor R based on daily and annual precipitation data in absence of rainfall intensity data. Elangovanand Seetharaman (2011) estimated the factor R for the region of Tamil Nadu in India based on daily data in the Krishanagiri watershed obtaining values from 704 to 2,849 MJ·mm·Ha-1·Hr-1·yr-1, by using 24 stations with daily data and 4 stations with data every 15 min from 2005 to 2009. Almoza and Schiettecatte (2007) correlated the erosivity factor R with precipitation based on 26 stations with daily data from 1964 to 1992. In Colombia, Carmona et al. (2003) estimated the erosivity factor R in the department of Caldas based on three stations with intensity data, obtaining a magnitude from 1,724 to 4,410 MJ·mm·Ha-1·Hr-1·yr-1. Other authors such as Diodato (2004) in Italy and Janecek et al. (2006) in Czech Republic estimated the erosivity factor R based on daily or annual rainfall data. In the Colombian Caribbean zone Perez and Mesa (2002) estimated the erosivity factor R from a methodology based on 6 stations from the Central and West area or Antioquia, and applied it to 134 stations, obtaining an erosivity map for Colombia. However, the estimation was based on annual precipitation data and the only station considered for the Colombian Caribbean was Puerto Bello in the department of Cesar, closed to the Sierra Nevada de Santa Marta, which is not quite representative for the Colombian Caribbean zone.
The objective of this study was to estimate the spatial and temporal distribution of the erosion factor R for the department of Atlántico, Colombia based on daily rainfall data correlated with a single station with higher resolution rainfall data. This methodology might be used for estimating the erosion factor R in different Colombian regions where spatial and high-resolution precipitation data is limited. However, it is necessary to take into account seasonal and orographic conditions for an adequate rain gage selection and correlation.
Methodology
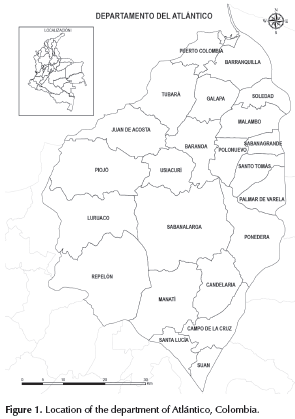
Historical data from 16 stations of the Instituto de Hidrología, Meteorología y Estudios Ambientales (IDEAM) located in the department of Atlántico, Colombia (Figure 1) were used. The IDEAM stations were divided into two categories depending on the data resolution: Type 1 stations were those with rainfall data with an interval lower than 30 min; and Type 2 stations were those with daily data.
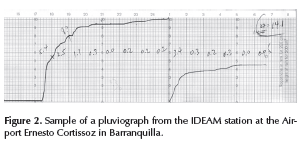
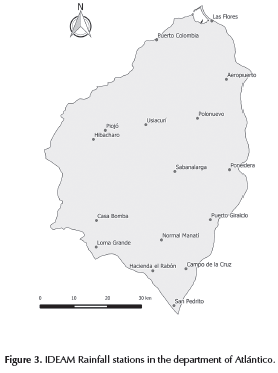
The only Type 1 station was located at the Ernesto Cortissoz Airport in Barranquilla, from which 113 pluviographs from 1971 to 1998 were obtained (Figure 2). The Type 2 stations with daily data from 1980 to 2011 were Las Las Flores, Puerto Colombia, Usiacurí, Polonuevo, Piojó, Hibácharo, Sabanalarga, Ponedera, Puerto Giraldo, Normal Manatí, Casa Bomba, Loma Grande, Hacienda El Rabón, Campo de la Cruz, and San Pedrito. The station Ernesto Cortissoz Airport also had precipitation daily data from 1980 to 2011. Figure 3 shows the location of the stations in the department of Atlántico.
The monthly multiannual analysis of precipitation from the 16 IDEAM stations showed a bimodal behavior in all the stations. From January to March the precipitation is low and increases from April to June. The precipitation decreases after July due to the San Juan Summer period, and then increases from August to November with the highest precipitation in October. The precipitation starts decreasing again in December.
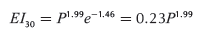
The highest 30-min intensity (l30) and the kinetic energy (E) where evaluated for the 113 pluviographs from the single Type 1 station (Ernesto Cortissoz Airport), in order to determine the kinetic energy index (El30) for each storm greater than 12.5 mm or greater than 6 mm and longer than 15 min. The Brown and Foster Equation was used for this estimation. Each EI30 was correlated to the daily precipitation (P) of the station (Figure 4) obtaining a fairly good adjustment with a R2 = 0.76 and an adequate residual behavior of normality and homoscedasticity.
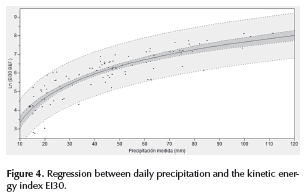
The obtained regression Equation is shown as follows:
Next, the correlation coefficient between all the rainfall stations and the Ernesto Cortissoz Airport station was calculated by using the monthly precipitation. This correlation was conducted in order to find some evidence that would allow correlating the El30 values from the airport station and the daily rainfall data from the other stations in the department of Atlántico evaluated in this research project. This assumption implies that the characteristics of rainfall intensity in all the stations are similar. However, this assumption may be validated as more rainfall data with intervals lower than 15 min are available. The average correlation coefficient obtained was 0.7, with a minimum of 0 in station San Pedrito and a maximum of 0.8 in station Las Flores, which suggest a fairly good adjustment considered the limited information.
Results
Based on the kinetic energy index Equation (El30) the erosivity factor R was estimated for each rainfall station in the department of Atlántico. Table 1 shows the results.
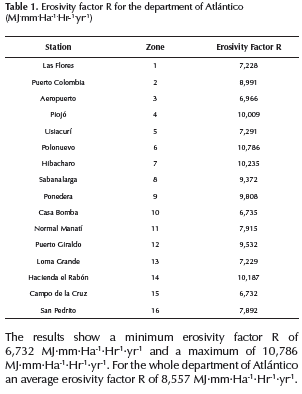
The results show a minimum erosivity factor R of 6,732 MJ·mm·Ha-1·Hr-1·yr-1 and a maximum of 10,786 MJ·mm·Ha-1·Hr-1·yr-1. For the whole department of Atlántico an average erosivity factor R of 8,557 MJ·mm·Ha-1·Hr-1·yr-1.
Spatial distribution of the erosivity factor R
The difference between the maximum and the minimum erosivity factor R was 4,054 MJ·mm·Ha-1·Hr-1·yr-1; therefore, is not appropriate to use an average erosivity factor R for estimating the erosion rate at specific areas in the department. Then, it is necessary to zone the erosivity factor R in order have a more reliable estimation of the erosion rate in agriculture, urban, or forest areas.
The spatial distribution of the erosivity factor R was conducted by using Thiessen polygons based on the rainfall stations (Figure 5). This tool is useful for the development of watershed management plans in natural, rural, and urban areas.
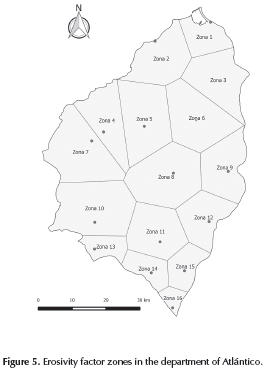
Table 1 shows the classification of each zone and its corresponding erosivity factor R.
Time distribution of the erosivity factor R
Erosion factor R has been found be influenced by seasonal effect in a study conducted in the central coffee growing region of Colombia (Hoyos et al., 2005). Richardson et al., (1983), Yu and Roswell (1996) proposed methodologies for estimating a monthly erosion including seasonal effect. The latter was found to be more robust for estimating the erosion factor R (Angulo-Martínez and Beguería, 2009).
Colombia does not have four seasons (Fall, Winter, Summer, and Spring), but only two: wet season and dry season. Therefore, a biweekly percentage distribution of the annual erosivity factor R was used in order to account for variability along a year by using the multiannual-average daily rainfall values in each rain gage. With the biweekly percentage distribution it was possible to identify that the months of May, September, October and November had the higher R factors, corresponding to the two rainy periods of the year in the area of study.
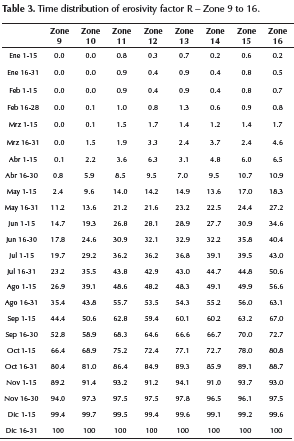
The erosion rate estimation in an area requires taking in to account the time frame within a year. In construction sites, for example, the erosion rate estimation depends on the construction schedule plan which defines the percentage area exposed to erosion and the time of construction (Pitt and Clark, 2007). Also, time distribution needs to be taken in to account in agricultural areas where the crop cycle modifies the soil exposure as well. Based on the daily data precipitation of each station (zone), a biweekly percentage of the annual precipitation was calculated for each station, in order to distribute the annual erosivity factor R during a year. Table 2 and 3 shows the biweekly time distribution percentage of the erosivity factor R in each station (zone).
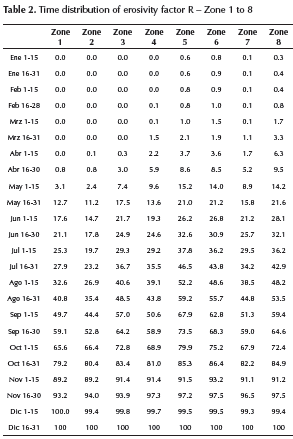
As an example, for a construction site that is located in Zone 1 and the soil is scheduled to be exposed from May the 1st to November 15th, the erosivity factor R is estimated as follows: the time percentage of Nov 1-15 is 89.4 %, and the time percentage of May 1-15 is 3.2 %, then the cumulative percentage of the period is the difference or 89.4 - 3.2 = 86.2 % Then, the erosivity factor in Zone 1 (annual) is 7,228 MJ·mm·Ha-1·Hr-1·yr-1. Therefore, for the construction period the erosivity factor R is 7,22 x 86.2 % = 6,230 MJ·mm·Ha-1·Hr-1·yr-1.
Spatial and monthly erosivity factor R
Monthly isoerosivity lines were generated for the department of Atlántico based on the spatial and time distribution analysis to identify the rainfall erosion potential along the department (Figure 6) by using kriging with ArcGIS 9.3®.
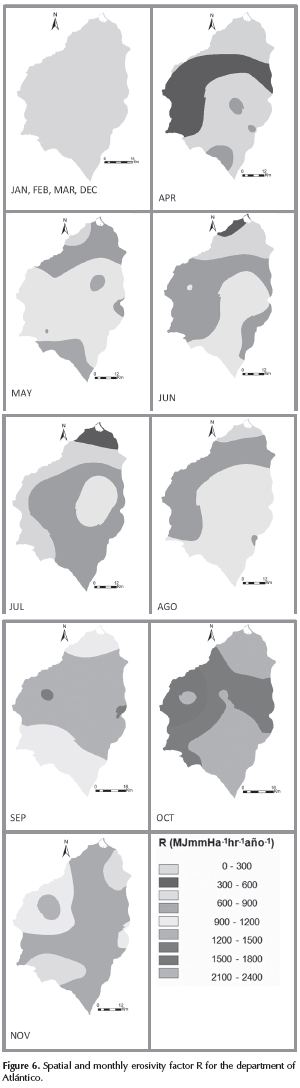
The isoerosivity lines show that on January, February, March and December the monthly erosivity is lower than 300 MJ·mm·Ha-1·Hr-1·yr-1. October is the month with the highest rainfall erosion potential with monthly values up to 2,400 MJ·mm·Ha-1·Hr-1·yr-1, mainly toward the West of the department in the towns of Juan de Acosta, Piojó and Luruaco. Nevertheless, it is possible to obtain higher erosion rates in other zones, given that it depends on other factors such as soil parameters, slope and soil cover, among others.
Conclusion and observations
The average erosivity factor R for the department of Atlántico is of 8,557 MJ·mm·Ha-1·Hr-1·yr-1, with a minimum of 6,732 MJ·mm·Ha-1·Hr-1·yr-1 and a maximum of 10,786 MJ·mm·Ha-1·Hr-1·yr-1.
The spatial distribution of the erosivity factor R allows for estimating more reliable erosion rates on specific sites within the area of the department.
The biweekly percentage distribution of the annual erosivity factor R provides a means to estimate the total annual erosion rate but also the erosion rate on intervals smaller than a year, which is useful for construction sites and agriculture activities with schedules smaller than a year, and program construction site erosion control plans as well.
The uncertainty of the erosivity factor R estimation based on daily data depends on the number of Type 1 stations (intervals lower than 30 min) and the correlation of the stations with daily data. The more Type 1 stations are considered and the higher the correlation among stations with daily data, the lower the uncertainty in the estimation of the erosivity factor.
This methodology might be used for estimating the erosion factor R in different Colombian regions where high-resolution precipitation data is limited, but seasonal and orographic conditions should be considered for selecting the rain gages and the area of study. Further work will be focused on comparing the effect of rain events that occur during the dry seasons and the rainy season.
References
Angulo-Martínez, M., & Beguería, S. (2009). Estimating rainfall erosivity from daily precipitation records: A comparison among methods using data from the Ebro Basin (NE Spain). Journal of Hydrology, 379(1-2), 111-121. DOI: 10.1016/j.jhydrol.2009.09.051. [ Links ]
Almoza, Y. & Schiettecatte, W. (2007). Metodología para la Estimación del Factor Erosividad de las Precipitaciones en el Modelo (RUSLE). Zonas Áridas, 11, pp.150-158. [ Links ]
Barfield, B.J., Warner, R.C., & Haan, C.T. (1983). Applied Hydrology and Sedimentology for Disturbed Areas. Stillwater, Oklahoma: Oklahoma Technical Press. [ Links ]
Brown, L.C., Foster, G.R. (1987). Storm Erosivity Using Idealized Intensity Distributions. American Society of Agricultural and Biological Engineers, 30, pp.379-386. DOI: 10.13031/2013.31957. [ Links ]
Carmona, G.P., Isaza, G.A. & Obando, F.H. (2003). Erosividad de Lluvias y Erodabilidad de un Andisol en la Zona Andina Central Colombiana. Suelos Ecuatoriales, 33, pp.87-94. [ Links ]
Diodato, N. (2004). Estimating RUSLE's rainfall factor in the part of Italy with a Mediterranean rainfall regime. Hydrology and Earth System Sciences Discussions, 8(1), pp.103- 107. DOI: 10.5194/hess-8-103-2004. [ Links ]
Elangovan, A.B., & Seetharaman, R. (2011). Estimating Rainfall Erosivity of the Revised Universal Soil Loss Equation from daily rainfall depth in Krishanagiri Watershed region of Tamil Nadu, India. In International Conference on Environmental and Computer Science, 19, pp. 48-52. [ Links ]
Foster, G.R., McCool, D.K., Renard, K.G., & Moldenhauer, W.C. (1981). Conversion of the universal soil loss equation to SI metric units. Journal of Soil and Water Conservation, 36, pp.355-359. [ Links ]
Hoyos, N., Waylen, P., Jaramillo, A. (2005). Seasonal and spatial patterns of erosivity in a tropical watershed of the Colombian Andes. Journal of Hydrology, 314, 177-191. DOI: 10.1016/j.jhydrol.2005.03.014. [ Links ]
Huang, C., Bradford, J.M., & Cushman, J.H. (1983). A Numerical Study of Raindrop Impact Phenomena: The Elastic Deformation Case. Soil Science Society of America Journal, 47, pp.855-861. DOI: 10.2136/sssaj1983.03615995004700050003x. [ Links ]
Janeek, M., Kubátová, E., & Tippl, M. (2006). Revised determination of the rainfall-runoff erosivity factor R for application of USLE in the Czech Republic. Soil and Water Research, 1, pp.65-71. [ Links ]
Pérez, J. & Mesa, O. (2002). Estimación del Factor de Erosividad de la Lluvia en Colombia. XV Seminario Nacional de Hidráulica e Hidrología Medellín, Colombia, pp. 29-31. [ Links ]
Pitt, R., Lake D. & Clark, S. (2007). Construction Site Erosion and Sediment Controls: Planning, Design, and Performance. Lansater, Pennsylvania: DEStech Publications, Inc. [ Links ]
Renard, K., Foster, G., Weesies, G., McCool, D., & Yoder, D. (1997). Predicting Soil Erosion by Water: A Guide to Conservation Planning with the Revised Soil Loss Equation (RUSLE). Agricultural Handbook No. 703: Washington, DC. United States Departament of Agriculture. [ Links ]
Richardson, C.W., Foster, G.R., Wright, D.A., (1983). Estimation of Erosion Index from Daily Rainfall Amount. Transactions of the American Society of Agricultural Engineers 26,153-160. DOI: 10.13031/2013.33893. [ Links ]
Yu, B., Rosewell, C.J. (1996). An assessment of daily rainfall erosivity model for New South Wales. Australian Journal of Soil Research (Aust. J. Soil Res.) 34, 139-152. DOI: 10.1071/SR9960139. [ Links ]
Wischmeier, W.H. (1959). A Rainfall Erosion Index for a Universal Soil-Loss Equation. Soil Science Society of America Journal, 23, pp.246-249. DOI: 10.2136/sssaj1959.03615995002300030027x. [ Links ]
Wischmeier, W.H. & Smith D.D. (1965). Rainfall-Erosion Losses from Cropland East of the Rocky Mountains. Agriculture Handbook No. 282. Washington, D.C.: United States Departament of Agriculture. [ Links ]
Wischmeier, W.H. & Smith D.D. (1978). Predicting Rainfall Erosion Losses. A Guide to Conservation Planning. Agriculture Hand Book No. 537. Washington, D.C.: United States Departament of Agriculture. [ Links ]
