


Servicios Personalizados
Revista
Articulo
 Inglés (pdf)
 Articulo en XML
 Referencias del artículo
 Enviar articulo por email
Indicadores
-
 Citado por SciELO
 -
 Accesos
Links relacionados
-
 Citado por Google
 -
 Similares en
SciELO
Similares en
SciELO -
 Similares en Google
Compartir

 Permalink
Ingeniería e Investigación
versión impresa ISSN 0120-5609
Ing. Investig. vol.35 no.2 Bogotá mayo/ago. 2015
https://doi.org/10.15446/ing.investigv35nl.46614
DOI: http//dx.doi.org/10.15446/ing.investigv35nl.46614.
Monitoring ground subsidence in urban environments: M-30 tunnels under Madrid City (Spain)
Monitorización de subsidencias del terreno en entornos urbanos: túneles de la M-30 en la ciudad de Madrid (España)
E. Sillerico1, P. Ezquerro2, M. Marchamalo3 G. Herrera4, J. Duro5, and R. Martinez6
1 Eleanor Sillerico. Doctorate student. Affiliation: Universidad Politécnica de Madrid, España. ETSI Caminos. Lab. Topografía y Geomática. E-mail: eleanor.sillerico@gmail.com.
2 Fablo Ezquerro: Doctorate student. Affiliation: Universidad Politécnica de Madrid, España. ETSI Caminos. Lab. Topografía y Geomática. E-mail: p.ezquerro.martin@gmail.com.
3 Miguel Marchamalo: PhD and Professor. Affiliation: Universidad Politécnica de Madrid España. ETSI Caminos. Lab. Topografía y Geomática. E-mail: miguel.marchamalo@upm.es.
4 Gerardo Herrera: PhD and Researcher. Affiliation: InSAR laboratory and Modeling group (InSARlab), Geoscience research department, Geological Survey of Spain (IGME). Madrid (Spain). E-mail: g.herrera@igme.es.
5 Javier Duro: Altamira Information, C/Còrsega, 381-387 E - 08037 Barcelona (Spain). E-mail: javier.duro@altamira-information.com.
6 Rubén Martínez. PhD and Professor. Affiliation: Universidad Politécnica de Madrid, España. ETSI Caminos. Lab. Topografía y Geomática. E-mail: ruben.martinez@upm.es.
How to cite: Sillerico, E., Ezquerro, P., Marchamalo, M., Herrera, G., Duro J., & Martínez, R. (2015). Monitoring ground subsidence in urban environments: M-30 tunnels under Madrid city (Spain). Ingeniería e Investigación, 35(2), 30-35. DOI: http://dx.doi.org/10.15446/ing.investig.v35n2.46614.
ABSTRACT
Big cities improvement usually requires the construction of large underground infrastructures, in order to ensure proper communication and optimize urban use. Monitoring ground subsidences is therefore one of the main challenges in changing urban environments. "Madrid Rio" project (2003-2008) is an effort to reclaim the riverfront land and improve the busy M-30 beltway that involved the construction of 7.93 km of tunnels underneath the southern center of Madrid City. This paper presents a remote-sensing approach to monitor ground subsidences induced by tunneling excavation. Persistent Scatterers Interferometry technique (PSI) was used to estimate subsidence and displacement time series from Synthetic Aperture Radar images, acquired between August 2003 and April 2008 from ENVISAT. Remote sensed results were compared to traditional extensometric measures, fitting adequately for selected sectors. Spatial analysis of displacements allowed evaluating impacts of tunneling on surrounding buildings and facilities, highlighting critical areas. The availability of a spatial distribution of displacements in a time series allowed analyzing longitudinal, cross-sectional and temporal dynamics. The main limitations found were the heterogeneous spatial distribution of Persistent Scatterers, the absence of measurement points in work areas, the threshold for velocity detection and low temporal resolution of ENVISAT images. Nevertheless, these limitations of DInSAR for monitoring infrastructures are overcome by actual satellites, being a complementary technique with an exceptional added value and temporal analysis capability.
Keywords: Differential SAR Interferometry (DInSAR), subsidence, tunnels, urban areas.
RESUMEN
Mejorar las grandes ciudades requiere la construcción de importantes infraestructuras subterráneas para asegurar la movilidad y la optimización del uso urbano del suelo. La monitorización es uno de los grandes retos del mega-proyecto "Madrid Río (2003-2008)". El soterramiento de la autovía de circunvalación M-30, que discurre junto al río Manzanares, requirió la ejecución de dos túneles gemelos. Este artículo presenta los resultados del estudio de las subsidencias que dichas obras indujeron en el terreno mediante el uso de la técnica DInSAR (Differential Interferometry Synthetic Aperture Radar), aplicada a las imágenes radar ENVISAT tomadas entre agosto de 2003 y abril de 2008, utilizando la técnica PSI (Persistent Scatterers Interferometry). Los resultados obtenidos se compararon con las medidas de los extensómetros tradicionales instalados en la zona, llegando a la conclusión de que esta técnica produce unos buenos resultados y es complementaria de cualquier otra tradicional.
Palabras clave: Interferometría diferencial SAR (DInSAR), subsidencia, túneles, áreas urbanas.
Received: October 21th 2014 Accepted: January 24th 2015
Introduction
In recent years the construction of urban tunnels in big cities has increased with the aim of improving urban transportation and restoring green areas. For instance, one of the main Madrid urban "rings", M-30 Street, was undergrounded with twin tunnels, resulting the "Madrid Rio Park" project. This mega project has recovered an area of 1,210,881 m2 transformed into a linear park (http://www.madrid.es.). Furthermore, the construction of urban underground infrastructures as "Metro" is also an example of how urban transportation infrastructures are compatible with the conservation of green areas in the city.
However, urban tunnels have a particular disadvantage: they are usually shallow (slight overburden in tunnels crown), which means that their excavation could cause settlements on surface damaging buildings and structures on that area. Monitoring of these underground infrastructures is extremely important during and after the construction stage. Despite current conventional monitoring techniques are very accurate (topography, levelling, etc.), they are quite expensive and limited to small areas. For these reasons, applications based on complementary techniques applied to wide areas and capable of analyzing time series and with positive relation profit/cost are being developed.
During the last decades, radar remote sensing techniques have become a complementary method for measuring ground surface displacements (Sillerico et al., 2010). Among all these techniques, differential SAR interferometry (DInSAR) has shown the capability for successfully measuring small displacement of structures with millimetric precision (Bru et al., 2013; Herrera et al., 2012; Karila et al., 2005). The DInSAR technique applied to measure surface subsidence has several advantages including large area coverage with a single image (10,000 km2), lower cost per m2 compared to conventional techniques and the possibility of obtaining data before, during and after the construction or phenomenon that is being studied (Tomás et al. 2013).
In this paper the Stable Point Network Technique (SPN), an advanced DInSAR technique that belongs to the Persistent Scatterer Interferometry (PSI) family, is applied to process ENVISAT-ASAR images to measure the deformational along an urban tunnel in Madrid. SPN technique provides a high density of ground targets (PS) where a clear displacement is detected. These DInSAR observations are then compared with the available monitoring measurements. Finally an attempt is made to relate the plausible origin of DInSAR observed displacements with the tunnel construction.
Description of the study area
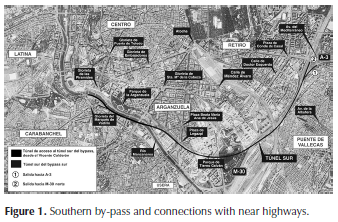
As in Europe, many relevant underground infrastructures, between 2003 and 2008, were built in the Metropolitan area of Madrid City (http://www.mc30.es.). One of them is the underground M-30 twin tunnels. M-30 Street was moved on into the underground tunnels near Manzanares River between 2004 and 2007. The structure consists of two unidirectional three way tunnels. The so-called southern by-pass located under Enrique Tierno Galván Park will be studied in this paper (Arias, 2008).
Twin tunnels were excavated by two Tunnel Boring Machines (TBMs) named as "Dulcinea" and "Tizona". Both TBMs were two of the biggest, fastest and most powerful TBMs all over the world until 2007, with a diameter of 15.20 m and a maximum production up to 1000 meters per month (Melis, 2005). TBMs worked non stopping since their startup. The total tunnelling length was 4,280 m in the southern tunnel and 3,650 m in the northern one (Figure 1).
On the 5th of November of 2005, Dulcinea began the Northern tunnel excavation, concluding its work on July the 17th of 2006 with a maximum output of 188 meters / week.
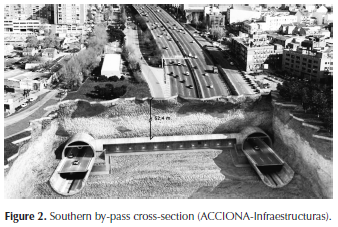
On the 20th of February of 2006, Tizona began its work in Southern tunnel excavation, ending the drilling on October the 30th of 2006 with a maximum output of 46 meters/day (Madrid Calle 30, 2007). The twin tunnels cross section is presented in Figure 2. Overburden ranges from 15 m in the launch pit to 60 m under Enrique Tierno Galván Park, the deepest part of the tunnel (Arias, 2008).
From the geological point of view, the study area is located in the Tertiary Madrid Basin. The materials include the "intermedias" (Penuelas) and "evaporitic" (gypsum) facies. Four stratigraphic units can be observed along the tunnel site. Two of them are tertiary materials, ranging from 6-7 m to 15-20 m the first ones (Penuelas) and lying under the gypsums. The other two stratigraphic units are quaternary, about 6-7 m, lie over tertiary ones; made-ground deposits were also found in the area. From the lithological point of view, the study area is composed by clays, sandy clays, loamy sands, sepiolites and massive and nodular calcic carbonate filled by clay (Arias, 2008).
During the M-30 Southern By-pass tunnels boring, monitoring and control of surface and underground deformations was essential. Therefore, ACCIONA Infrastructures used conventional techniques of subsidence measurement and control depending on the movement typology:
- Horizontal & vertical displacements measurement: levelling markers, settlements boxes and levelling nails.
- Vertical displacements measurements in depth: Rod extensometers anchored at different depths.
- Horizontal displacements measurements in depth: Inclinometers.
- Civil structures movements control (Buildings, service tunnels, collectors, etc.): tiltmeter, electrolevels and crack monitoring gauge.
Spn processing and results
The subsidence analysis of M30 tunnel has been done using radar satellite data and applying Differential Interferometry. Ground subsidence measurements have been obtained using a Persistent Scatterer Interferometry (PSI) technique called Stable Point Network (SPN). The description of this technique can be found in Arnaud et al. (2003) and Duro et al. (2005). This technique has been validated for subsidence analysis by Herrera et al. (2009).
The SPN algorithm uses the DIAPASON (Differential Interferometric Automated Process Applied to Survey of Nature) interferometric software for all SAR data handling, e.g. co-registration work and interferograms generation. The SPN method generates three main products from a set of Single Look Complex (SLC) SAR images (Duro et al., 2005): (a) the displacement rate (average deformation velocity) measured along line of sight (LOS) of single Persistent Scatterer (PS); (b) a map of height error; and (c) the LOS displacement time series of individual PS (as a function of time).
The SPN technique has been used to analyze 26 SAR images acquired by Envisat satellite covering the period from October 2003 to April 2008. An area of about 5x3 km2 in Madrid City Center (corresponding to the South by-pass tunnels) was analyzed. For the elaboration of the interfero-metric pairs threshold values for the perpendicular spatial baseline, the temporal baseline and the relative Doppler centroid difference have been selected (800 m, 3 years and 400 Hz respectively). The SRTM DEM (http://www2.jpl.nasa.gov/srtm/.) has been used to cancel the topographic component of the interferometric phase.
The pixel selection for the estimation of displacements was based on a combination of several quality parameters including low amplitude standard deviation and high model coherence. The model coherence, that considers the topography and the atmospheric terms of the differential phase, is an indicator of the degree of quality of the phase model adjustment. In this case, model coherence threshold of 0.5 has been used.
The results of subsidence in M30 tunnel area (5 km x 3 km) for the period 2003-2008, are shown in Figure 3. A total amount of 3221 PS (215 PS/km2) were detected within the influence area of the tunnel, about 120 m, where an average subsidence of 4.0 mm/year, has been measured. Once discovered a subsidence trend in the area we consider that taking into account the works over the area (material removing, complementary and service structures) are responsible of the uplifting points observed on the area.
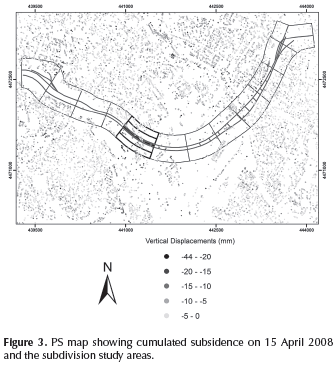
The M-30 tunnels trace was sectioned into 12 analysis sectors (Figure 3). Points with positive displacements have been discarded due to the aforementioned reasons, the low number of uplifting points (16.4%) and the target of the study (tunnelling related subsidence). New point selection shows a total amount of 2740 PS (183 PS/km2) where an average subsidence of 5.1 mm/year.
Analysis of results
Analysis of the influence of tunnelling
The relationship between DInSAR cumulated subsidence registered of the PS during 2003-2008 period, and distance to the tunnels axis, has been analyzed. Statistics for buffer areas hanging from 50 to 300 from the tunnel axis were calculated as the first step of this study.
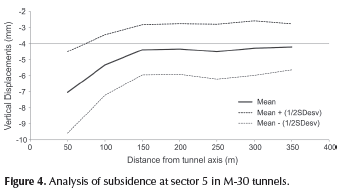
The plot shown in Figure 4 illustrates the PS subsidence at increasing distances. It can be observed that the closer to the tunnel axis, the greater will be the cumulated subsidence. Average subsidence ranges from 7.0 mm in the nearest 50 m to 4.2 mm at 350 m. Note that cumulated subsidence turns into a roughly constant value at a distance of 200 m from the tunnel axis. Therefore we can deduce that the influence area of the tunnel reaches 200 m far from the tunnel axis and the shape of the trend line matches with the shape of the typical tunnel subsidence "reverse Gauss curve" (Thai, 2010).
Longitudinal section analysis
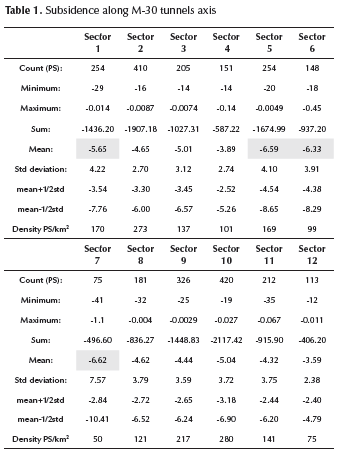
In this section we analyzed the variation of DInSAR results along the tunnel. Based on the results obtained in the previous section, the tunnel length was divided into 12 sectors (outlined polygons) of 200 m by 500 m each one (Figure 3). Statistics of DInSAR cumulated subsidence were calculated for each sector and available date, considering only downwards movements to assess the effect of tunnelling.
The results of this statistical analysis for the cumulated displacement, at the end of the 2003-2008 monitoring period, are shown in Table 1. The average PS density is 153 PS/km2 and the average cumulated subsidence is 5.1 mm. This average value is over passed in sectors1, 5, 6 and 7. Nevertheless, the PS density of sector 7 is low (only 75 PS/km2 were detected) and the average subsidence value may not be representative. Furthermore, sector 5 presents the highest PS density and is over the average subsidence; hence, it was selected for detail analysis.
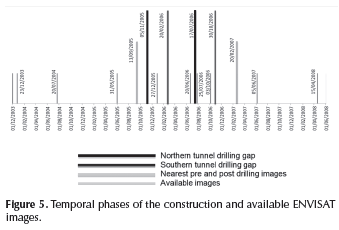
In order to analyze the temporal evolution of the subsidence, we considered the dates when SAR images were acquired, the tunnels were excavated, and the extensometer campaigns were performed (Figure 5).
The longitudinal tunnel profiles reveal ground subsidence in each sector during the period studied. Profile 8 shows the cumulative subsidence until 15/04/2008, date of the last image that was analyzed in this study and that sums up total displacement in the period. Profiles 5 and 6 fit quite well along the profile of the extensometer measured subsidences (Extensometers serie), as shown in Figure 6, except for the last stretch between 2+800 and 3+500 chainages, where a local relative high subsidences was measured in the northern side of the tunnels (Figure 3 Sector 10).
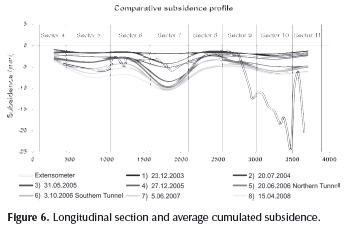
On the aforementioned Sector 10, 420 PS were detected. The maximum value is located in a rectangular area of 500 m x 50 m which was parallel to the tunnel axis with a cumulated subsidence of 19 mm (similar to measurements provided by leveling, 23 mm) while in the remaining PS (420), the average cumulated subsidence is 5.04 mm. This fact reveals an interesting area with a slightly different behavior that should be studied in detail.
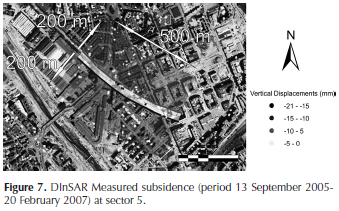
As shown in Table 1 and Figures 3 and 7, sector 5 presents a high value of subsidence, only exceeded by sector 7. In this sector the distance between both tunnels reaches its minimum, favoring a more intense subsidence. Works on the Line 3 underground of Madrid also started around these dates in this area. Therefore, this sector was selected to develop a detailed study of the subsidence trough in cross section.
Cross section analysis in sector 5
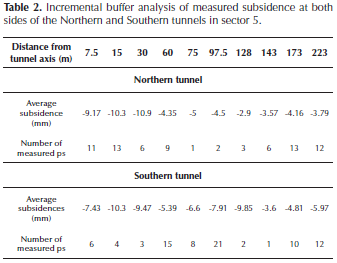
Sector 5 was selected for detailed analysis of subsidence in this area (400 m x 500 m). In this sector the twin tunnels present the minimum separation distance between them. Madrid Underground line 3 works were also carried out in this area at the same time. On this sector, buffers of different widths on each side of the axis were analyzed taking as zero reference the axis of the tunnel. Between 0 and 82.5 m, bands were 7.5 m width, between 82.5 m and 112.5 m, bands were 15 m width and between 112.5 m and 222.5 m, they were 30 m width. For each band means and standard deviations corresponding to the DInSAR subsidence cumulative measures were obtained for the 2003-2008 period (Table 2 and Figure 8). In Figure 8, only those sections with more than 5 PS (standard deviation 4.72) were taken into account to draw the subsidence trough.
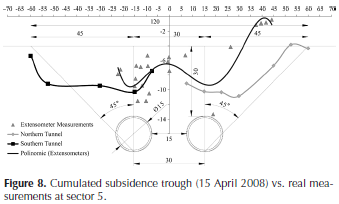
Southern by-pass tunnels are considered shallow tunnels, the relative depth is H/D ≤ 2 (H/D = depth / diameter of the tunnel) (Arias, 2008). Being its depth 30 m, the theoretical surface area affected by the subsidence is appointed by the projection of a line at 45 degrees to the vertical from the bottom of the tunnel, resulting, as shown in Figure 8, the affected width, at street level, about 120 meters, equivalent to 60 meters on each side of the axis. Cross section of Sector 5 was analyzed on chainage 0+750 (Legazpi Square), taking into account the width of influence (120 m).
Figure 8 shows the cross section of the by-pass tunnels subsidence trough measured by "in-situ" extensometers (triangles) with a trend line showing the deepest subsidence over the tunnels crown (Subsidence trough measured by extensometers).
These measures correlate with red and green lines calculated with the SPN technique. The red line represents the subsidence occurring at the right side of the southern tunnel and the green line shows the subsidence occurring at the left side of the Northern tunnel. It can be asserted that for both tunnels, the subsidence trough calculated with the SPN technique matches consistently with the extensometer subsidence trough. The three series are within the influence area of 45 degrees at each side of the central axis located between the two tunnels.
Discussion and conclusions
The analysis of ENVISAT radar images by satellite between 2003 and 2008, recorded with the SPN technique for the area where M-30 highway is located, allowed the detection of a total amount of 2740 PS (183 PS/km2), with an average cumulate subsidence of 5.1 mm, and a maximum recorded subsidence of 41 mm. Even though, there is large number of limiting criteria for settlements and angular distortion values in the geotechnical literature and standards (e.g. EN, 1990; CTE, 2006), a differential settlement of 25 mm is a commonly adopted value for structures and infrastructures to be damaged. In this case, since the average cumulated displacement is only 12 mm, a differential displacement of 25 mm is unlikely to be affecting the buildings located in the study area. However, since the maximum total displacement reaches 41 mm there could be singular scenarios were this limiting criteria could be overpassed. Therefore, a more detailed study should be carried out on specific local structures, which is clearly out of the scope of this paper. The average subsidence detected within 2003-2008 period does not represent any danger to buildings and surface structures due to its low value, under 25 mm.
Analyzed subsidence was validated with measured subsidence using conventional monitoring techniques along the alignment of the tunnels. To carry out that comparison average subsidence of the registered data in each sector were calculated due to the heterogeneous PS point distribution along the tunnels alignment that did not match with the location of topographic levelling points. Qualitative comparison between the two measurement techniques showed a good correlation. For instance, in Sector 5 the average subsidence measured with the SPN technique is 6.59 mm and it is very close to subsidence measured by topographic levelling 4.64 mm. Trend is validated in sector 10 due to the existence of 33 PS located in the zone of influence of tunnels alignment with a subsidence measured by DInSAR (19 mm), whereas the average sector moves only 5 mm. Levelling subsidence measurement (23 mm subsidence) matches consistently DInSAR local measurement but not with average measures for overall sector.
Sector 5 corresponds to an intersection area between M-30 tunnels and Madrid Underground Line 3, Subsidence trough of Northern and Southern M-30 tunnels was estimated, projecting a line at 45 degrees to the vertical from the bottom of the tunnel (Oteo, 1997). Considering this hypothesis, the surface area affected by tunnelling works would be 45 m on each side, with total amplitude of 120 m, taking into account the distance between tunnels and their diameters. DInSAR measurements fit the hypothesis, the nearest area (less than 35 m from tunnel axis) shows maximum subsidence (10 mm). Subsidence slightly decreases until 150200 m from tunnels, where measurements do not exceed the stability threshold of 5 mm (DInSAR vertical resolution).
In the Northern tunnel, ACCIONA Infrastructures recorded settlements using conventional techniques such as levelling markers, extensometers anchored at different depths and inclinometers. These extensometer measured settlements fit quite well in a double inverted Gaussian curve "settlement's trough" (Peck, 1967). The interpolated curve matches both the subsidence curves obtained from the SPN technique and the proposed trough model.
The SPN technique is able to detect sub-centimetric ground subsidence along the M-30 tunnels in Madrid. Subsidence detected by the SPN technique matches quite well the measurements provided by conventional monitoring techniques in tunnels.
However, some limitations of SPN DInSAR have been identified during its application to underground infrastructures, such as: heterogeneous spatial distribution of PS, absence of measurement points (PS) in vegetated areas, velocity detection limit about 15 cm/year for the ENIVSAT sensor and ENVISAT time resolution (35 days at best). All these factors limit measurement data according to customer requirements and hinder a continuous study in the axis of a linear structure.
Acknowledgments
ALTAMIRA INFORMATION provided the SAR images and processing.
References
Arias, J. (2008). Ejecución del túnel Sur del By-Pass Sur de la M-30, a master thesis presented at Escuela Técnica Superior de Ingenieros de Caminos, Canales y Puertos, Madrid (Spain). [ Links ]
Arnaud, A., Adam, N., Hanssen, R., Inglada, J., Duro, J., Closa, J., & Eineder, M. (2003). ASAR ERS interferometric phase continuity. Proc. IEEE International Geoscience and Remote Sensing Symposium (IGARSS-03), 21-25 July, Toulouse, France, Vol. 2, pp. 1133-1135. DOI: 10.1109/igarss.2003.1294035. [ Links ]
Bru, G., Herrera, G., Tomás, R., Duro, J., De la Vega, R., & Mulas, J. (2010). Control of deformation of buildings affected by subsidence using persistent scatterer interferometry. Memoirs Conference of Structure and Infrastructure Engineering. Murcia-España. [ Links ]
CTE. (2006).Código Técnico de la Edificación. SE-C Seguridad estructural de cimientos, Madrid (Spain), pp 160. [ Links ]
Duro, J., Inglada, J., Closa, J., Adam, N., & Arnaud, A. (2003). High resolution differential interferometry using time series of ERS and ENVISAT SAR data. FRINGE, Frascati, Italy, 1-5 December, 2003. [ Links ]
EN (1990). EN 1990: 2002 Eurocode. (2001). Basis of Structural Design, CEN. Europe. [ Links ]
Herrera, G., Fernandez-Merodo, J., Tomás, R., Cooksley, G., Mulas, & J. (2009). Advanced interpretation of subsidence in Murcia (SE Spain) using A-DInSAR data-modelling and validation. Nat. Hazards Earth Syst. Sci., Vol. 9, pp. 647-661. DOI: 10.5194/nhess-9-647-2009. [ Links ]
Herrera, G., Álvarez Fernández, M.I., Tomás, R., González-Nicieza, C., López-Sánchez, J.M., & Álvarez Vigil, A.E. (2012). Forensic analysis of buildings affected by mining subsidence based on Differential Interferometry (Part III). Murcia (Spain). Engineering Failure Analysis, Vol. 24, pp. 67-76. DOI: 10.1016/j.engfailanal.2012.03.003 [ Links ]
Karila, K., Karjalainen, M., & Hyyppä, J. (2005). Urban land subsidence studies in Finland using synthetic aperture radar images and coherent targets. The Photogrammetric Journal of Finland, Turka (Finland), Vol. 19, No. 2, pp. 43-53. [ Links ]
Madrid Calle 30. (2007). Apertura del túnel sur del by-pass sur de M-30. Programa de infraestructuras para la mejora de la movilidad 2003-2007. Madrid-España. [ Links ]
Melis, M. (2005). Las tuneladoras de 3 carriles de la M-30. Revista de Obras Públicas Vol. 3, 2005, Madrid (Spain), No. 454, pp. 71-106. [ Links ]
Peck, R.B. (1969). Deep excavation and tunnelling in soft ground. Proceedings of the 7 th International Conference on Soil Mechanics and Foundation Engineering, Mexico City, Vol. 3, pp. 225-290. [ Links ]
Oteo, C., & Rodríguez, J.M. (1997). Subsidencia y auscultación en los túneles del metro de Madrid. Revista de Obras Públicas, No. 3369, pp. 49-68. [ Links ]
Sillerico, E., Marchamalo, M., Rejas, JG., & Martínez, R. (2010). La técnica DInSAR: bases y aplicación a la medición de subsidencias del terreno en la construcción. Informes de la Construcción, Vol. 62, No. 519, pp. 47-53. DOI: 10.3989/ic.09.063. [ Links ]
Thai, G. (2010). Predicting Subsidence Resulting from Tunnel Excavation, a thesis presented at Waterloo University, Ontario (Canada). [ Links ]
Tomas, R., Romero, R., Mulas, J. et al. Radar interferometry techniques for the study of ground subsidence phenomena: a review of practical issues through cases in Spain. Environ Earth Sci. Doi: 10.1007/s12665-013-2422-z. [ Links ]
