


Services on Demand
Journal
Article
 English (pdf)
 Article in xml format
 Article references
 Send this article by e-mail
Indicators
-
 Cited by SciELO
 -
 Access statistics
Related links
-
 Cited by Google
 -
 Similars in
SciELO
Similars in
SciELO -
 Similars in Google
Share

 Permalink
Ingeniería e Investigación
Print version ISSN 0120-5609
Ing. Investig. vol.35 no.3 Bogotá Sept./Dec. 2015
https://doi.org/10.15446/ing.investig.v35n3.47386
Doi: http://dx.doi.org/10.15446/ing.investig.v35n3.47386.
New digital demodulator with matched filters and curve segmentation techniques for BFSK demodulation: Analytical description
Nuevo demodulador digital con filtros macheados y técnicas de segmentación de curvas para la demodulación de señales BFSK: Descripción analítica
J. Torres1, F. Hernández2, and J. Habermann3
1 Jorge Torres Gómez: BSc. in Telecommunications and Electronics, MSc. in Telecommunication Systems, Affiliation: Department of Telecommunications and Telematics, Electrical School, CUJAE, Cuba.
E-mail: jorge.tg@electrica.cujae.edu.cu.
E-mail: jtorres151184@gmail.com.
2 Fidel Ernesto Hernández Montero: MSc in Digital Systems from CUJAE in 2000, PhD degree in Electronics and Industrial Automation from University of Mondragon, Spain, in 2006, Affiliation: Department of Telecommunications and Telematics, Electrical School, CUJAE, Cuba.
E-mail: fhernandez@electrica.cujae.edu.cu.
3 Joachim Habermann: Dr.-Ing. (PhD) degrees in Electrical Engineering both with highest honors from the Technical University of Darmstadt, Germany. Senior member of the Institute of Electrical and Electronics Engineers (SM IEEE). Reviewer of several research institutions, such as the Deutsche Forschungsgemeinschaft (DFG), Affiliation: full professor in the Department of Electrical Engineering and Information Technology of the Technische Hochschule Mittelhessen (THM), University of Applied Sciences Giessen, Germany.
E-mail: joachim.habermann@iem.thm.de.
How to cite: Torres, J., Hernández, F., & Habermann, J. (2015). New digital demodulator with matched filters and curve segmentation techniques for BFSK demodulation: Analytical description. Ingeniería e Investigación, 35(3), 92-99. DOI: http://dx.doi.org/10.15446/ing.investig.v35n3.47386.
ABSTRACT
The present article relates, in general, to digital demodulation of Binary Frequency Shift Keying (BFSK). The objective of the present research is to obtain a new processing method for demodulating BFSK-signals in order to reduce hardware complexity in comparison with other methods reported. The solution proposed here makes use of the matched filter theory and curve segmentation algorithms. This paper describes the integration and configuration of a Sampler Correlator and curve segmentation blocks in order to obtain a digital receiver for a proper demodulation of the received signal. The proposed solution is shown to strongly reduce hardware complexity. In this part, a presentation of the proposed solution regarding the analytical expressions is addressed. The paper covers in detail the elements needed for properly configuring the system. In a second article the implementation of the system for FPGA technology and the simulation results in order to validate the overall performance are presented.
Keywords: Matched filters, curve segmentation, digital demodulation, BFSK, FPGA.
RESUMEN
El presente artículo está relacionado con la demodulación digital de la señal Binary Frequency Shift Keying (BFSK). El objetivo de la investigación es en la obtención de un nuevo método de procesamiento para demodular señales BFSK, el cual presenta menos complejidad en hardware que los reportados hasta la fecha. El sistema propuesto hace uso de la teoría de filtros adaptados y de los algoritmos de segmentación de curvas. El artículo describe la integración y configuración de un bloque de correlador por muestreo con un bloque de segmentación de curvas con el objetivo de obtener un receptor digital para demodular apropiadamente la señal recibida. La solución propuesta reduce considerablemente la complejidad en hardware. En esta parte se expone el sistema abordando de forma analítica las expresiones que lo describen. El artículo aborda en detalle los elementos necesarios para la configuración del sistema. En una segunda parte se muestra la implementación del sistema en FPGA así como los resultados de simulación que validan el desempeño del sistema.
Palabras clave: Filtros adaptados, segmentación de curvas, demodulación digital, BFSK, FPGA.
Received: November 20th 2014 Accepted: July 22nd 2015
Introduction
Frequency Shift Keying (FSK) is a digital modulation format with applications in wireless technologies (Ibrahim et al., 2013) (Peng et al., 2013), satellite communications (VEŘTÁT, MRÁZ, 2013), power lines communications (PLC) (Ouahada, 2014), mobile communications (Karabulut, 2015), spread spectrum systems (Neifar, 2012) and biomedical applications (Wang, 2014). Various configurations of circuitry have previously been reported for BFSK demodulators. Some of them, especially those based on a correlator receiver model, are particularly interesting because they perform signal to noise ratio maximization (Sklar, 2001) and do not use symbol sychronization blocks, such as Quadricorrelator (Gardner, 1985), Balanced Quadricorrelator (Kang et al., 2011) and Quotient Detector (Kreuzgruber, 1994).
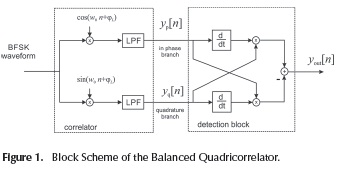
These types of detectors are implemented in a two-part structure The first part is an analogue correlator (Egau, 1984); the second part includes procedures for derivation, addition and multiplication, in order to extract the instantaneous frequency. Figure 1 depicts the block diagram of the Balanced Quadricorrelator. However, due to the large number of adders and multipliers needed for the lowpass filter (LPF) implementation, such digital implementations demand a high cost.
Although the low pass filter and the multiplication procedure could be obtained through a flip-flop element, as in the digital logic quadricorrelator scheme of (Ahn et al., 2005), and the differentiator can be accomplished by flip-flop blocks followed by AND-gates, this type of solution is prone to instabilities under conditions of low signal to noise ratio. This causes total interruption of the counting process at the system output, despite its low hardware consumption.
The method discussed in this paper outperforms all previous correlator-based schemes, in terms of hardware complexity. A new BFSK detection correlator-based scheme, directed to the slope recognition instead of the instantaneous frequency at the correlator output, is devised. This article addresses in detail the analytical expressions used to describe the proposed solution, which exhibit a strong reduction with regard to hardware complexity.
The rest of the paper is organized as follows: Section 2 summarizes the proposed solution in a descriptive way, for ease of exposition. Section 3 addresses the analytical expressions for configuring the proposed solution. Section 4 addresses a discussion with regard to hardware complexity. Finally, the Conclusions are presented in Section 5.
Receiver conception. Cualitative description.
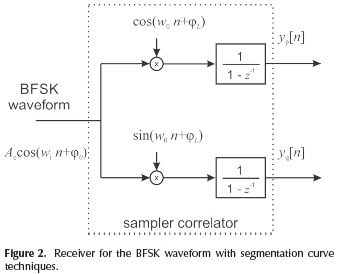
In the scheme proposed in this paper a Discrete Correlator (Lee et al., 1950) is employed in order to reduce hardware complexity (the scheme is depicted in Figure 2). The correlator is configured with a local tone of frequency w0 and phase φL. The received BFSK waveform arrives with a frequency wi either 0 or 1, with phase φo and amplitude given by Ac.
At the output of the sampler correlator, linear segments are obtained in the temporal series of yp[n] and yq[n] for the in phase and quadrature branches, respectively. The slope of these segments depends on the symbol received. For instance, considering the result shown in Figure 3, it can be noted that with the received lower frequency wi the output of the correlator is comprised by segments of zero slope (e.g.  and
and  ). On the other hand, with the received higher frequency w0, the output is comprised by segments of non-zero slope (e.g.
  ).
).
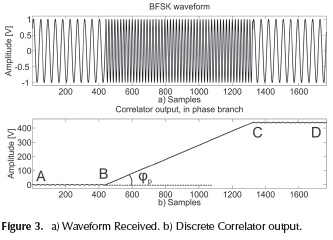
The main idea of the proposed receiver is to identify the approximate linear signal ramp observed at the output of the correlator for a sine-wave input (Sklar, 2001), and, by means of this procedure, to identify the symbols received. The change of slope in the curve showed in Figure 3b is directly related to the symbol transmitted. Therefore, methods for recognizing such changes can be employed for demodulation purposes.
The curve in Figure 3b is comprised by the linear segments , and , and the split of a curve into linear segments is a task intensively studied in the field of curve segmentation by means of two categories (Inesta et al., 1998): feature point approach and error tolerance approach. This paper addresses those methods based on the feature point approach.
Methods of feature point approach identify dominant points, such as B and C, by means of a curvature measurement. Consequently, this measure can be directly related to the slope of each segment. The techniques of curve segmentation can be employed for extracting the tanφ of each segment on Figure 3b.
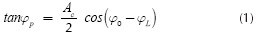
In average, the slope of segment is approximately zero, whereas the slope of segment can be described, for the in phase branch, as in (Sklar, 2001):
For the quadrature branch a similar results is obtained:
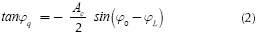
Considering the values of the slope in Equations (1) and (2), a receiver can be implemented by squaring the tangent functions in Equations (1) and (2), which yields to:
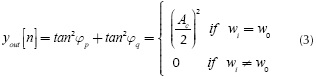
Summarizing, the proposed solution uses the sampler correlator of Figure 2 in order to obtain the linear curves, the slope that can be estimated by curve segmentation techniques. After estimating the slope values in Equations (1) and (2), the operation in Equation (3) is performed for obtaining high and low levels and then recovering the transmitted bits. The general scheme is depicted in Figure 4 and the output is depicted in Figure 5.
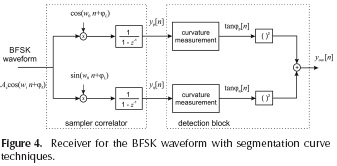
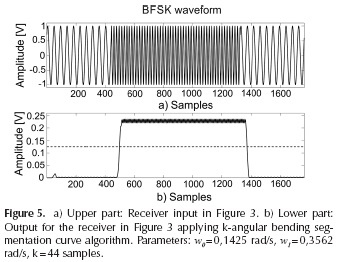
From Figure 5 it can be noted that the pulses in b) can be used to detect the frequency received in a); this detection can be accomplished by means of threshold (dotted line), the value that is determined in Section 3.
Curvature measurement methods
Once the signal of the sampler correlation output is obtained, the estimation of the slope of each segment follows. To that end, the use of curvature measurement methods is analyzed.
Methods such as k-cosine (Wang et al., 2010), k-angular bending (Inesta et al., 1998), Distance Accumulator (Han, Poston, 1993) and Scatter Matrix (Anderson, Bezdek, 1984) are usually employed to measure the curvature from images. Among this methods, the k-angular bending is the only one that does not implement a division procedure for estimating the slope. This is an important issue concerning a practical implementation in hardware, for instance in FPGA, since a division procedure can produce undesirable glitches at the output. Therefore, the implementation of k-angular bending is considered here for implementing the block curvature measurement depicted in Figure 3.
k-angular bending foundations
This method estimates the slope for each segment calculating the ratio between the incoming values and the time index in a sliding window of length k. At the same time, an average procedure is also implemented for reducing the effect of noise. The value for tanφ[n], for the quadrature and the in phase branches, is obtained through the following relation:
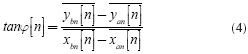
where:
y1: samples of the curve
i: time index of the curve
k: length of the window
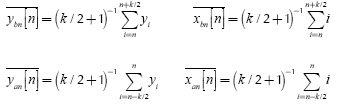
The average procedure is obtained with the previous definition of  and
and  . The expression given in Equation (4) can also be simplified as indicated by:
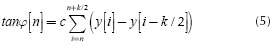
where:
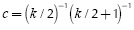
Considering the numerator in Equation (4), the expression can be simplified as:
Considering the denominator in Equation (4), the expression can be simplified by means of:

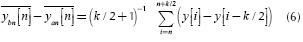
Then, when applying this procedure in the curvature measurement block of Figure 3, the output signal will be high or low, corresponding to the higher or lower frequency of the input signal, respectively (see Figure 4). Thus, changes in those levels can be employed for detecting the symbol transmitted. For this purpose, a proper threshold must be derived, which is addressed in the next Section. The expression given in Equation (6) is useful in the digital implementation of the system, an issue that will considered in the second part of this paper.
Receiver conception. Analytical description
in order to recover the bits transmitted, it is necessary to establish a threshold for identifying the high from the low levels at the output of the receiver. This is indicated by the dotted line in Figure 5b).
When the operation in Equation (3) is performed, additional A2 oscillation is introduced around the expected values  and 0, in the absence of noise. These oscillations are easily verified in the high level of Figure 4b they are produced by the multiplication of the received signal with the local tone. Besides, the amplitude of these oscillations depends on the levels at the output of the system, and this can be verified on Figure 4b. In this case, the high level exhibits an oscillating behavior with higher amplitude than the low level.
In order to establish a threshold, the oscillations produced by the operation given in Equation (3) must be considered. Taking into account that the amplitude of these oscillations depends on the binary levels, then the threshold is not easily established as the half of the maximum amplitude; it also depends on the oscillating terms. In order to obtain a proper value for the threshold, it is necessary to analytically describe the proposed system, and this is addressed by the following steps:
1. The obtaining of the analytical expressions for yp[n] and yq[n] of Figure 2.
2. The obtaining of the variance around the binary levels at the output of the system of Figure 4.
Analytical expression foryp[n] andyq[n]
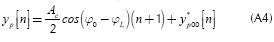
To obtain the analytical expressions, there are two cases to be described. The case in which the lower frequency is received, w1 and the case of the higher frequency, w0. For the latter, the output of the correlator is as follows (details are given in the Appendix A):
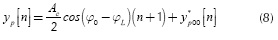
where:
From Equation (8) it can be observed that the first term is directly related to the ramp signal, and this is described by the segment on Figure 3b). This segment has a maximum slope given by  , which means that the maximum voltage at the output of the correlator will be given by (N +1 ), where N represents the total number of samples between transitions. Thus, the system used to implement the receiver in Figure 4 should be capable of storing this value. Additionally, once the detection block identifies a transition, then a reset on the accumulator block can be settled. By this mechanism, the values of yp [n] and yq [n] will be set to zero in order to avoid larger values than ( N + 1)
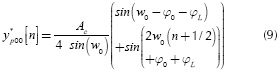
The slope of is the segments in the phase and quadrature branches are the average value to be estimated by the k-bending method. On the other hand, there is also an oscillating term, denoted by  in Equation (9), which produces the oscillating behavior at the output of the system. For the quadrature branch a similar description to Equation (8) is obtained, except that φL must be replaced by
 .
.
On the other hand, the analytical description when the received frequency is w} is given by the relation (A3) in the Appendix,when wi = w0 , and denoted by . In this case, the slope is zero in average; this is graphically described by the segments and in Figure 3.
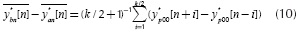
Variance at the output of the system.
The variance at the output of the system is given by the different way for the ease of calculation as follows: oscillating term for the high levels and  for the low levels. The method of k-bending performs the sum indicated in Equation (6), which can be arranged in a different way for the ease of calculation as follows:
Taking into account the use of trigonometric identities for the subtraction of sine functions, the term  can be simplified as:
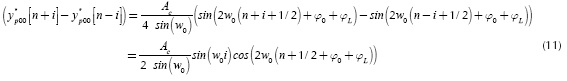
An upper bound for Equation (11) can be obtained by:
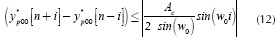
According to the upper bound in Equation (12), which is independent of the time index n, the sum in Equation (10) can be upper bounded as follows:
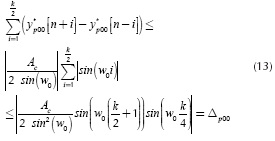
This sum formula is obtained by straightforward methods, described in Appendix B. The relation in Equation (13) is also valid for the quadrature branch, since the phase terms φ0 and (φL have been neglected; this is denoted by Δq00.
Finally, the variance of the outputyout[n], for wi = w0, can be upper bounded by:
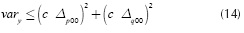
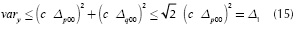
The quantities given by Δp00 and Δq00 are equal in value, and they represent the maximum amplitude of the oscillations at the output of the square procedure for both branches in Figure 4. However, these oscillations are orthogonal, thus the sum in Equation (14) can be upper bounded as:
given that the maximum value of the sum of a sine and a cosine function is √2. Secondly, when w}i≠w0 the variance of the output yout [n] can be obtained by means of the procedure implemented for obtaining Equation (15). In this case, two tones, one of them at the frequency comprises two tones, one of them at the frequency  and the other tone at , as described in Equation (A3), in Appendix A. Similar to Equation (15), an upper bound can be obtained as:
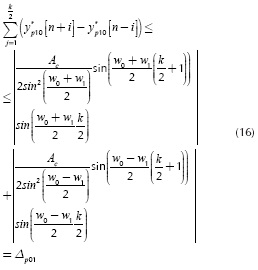
For the quadrature branch, a similar upper bound is obtained; this is denoted by Δq01. Finally, after squaring and multiplying by √2c2, an upper bound is obtained by:
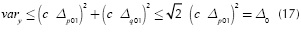
Once the variances are obtained around the high and the low levels, a threshold can be established for detecting the transitions. In case of the high level, the amplitude of the oscillation is given by Δ1 in Equation (15), with a direct component equal to , as given in Equation (3).
For the low levels, the amplitude of the oscillation is given by Δ0. As such, the threshold must be established in some intermediate point between and Δ0. Here the threshold is placed on the middle for increasing the margin noise as:
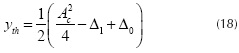
The threshold given in Equation (18) is employed to distinguish the low and high levels of the output signal; Figure 5 b) shows the result by means of dotted line with Δ1 = 0,0637, Δg = 0,0108, and yth = 0,1250. The terms Δ¡ and Ag represent the effect of the oscillating terms. The use of this relation is affordable if the amplitude of the oscillations around the high and low levels are not comparable, that is, if . Otherwise, a lowpass filter can be employed at the output of the system to attenuate the amplitude of such oscillations. The precision in the determination of transitions, given by the threshold and the risetime of the pulses, is directly related to the total number of bits to be demodulated without errors, an issue that will be analyzed in Section 2.4.
Besides, the length of window k can be established for attenuating Δ1 or Δ0 in Equations (15) and (17). Depending on which oscillating term is the highest, k may be chosen in order to make zero the sine function.
In case that the value of AC is unknown, the expression given in Equation (18) requires to estimate this value. This is due to the fact that the output of the system is comprised by high and low levels. However, these levels can be transformed into bipolar pulses if the direct component (DC level) of the output sequence yp[n] is supressed. This can be achieved through the use of a Notch filter, the transfer function given by (Proakis, Manolakis, 2006):
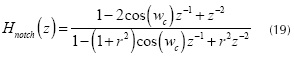
where r and wc represent the radius of the pole and the center frequency of the filter, respectively. In order to suppress the DC level, the value of wc must be settled to zero. In this case, the expected value will be zero and the threshold can be settled to yth=0.
Discussion
With regard to hardware complexity, the proposed scheme, with the description given in Figures 4, needs 7 adders and multipliers. Three adders comes from the accumulator blocks and the output of the system, two multipliers are from the squaring devices and the others two from the multiplier at the beginning of each branch. In addition, the curvature measurement blocks can be implemented with 2 FIR filters by means of a moving average structure (Oppenheim et al., 2010) without multipliers, since all the coefficients are equals to 1 as indicated in 5. Finally, through the use of the notch filter in Equation (21) a total of 7 adders and multipliers are also needed if the value of Ac is unknown.
On the other hand, considering the system for the Balanced Quadricorrelator in Figure 1, a total of 7 adders and multipliers with another 4 FIR filters are required. Comparing the elements needed for each receiver, the proposed solution may need 7 additional adders and multipliers, but a reduction of FIR filters is achieved. Furthermore, the FIR filters employed do not use multipliers and the order of the filters employed in the Balanced Quadricorrelator could be superior to that of the proposed system, taking into account the difference between w0 and wi.
Conclusions
The solution presented in this paper proposes a new detection scheme for demodulating BFSK signals. Highorder filters are avoided because of one important matter: the symbol detection is accomplished through the constant slope recognition carried out at the output of a Sampler Correlator. This element represents the bridge between digital demodulation and curve segmentation techniques. From this point of view, new digital demodulators for BFSK waveforms can be developed, which advantageously save receiver complexity, in comparison to others reported. The system is only implemented by FIR and IIR filters, devices suitable to be implemented with low complexity.
Appendix A
This Section summarizes the obtaining of the analytical expressions foryp[n] andyq[n] in Figure 2. Considering the multiplication of the received signal by the local tone and after applying some trigonometric identities, the following expression is obtained:
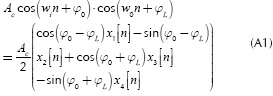
Where:
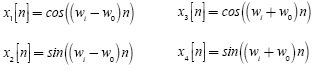
The operation of the accumulator block from the sampler correlator is to perform the following sum:
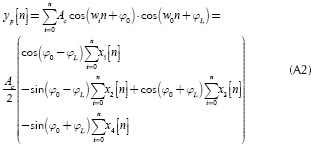
After considering the Eulers theorem and the sum formula of the geometric progression (Gradshteyn 1980), it is possible to obtain closed form expressions for each term  in Equation (A2). After some straightforward manipulations, the description for yp [n] yields:
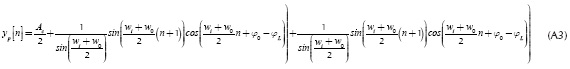
The description given in Equation (A3) considers the case when the frequency received is different to that of the local tone, that is w1 ≠ w0. The case in which w1 = w0 can be obtained by taking the limit  to yield the relation:
Where:
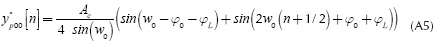
For the quadrature branch similar expressions are obtained upon substituting φL by .
Appendix B
In this section the sum formula for relation Equation (13) is obtained as follows:
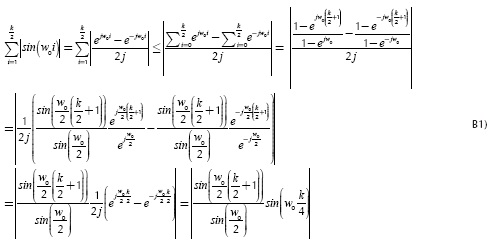
In this development, the Eulers identity and the formula of the geometric progression have been used (Gradshteyn 1980).
References
Ibrahim, G. H., Hafez, A., & Khalil, A. H. (2013). An ultra low power QPSK receiver based on super-regenerative oscillator with a novel digital phase detection technique. AEU -International Journal of Electronics and Communications, 67(11), 967-974. DOI: 10.1016/j.aeue.2013.05.008. [ Links ]
Ouahada, K. (2014). Nonbinary convolutional codes and modified M-FSK detectors for power-line communications channel. Journal of Communications and Networks, 16(3), 270-279. DOI: 10.1109/JCN.2014.000047. [ Links ]
Karabulut, M. A., Özdemir, O., & Ilhan, H. (2015). Link adaptive relaying with noncoherent BFSK and DPSK modulations in multiple access relay channels. In Wireless Telecommunications Symposium (WTS), 2015 (pp. 1-5). DOI: 10.1109/WTS.2015.71 17265 [ Links ]
Neifar, A., Trabelsi, H., Bouzid, C, & Masmoudi, M. (2012). Design of a zero crossing BFSK demodulator for a wireless sensor. In 2012 7th International Conference on Design Technology of Integrated Systems in Nanoscale Era (DTIS) (pp. 1-5). [ Links ]
Wang, L.-H., Chen, T.-Y., Lin, K.-H., & Lee, S.-Y. (2014). A low-power super-regenerative BFSK transceiver for intelligent healthcare monitoring system. In 2014 IEEE International Symposium on Bioelectronics and Bioinformatics (ISBB) (pp. 1-4). DOI: 10.1109/ISBB.2014.6820913. [ Links ]
Peng, K.-C., Lin, C.-C., & Chao, C.-H. (2013). A Novel Three-Point Modulation Technique for Fractional-N Frequency Synthesizer Applications. Radioengineering, 22(1), 269275. [ Links ]
VEŘTÁT, I., & MRÁZ, J. (2013). Hybrid M-FSK/DQPSK Modulations for CubeSat Picosatellites. Radioengineering, 22(1), 389-393. [ Links ]
Sklar, B. (2001). Digital Communications, Fundamentals and Applications (Second). New Jersey: Prentice Hall. [ Links ]
Gardner, F. (1985). Properties of Frequency Difference Detectors. IEEE Transactions on Communications, 33(2), 131 - 138. DOI: 10.1109/TCOM.1985.1096264. [ Links ]
Kang, H.-S., Kim, D., & Park, S.-C. (2011). Coarse frequency offset estimation using a delayed auto-quadricorrelator in OFDM-based WLANs. In 2011 3rd International Congress on Ultra Modern Telecommunications and Control Systems and Workshops (ICUMT) (pp. 1-4). Budapest, Hungary. [ Links ]
Kreuzgruber, P. (1994). A class of binary FSK direct conversion receivers. In Vehicular Technology Conference, 1994 IEEE 44th (pp. 457 -461 vol.1). DOI: 10.1109/vetec.1994.345086. [ Links ]
Egau, P. C. (1984). Correlation systems in radio astronomy and related fields. Communications, Radar and Signal Processing, IEE Proceedings F, 131(1), 32 -39. DOI: 10.1049/ip-f-1.1984.0007. [ Links ]
Ahn, T., Yoon, C.-G., & Moon, Y. (2005). An adaptive frequency calibration technique for fast locking wideband frequency synthesizers. In 48th Midwest Symposium on Circuits and Systems, 2005 (pp. 1899 -1902 Vol. 2). Cincinnati, Ohio, USA. [ Links ]
Lee, Y. W., Cheatham, T.P., J., & Wiesner, J. B. (1950). Application of Correlation Analysis to the Detection of Periodic Signals in Noise. Proceedings of the IRE, 38(10), 1165 - 1171. DOI: 10.1109/JRPROC.1950.233423. [ Links ]
Iñesta, J. M., Buendi, M., & Sarti, M. À. (1998). Reliable polygonal approximations of imaged real objects through dominant point detection. Pattern Recognition, 31(6), 685 - 697. DOI: 10.1016/S0031-3203(97)00081-2. [ Links ]
Wang, C., Sun, G., Wang, Y., & Xu, L. (2010). An Improved Corner Detection Algorithm Based on Gaussian Smoothing. In 2010 International Conference on Intelligent Computation Technology and Automation (ICICTA) (Vol. 1, pp. 536-539). DOI: 10.1109/ICICTA.2010.449. [ Links ]
Han, J. H., & Poston, T. (1993). Distance accumulation and planar curvature. In, Fourth International Conference on Computer Vision, 1993. Proceedings (pp. 487-491). DOI: 10.1109/ICCV.1993.378175. [ Links ]
Anderson, I. M., & Bezdek, J. C. (1984). Curvature and Tangential Deflection of Discrete Arcs: A Theory Based on the Commutator of Scatter Matrix Pairs and Its Application to Vertex Detection in Planar Shape Data. IEEE Transactions on Pattern Analysis and Machine Intelligence, PAMI-6(1), 27-40. DOI: 10.1109/TPAMI.1984.4767472. [ Links ]
Oppenheim, A. V., & Schafer, R. W. (2010). Discrete-time signal processing (Third Edition). Upper Saddle River, NJ, USA: Prentice Hall. [ Links ]
Gradshteyn, I. S., & Ryzhik, I. M. (1980). Table of Integrals, Series, and Products (fourth edition). Academic Press. [ Links ]
Kay, S. M. (1998). Fundamentals of Statistical Signal Processing: Estimation Theory (Vols. 1-3). Englewood Cliffs: Prentice- Hall. [ Links ]
Proakis, J. G., & Manolakis, D. G. (2006). Digital Signal Processing (Auflage: 4). Upper Saddle River, N.J: Prentice Hall. [ Links ]
