


Services on Demand
Journal
Article
 English (pdf)
 Article in xml format
 Article references
 Send this article by e-mail
Indicators
-
 Cited by SciELO
 -
 Access statistics
Related links
-
 Cited by Google
 -
 Similars in
SciELO
Similars in
SciELO -
 Similars in Google
Share

 Permalink
Ingeniería e Investigación
Print version ISSN 0120-5609
Ing. Investig. vol.35 supl.1 Bogotá Dec. 2015
https://doi.org/10.15446/ing.investig.v35n1Sup.53286
DOI: http://dx.doi.org/10.15446/ing.investig.v35n1Sup.53286
Harmonic distortion in public low-voltage grids Comparison of the situation in Colombia and Germany
Distorsión armónica en redes públicas de baja tensión Comparación de la situación en Colombia y Alemania
A.M. Blanco1, J. Meyer2, A. Pavas3, C.A. Garzon4, M. Romero5, and P. Schegner6
1 Ana María Blanco: Electrical engineer and M.Eng. at Universidad Nacional de Colombia. Affiliation: PhD Student at Technische Universitàt Dresden, Germany.
E-mail: ana.blanco@tu-dresden.de
2 Jan Meyer: Electrical engineer and PhD at Technische Universitàt Dresden, Germany. Affiliation: Senior Academic Assistant at Technische Universitàt Dresden, Germany.
E-mail: jan.meyer@tu-dresden.de
3 Fabio Andrés Pavas: Electrical engineer, MSc. and PhD at Universidad Nacional de Colombia. Researcher in the Research group PAAS-UN. Affiliation: Assistant professor at Universidad Nacional de Colombia.
E-mail: fapavasm@unal.edu.co
4 Camilo Andrés Garzón: Electrical engineer at Universidad Nacional de Colombia. Affiliation: Master student at Universidad Nacional de Colombia. Researcher with the Research group PAAS-UN.
E-mail: cagarzon@unal.edu.co
5 Miguel Fernando Romero: Electrical engineer and MSc. at Universidad Nacional de Colombia. Affiliation: PhD student at Universidad Nacional de Colombia. Researcher with the Research group PAAS-UN.
E-mail: mfromerol@unal.edu.co
6 Peter Schegner: Electrical engineer at Darmstadt University of Technology, Germany. PHD at Saarland University, Germany. Affiliation: Full professor and head of Institute of Electrical Power Systems and High Voltage, Technische Universitàt Dresden, Germany.
E-mail: peter.schegner@tu-dresden.de
How to cite: Blanco, A.M., Meyer, J., Pavas, A., Garzon, C.A., Romero, M., & Schegner, P. (2015). Harmonic distortion in public low-voltage grids Comparison of the situation in Colombia and Germany. Ingeniería e Investigación, 35(Supl) 50-57. DOI: http://dx.doi.org/10.15446/ing.investig.v35n1Sup.53286
ABSTRACT
Current and voltage harmonic levels in LV grids depend not only on the harmonic emission of non-linear loads, but also on the characteristics of the grid and the voltage distortion of the upstream grid. Based on several measurements, it was found that Colombia and Germany have considerable differences in the current harmonic emission of electronic devices and voltage distortion in the LV-grids. These differences are the result of different regulation methodologies and the characteristics of the grid. Detail measurement campaigns are needed in both countries in order to verify the voltage and current harmonic levels, and to analyze the network efficiency and hosting capacity in terms of harmonics.
Keywords: Harmonic emission, harmonic distortion, cancellation effect, power quality.
RESUMEN
Los niveles de distorsión armónica en las redes de baja tensión no dependen únicamente de las cargas no lineales conectadas al sistema, sino también de las características de la red y la distorsión de tensión proveniente de la red de media tensión. Considerables diferencias en la emisión de armónicos de equipos electrónicos y los niveles de distorsión de tensión en las redes de baja tensión en Colombia y Alemania fueron identificados a partir de varias mediciones. Estas diferencias se deben principalmente a la normatividad y las características de las redes en cada país. Se recomienda realizar campañas de medición en ambos países para verificar los niveles de distorsión y analizar la eficiencia y la capacidad de la red en términos de armónicos.
Palabras clave: Emisión de armónicos, distorsión armónica, efecto de cancelación, calidad de potencia.
Received: September 15th 2015 Accepted: October 2nd 2015
Introduction
The interest in harmonic distortion in public LV-grids has increased during the last decade due to the increasing number of non-linear devices in the networks such as computers, battery chargers, energy-efficient lamps, photovoltaic systems, etc. (Bollen et al., 2014; Pavas, Blanco & Parra, 2011). The harmonic distortion levels depend not only on the harmonic emission of non-linear loads, but also on the characteristics of the network and the harmonic distortion of the MV-grid. Moreover, the regulation may also influence the final harmonic levels imposing, for example, specific characteristics to the non-linear loads.
The historic development in Colombia and Germany is considerably different in terms of equipment emission, network characteristics and regulations. A comparison of the harmonic situation in both countries shall provide information about existing differences, which can be an important contribution to the discussion of network efficiency and hosting capacity in terms of harmonics. Based on the characterization and measurement of different LV-networks as well as typical electronic equipment used in Germany and Colombia, differences in the harmonic distortion are evaluated. The paper is divided in three main parts. The first part compares the characteristics of LV-networks and the regulation in both countries. The second part compares the current harmonic emission of typical electronic devices used by residential users and assesses the potential for harmonic cancellation between them. Finally, the voltage harmonic levels measured in selected LV-networks are compared and discussed.
The low voltage networks in Colombia and Germany are different in terms of their nominal voltage (208/120V 60 Hz vs. 400/230V 50 Hz) and topology. Colombian LV-networks are radial and usually have overhead lines and multiple small transformers (between 30 and 150 kVA) installed on the poles, generally supplying only a few customers. Underground cables and transformers with higher rated powers are only used in large apartment buildings. In rural areas, most customers are connected to a single phase.
In contrast, LV-networks in Germany are composed mainly by underground cables and transformers with rated powers between 160 and 630 KVA (the most common ones are 400 and 630 kVA), which are able to supply more users in one LV grid than in Colombia. The most relevant characteristics of the networks are summarized in Table 1.
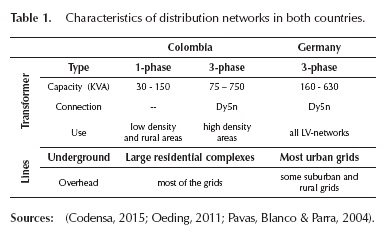
The voltage level in Colombian LV- networks (120 V) results in higher current levels compared to the 230V networks. Moreover, the impedance of overhead lines is higher than the impedance of underground cables and this produces more electric losses and higher voltage drops in the networks. Therefore, the distribution lines are shorter in Colombia than in Germany, in order to reduce the electric losses and voltage drop along the networks.
Regulations
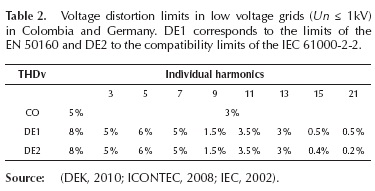
The regulation in Germany is based on the IEC standards, while Colombia based its regulation on the IEEE and IEC standards. There are several documents establishing the voltage and current distortion limits for each country. In case of voltage harmonics, in Germany every customer supply point has to meet the limits given in EN 50160 (DEK, 2010), which are almost similar to the compatibility levels defined in standard IEC 61000-2-2 (IEC, 2002). In Colombia the standard NTC 5001 (ICONTEC, 2008) is applied, which is similar to IEEE 519 (IEEE, 1992) in terms of harmonics. Table 2 compares the voltage harmonic limits for LV networks in both countries. While the limit for THDv is smaller in Colombia than in Germany, the limits of individual voltage harmonics in Colombia are fixed and stricter for harmonics below 9th order. For harmonics of 9th order and above, the limits in Colombia are not as strict as in Germany.
Harmonic current emission limits depend on the size of the equipment or installations. For equipment with rated input current below 16 A and 75 A respectively, the standards IEC 61000-3-2 and IEC 61000-3-12 are applied in Germany (IEC, 2009; IEC 2011). These standards prevent the use of high power devices with high harmonic current emissions. Colombia does not have any standard that limits the emission of small equipment, which could result in possible differences between both countries.
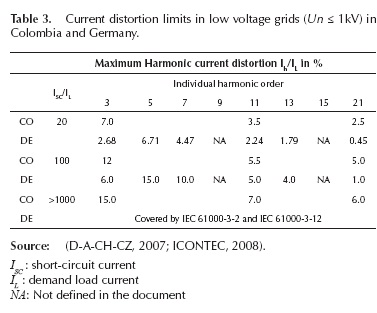
Both countries have also introduced limits for current harmonics emitted by larger users (see (ICONTEC, 2008) and (D-A-CH-CZ, 2007). Those limits depend on the short circuit ratio at the connection point of the customer. Table 3 compares the limits for some ISC/IL ratios and selected harmonic orders. The idea is to have relaxed limits for small users which cannot seriously affect the grid, like residential users, but more strict limits for high demanding users. In Colombia the fulfillment of these limits is compulsory, while in Germany the limits are only recommendations.
Electronic equipment
Household electronic loads commonly use single-phase switch mode power supplies (SMPS) for their operation. The simplest SMPS presents a two stage topology, consisting of a rectifier (diode-bridge rectifier with smoothing capacitor) and an inverter stage. This topology, also known as SMPS without PFC (N-PFC), has a low power factor and high current distortion (PF< 0.7, THDi > 90 %) as depicted by Blanco et al. (2015).
In order to comply with given limits (e.g. IEC 61000-3-2, 2009) or to increase the energy-efficiency of a device, a power factor correction (PFC) is implemented. PFC methods can be classified as passive and active according to their working principle.
Passive PFC (P-PFC) methods imply adding components such as capacitors or inductors, either to the input or the output of rectifying stage or using a valley-fill circuit in order to improve the shape of the current waveform. Active PFC (A-PFC) topologies use various DC-DC converters (boost, flyback, SEPIC) that shape the input current waveform by HF-switching. SMPS with P-PFC have mostly a moderate current distortion between 30 % and 90 % and a power factor higher than 0.7, while SMPS with A-PFC have the lowest current distortion (THDi < 30 %) and power factors close to one (find a complete discussion of topologies in (Blanco et al, 2015).
In order to identify and characterize the main residential electronic loads in Colombia and Germany, measurements of different devices were performed. The set of devices includes 3 Compact fluorescent lamps (CFLs) of different nominal power, 3 different power supplies for desktop computers, 2 laptop chargers and 2 monitors.
PC power supplies, laptop chargers and monitors can operate with 230V / 50 Hz or 120V / 60 Hz, while CFLs are individual for each country. In this study, only low order harmonics are of interest; nevertheless, the analysis of Supraharmonics (emissions between 2 and 150 kHz) should be also considered in future studies (Agudelo & Pavas, 2015; Meyer, et al. 2014).
The measurement set-up consists of a programmable linear voltage amplifier providing a sinusoidal supply voltage and a highly accurate power analyzer (ZES LMG500). In order to ensure a stable operating point, the laptop chargers and the PC power supplies were measured with especially designed constant resistive loads connected to the DC-side.
The PC power supplies were measured with a DC load of 80 W which corresponds to the power consumption of a typical user editing documents or browsing the internet. Laptop chargers were measured with a DC load of 60 W, which is close to its nominal power and also typical power consumption. Finally, monitors were measured with standard test pattern with color bars.
Table 4 shows the main characteristics of the selected loads and the measured total harmonic distortion (THDi), power factor (PF) and fundamental current (Ifun). Using the values of THD, PF and looking at the waveforms, the devices were classified according to the topologies described before (N-PFC, P-PFC and A-PFC). In most of the cases, the device topology does not change between the different voltage levels. Only the PC power supply of 360 Wmax behave as a N-PFC at 120V / 60 Hz and as P-PFC at 230V / 50 Hz. Moreover, the THDi of most devices is lower at 120V than at 230V. This is caused by the slow discharge of the capacitance present in the rectifier at 120V, which produces a less distorted current waveform.
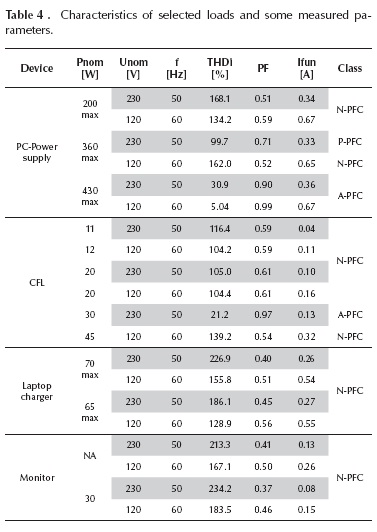
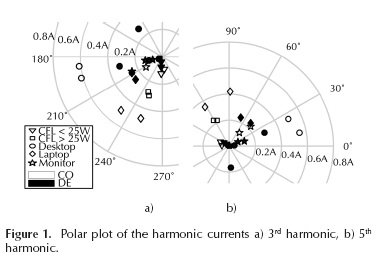
Figure 1 exemplarily shows the 3rd and 5th current harmonics in the polar plot for all devices. As expected, the devices have higher harmonic magnitudes (in A) at 120V than at 230V. The 3rd harmonic is higher than the 5th harmonic, and as it will be shown later, the magnitude of the harmonic decreases with the harmonic order. Most of the 3rd harmonic phase angles are in the 3rd quadrant, while the 5th harmonic phase angles are in the 1st and 2nd quadrant.
The next sections discuss the harmonic emission of the different types of devices. In order to make the harmonic emission comparable, the harmonic magnitudes were expressed in percentage of the fundamental current.
Compact florescent lamps
The European standard IEC 61000-3-2 establishes different harmonic limits for CFLs with active power lower and higher than 25W. Therefore, in Germany CFLs < 25 W have usually a N-PFC topology, while CFLs > 25 W have a A-PFC topology. Consequently, the results of the measured CFLs were divided in two groups. Figure 2 compares the harmonic magnitudes of the CFLs < 25 W and Figure 3 compares the results of CFLs > 25 W.
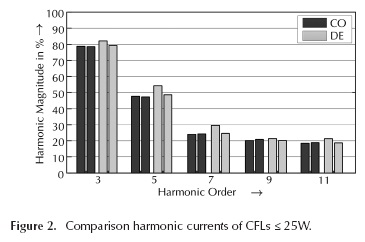
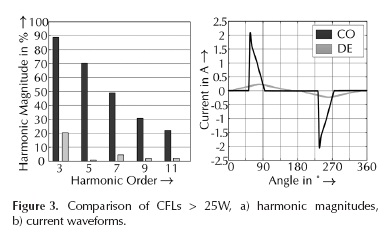
According to the graphs, the CFLs with P < 25 W have similar harmonic content in Colombia and Germany. The 3rd and 5th harmonics correspond to 80 % and 50 % of the fundamental current, respectively, and the 7th, 9th and 11th harmonics correspond each to about 20 % of the fundamental current. On the other hand, CFLs with P > 25 W present a different behavior in each country. In Germany these CFLs draw an almost sinusoidal current (see Figure 3b), while CFLs with P > 25 W in Colombia have an N-PFC topology and a corresponding higher harmonic emission.
The lack of specific limits for harmonic current emission for electronic loads in Colombia increases the risk of having loads with higher distortion in the market, such as CFLs with P > 25 W. In Colombia it is obligatory to use high efficiency lighting, especially in official government buildings where it is obligatory to use CFLs (MINMINAS, 2007). This is leading to the intensive use of CFLs with P > 25 W to light up corridors, auditoriums, and other wide area rooms, which may result in high voltage and current distortions within the system.
Computer power supplies
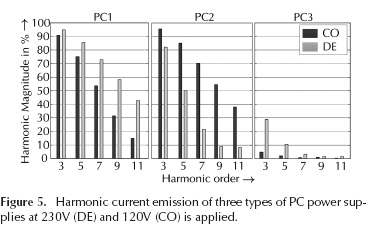
Three different PC power supplies were selected for the measurements. The first one corresponds to an old power supply of 200Wmax, typically employed in computers before the implementation of the IEC 61000-3-2. These power supplies have a N-PFC topology and therefore high distortion (see Figure 4, PC 1). The second type of power supply (PC 2 in Figure 4) is the typical supply used in most computers. According to the measurements, this kind of power supply has different behavior depending on the input voltage. The difference is caused by a change in the circuit when the power supply is switched from 120V to 230V. An inductor, which implements the passive PFC of the power supply, is short-circuited for 120V / 60 Hz. Therefore, the power supply behaves as a P-PFC topology in Germany, but as a N-PFC topology in Colombia. Finally, a third power supply with A-PFC was measured (see PC 3 in Figure 4). This power supply is usually implemented in computers with high power consumption. This topology has low harmonic current distortion.
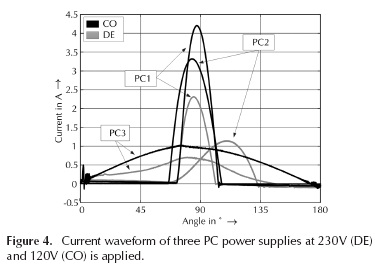
Figure 5 compares the harmonic content of each type of PC power supply obtained when the two corresponding voltage inputs were applied. As expected, the oldest technology (PC 1) has the highest harmonic distortion while the newest technology (PC 3) presents the best performance. According to the results, PC 1 and PC 3 behave better at 120 V. However, the behavior of PC 2 is much better at 230V than at 120V. According to Table 4, the THDi of PC 2 changes from 99.7 % at 230 V to 162 % at 120V.
Laptop chargers
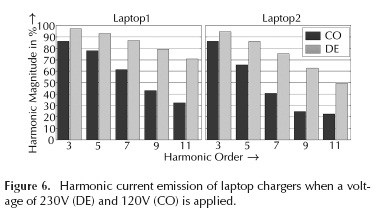
Two laptop chargers with similar nominal power were selected. The first charger was bought in Germany and the second in Colombia. As seen in Figure 6, the behavior of both laptop chargers is similar. Both chargers have a N-PFC topology with a high harmonic emission (THDi >120 %), but the chargers have higher harmonic content operated at 230V.
Monitors
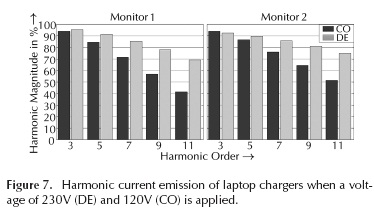
Figure 7 shows the harmonic emission of two monitors at 120V (CO) and 230V (DE). Monitor 1 and 2 correspond to a LCD and LED monitor respectively. In both cases, the harmonic distortion is lower in the Colombian scenario, and monitor 1 has lower distortion than monitor 2. Both monitors have a N-PFC technology, and the results are very similar to the results obtained for laptops.
Diversity factors
Harmonic currents in the network depend not only on the magnitude of harmonic currents emitted by the individual devices and the number of devices, but also on the diversity of the harmonic phase angles between different topologies and their mix in the sum of devices connected, e.g. to one LV grid.
The total harmonic current emitted by several devices at one connection point is calculated as the phasor sum of the harmonic currents emitted by each device. Thus, the presence of different devices with different topologies at one connection point can cause a diversity of current harmonic phase angles and subsequently may lead to a lower magnitude of phasor sum than the arithmetical sum of the harmonic current magnitudes. This is known as cancellation effect and has a high influence on the total harmonic distortion emitted by larger groups of electronic devices into the grid (Meyer et al, 2011)
The cancellation effect is quantified by the phase angle diversity factor k(h)p, individual for each harmonic:
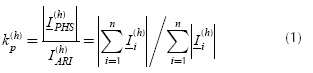
where I(h)i represents the harmonic current phasor of the device i, n is the number of devices and h is the order of the harmonic. The diversity factor varies between 0 (perfect cancellation) and 1 (no cancellation).
Figure 8 exemplarily shows the diversity factor for the first fifteen harmonic components obtained for two groups of 9 CFLs from the respective countries. The CFLs were measured at similar conditions as the devices presented in the previous section. According to the graphs, the diversity factors are lower in Colombia, which indicates that the CFLs have a better diversity of harmonic phase angles and, in consequence, a better level of cancellation.
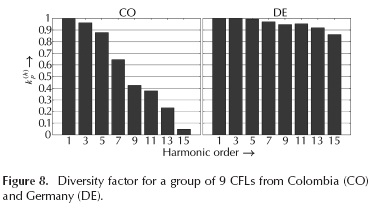
The reason for this difference is the absence of standards to limit the harmonic emission of individual devices in Colombia, which allows more diversity of electronic devices in the market. In Germany, the standard IEC 61000-3-2 defines detailed limits and phase angle behavior for CFLs, which reduces the diversity of their electronic circuits.
Residential users usually operate different types of electronic devices at the same time and the diversity factors are usually lower in LV-grids than the factors observed for CFLs.
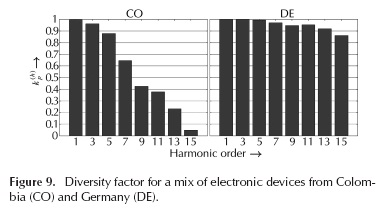
In order to have a better idea of the level of cancellation of harmonic currents in residential LV-grids in each country, the diversity factors are calculated for a group of 7 electronic devices. The mix is composed of 3 CFLs, 2 PCs, 1 monitor and 1 laptop that were discussed in detail in the previous section.
Figure 9 shows the diversity factors for the first 15th harmonics for each country. Most of the diversity factors were lower for the Colombian case, except for the 3rd and 5th harmonics. Higher differences are obtained for the 9th, 11th and 13th harmonics. These results are a first indication that the level of cancellation is significantly different in both countries. In the future, more representative values shall be calculated based on a larger group of devices. However, the results indicate that Germany may present higher harmonic currents (in %%) for some harmonic orders due to a lower cancellation effect.
Grid measurements
Voltage distortion in LV-networks is majorly determined by the current harmonic emission behavior of the connected users, which depends on the number and type of users (residential and commercial users, distributed generators, especial loads, etc.). Furthermore, the harmonic impedance of the grid and the voltage distortion of the upstream grid have a considerable impact on the harmonic voltages of a LV grid. In three-phase systems, as in Germany, the zero-sequence harmonics (triple harmonics) are mainly determined by the zero-sequent impedance of transformer and LV lines, while positive and negative sequence harmonics mainly depend on the background distortion of the up-stream network. For a comprehensive analysis of the typical voltage distortion in LV-networks, it is necessary to have measurements at different locations in a grid and information about the configuration of the grid.
In order to compare the voltage distortion in both countries, measurements in selected public LV networks in both countries were carried out by the Universidad Nacional de Colombia and the Technische Universitàt Dresden. These measurements are meant to identify if more detailed and systematic measurement campaigns are necessary in both countries. Universidad Nacional de Colombia performed a measurement campaign from 2001 to 2003 (Gallego et al, 2005); one of the motivations for this study is updating the previously obtained results.
Table 5 shows some characteristics of the measured sites. Most of the measurements were made at the POC (Point of connection) of residential users located in five different LV-networks of high density urban areas. The duration of the measurements is one week. Both universities used Class-A measurement devices according to IEC 61000-4-30, which are accurate enough to measure the first fifteen odd harmonics.
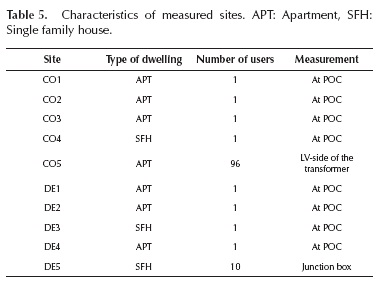
Figure 10 compares the 95th percentiles of the voltage harmonics obtained for each country. Each rectangle represents the 95th percentile of the respective harmonic in percentage of the fundamental of each phase and each site. The harmonics are expressed in percentage in order to facilitate the comparison of results between countries and to test the compliance according to the corresponding standards.
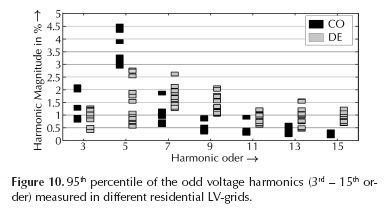
According to the results, the 3rd and 5th harmonics tends to be slightly lower in Germany, but from the 7th order on the harmonics tend to have lower magnitudes in Colombia. The levels of the 5th harmonic in Colombia and the 9th and 15th harmonics (both zero-sequent orders) in Germany seem to require particular attention. The 5th harmonic of some sites in Colombia is above the limit. With respect to the 9th and 15th harmonics in Germany, which in some sites already exceed the limits, the high levels might be caused by the lower cancellation of harmonic currents emitted by electronic devices, which agrees with the results obtained in the previous section.
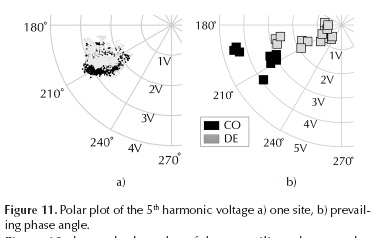
Voltage harmonic phase angles are also analyzed because they indicate if the mix of electronic devices is similar in both countries. When voltage harmonic magnitudes and phase angles are plotted in a polar chart, a cloud like the one shown in Figure 11a is usually obtained. If the cloud is not too dispersed, a prevailing phase angle may be used as a measure of the central trend of the data. The prevailing phase angle is the resulting angle of the phasor sum of all measured data for a specific harmonic order. The dispersion of the data is evaluated with the prevailing ratio PR, which is calculated as in Equation (1):
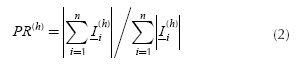
If the measurements have similar phase angles, then the PR will be close to one. In this case, a value of 0.8 of the prevailing ratio is chosen as the limit to identify measurements where a prevailing phase angle may be calculated.
For instance, Figure 11b shows the 5th harmonic prevailing phase angle of each phase and each site only for the measurements with prevailing ratio higher than 0.8. All the 5th harmonic prevailing angles are in the 3th quadrant, which indicates that the resulting mix of electronic devices in Colombia and Germany is similar.
Figure 12 shows the boxplot of the prevailing phase angles obtained for each harmonic at all measured sites in each country. Once again, only the prevailing phase angles, whose prevailing ratio is higher than 0.8, were considered. 10 % of the measurements had to be excluded from the analysis as their prevailing ratio was below 0.8.
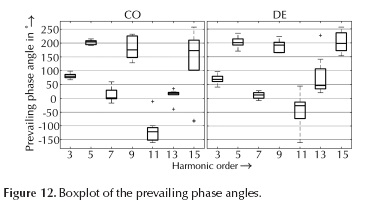
The graph shows that the prevailing phase angles of the 3rd, 5th, 7th, 9th and 15th harmonic in Colombia and Germany have similar values. The 3rd and the 5th harmonics seems to be very similar in all grids, while for the other harmonics the prevailing phase angle may have considerable differences between different grids. The results of the 3rd and 5th harmonics show that the mix of electronic devices of residential users in both countries is comparable.
Conclusions
Measurements of typical electronic devices used by residential users in Colombia and Germany have shown considerable differences in terms of current harmonic emission, especially in the harmonic phase angles. This difference might result in lower harmonic distortion of larger groups of electronic devices in Colombian grids. The strict regulation in Europe has resulted in lower diversity of harmonic phase angles for particular equipment (e.g. CFL), which may result in high harmonic currents in the networks. Apparently, the lack of regulation in Colombia has yielded a desirable outcome: the wider diversity in harmonic phase angles has resulted in lower harmonic contents in comparison to the effects observed in Germany. This conclusion does not suggest that the regulatory policies regarding different electronic devices should not be created, those policies must be prepared to avoid several unforeseeable effects on devices and the grid.
Initial measurements of voltage distortion in residential LV-grids showed that the harmonic levels in Germany and Colombia differ. In some cases the voltage harmonics already exceed their respective limits. Further measurements are recommended in order to provide reliable conclusions about the voltage and current harmonic levels in both countries. These measurements should also take into account variations of the network characteristic.
References
Agudelo, D. & Pavas, A. (2015, June). Current Supraharmonics Identification in Commonly Used Low Voltage Devices. Paper presented at the Proceedings of the Power Electronics and Power Quality Applications PEPQA, Bogotá, Colombia, 2-4 June. DOI: 10.1109/PEPQA.2015.7168230. [ Links ]
Blanco, A., Yanchenko, S., Meyer, J. & Schegner, P. (2015). The impact of supply voltage distortion on the harmonic current emission of non-linear loads. Journal of the Facultad de Minas Dyna, 192(82), 150-159. http://dyna.unalmed.edu.co/en/verResumenEN.php?id_articulo=v82n192a17. [ Links ]
Bollen, M., Meyer, J., Amaris, H., Blanco, A.M., et al. (2014) Future work on harmonics - some expert opinions Part I -wind and solar power. Paper presented at the Proceedings of the16th International Conference on Harmonics and Quality of Power (ICHQP), Bucharest, 25-28 May, IEEE. DOI: 10.1109/ICHQP.2014.6842870. [ Links ]
Codensa (2015). Normas técnicas para el diseño y construcción de proyectos eléctricos [Technical rules for the design and construction of electric projects]. Bogotá, Colombia. Retrieved from Codensa website: http://likinormas.micodensa.com/. [ Links ]
D-A-CH-CZ, (2007). Technical rules for the assessment of network disturbances, 2nd edition. [ Links ]
DKE- Deutsche Kommission Elektrotechik Elektronik Informationstechnik im DIN und VDE (2011). Merkmale der Spannung in õffentlichen Elektrizitátsversorgungsnetzen; Deutsche Fassung EN 50160:2010 + Cor.: 2010 [Voltage characteristics of electricity supplied by public electricity networks; German version EN 50160:2010 + Cor.:2010] [ Links ].
Gallego, L.E, Torres, H., Pavas, A., Rondon, D., Cajamarca, G.A. & Urrutia, D.F. (2005) A methodological proposal for monitoring, analyzing and estimating power quality indices: The case of Bogotá-Colombia. Paper presented at the Proceedings of the Power Tech,1-7 June, Russia, IEEE. DOI: 10.1109/PTC.2005.4524682. [ Links ]
ICONTEC - Instituto Colombiano de Normas Técnicas (2008) NTC 5001, Calidad de la potencia eléctrica. Límites y metodología de evaluación en Punto de conexión común [NTC 5001, Power quality. Limits and evaluation methodology on the point of common coupling] [ Links ].
IEC - International Electrotechnical Commission (2002). Standard IEC 61000-2-2 Compatibility levels for low frequency conducted disturbances and signalling in public low-voltage power supply systems. [ Links ]
IEC - International Electrotechnical Commission (2009). Standard IEC 61000-3-2: 2005 + A1:2008 +A2:2009 Electromagnetic compatibility (EMC) - Part 3-2: Limits for harmonic current emissions (equipment input current < 16 A per phase). [ Links ]
IEC - International Electrotechnical Commission (2011). Standard IEC 61000-3-12: 2011 Electromagnetic compatibility (EMC) - Part 3-12: Limits for harmonic currents produced by equipment connected to public low-voltage systems with input current > 16 A and < 75 A per phase. [ Links ]
IEEE - Institute of Electrical and Electronics Engineers (1992). STD 519 -1992: IEEE Recommended practices and requirements for harmonic control in electrical power systems. [ Links ]
Meyer, J., Schegner, P., & Heidenreich, K. (2011, June). Harmonic summation effects of modern lamp technologies and small electronic household equipment. Paper presented at the Proceedings of the 21st International Conference on Electricity Distribution. Frankfurt, Germany, 6-9 June. [ Links ]
Meyer, J., Bollen, M., Amaris, H., Blanco, A.M., et.al. (2014) Future work on harmonics - some expert opinions Part II - supraharmonics, standards and measurements. Paper presented at the Proceedings of the16th International Conference on Harmonics and Quality of Power (ICHQP), Bucharest, 25-28 May, IEEE. DOI: 10.1109/ICHQP.2014.6842871. [ Links ]
MINMINAS -Ministerio de Minas y Energía (2007). Decreto No. 2331 por el cual se establece una medida tendiente al uso racional y eficiente de energía [Act No. 2331 to stablish measures for the rational and efficient energy use]. Colombia. [ Links ]
Oeding, D. & Oswald, B.R. (2011). Elektrische Kraftwerke und Netze, 7. Auflage [Electric power stations and networks, 7 edition] . Springer, Berlin. [ Links ]
Pavas, A., Blanco, A. & Parra, E. (2011). Applying FBD-power theory to analysing effective lighting devices' impact on power quality and electric grid efficiency. Ingeniería e Investigación, 31(2), 110-117. [ Links ]
