


Serviços Personalizados
Journal
Artigo
 Inglês (pdf)
 Artigo em XML
 Referências do artigo
 Enviar este artigo por email
Indicadores
-
 Citado por SciELO
 -
 Acessos
Links relacionados
-
 Citado por Google
 -
 Similares em
SciELO
Similares em
SciELO -
 Similares em Google
Compartilhar

 Permalink
Ingeniería e Investigación
versão impressa ISSN 0120-5609
Ing. Investig. vol.35 supl.1 Bogotá dez. 2015
https://doi.org/10.15446/ing.investig.v35n1Sup.53895
DOI: http://dx.doi.org/10.15446/ing.investig.v35n1Sup.53895
Characterization of non-linear household loads for frequency domain modeling
Caracterización de cargas residenciales no lineales para modelado en el dominio de la frecuencia
M.F. Romero-L1, L.E. Gallego2, S. Müller3, and J. Meyer4
1 Miguel Fernando Romero: Electrical Engineer, Universidad Nacional de Colombia. MSc in Electrical Engineering, Universidad Nacional de Colombia, Colombia. Affiliation: PhD Candidate in Electrical Engineering, Universidad Nacional de Colombia.
E-mail: mfromerol@unal.edu.co
2 Luis Eduardo Gallego: Electrical Engineer, Universidad Nacional de Colombia. MSc and PhD in Electrical Engineering, Universidad Nacional de Colombia, Colombia. Affiliation: Associate professor, Universidad Nacional de Colombia, Colombia.
E-mail: lgallegov@unal.edu.co
3 Sascha Müller: Dipl.-Ing. in Electrical Engineering, Technische Universitaet Dresden. Affiliation: PhD student Institute of Electrical Power Systems and High Voltage Engineering, Technische Universitaet Dresden, Germany.
E-mail: sascha.mueller@tu-dresden.de
4 Jan Meyer: Dipl.-Ing. and PhD in Electrical Engineering, Technische Universitaet Dresden. Affiliation: Head of Power Quality Research Group, Institute of Electrical Power Systems and High Voltage Engineering, Technische Universi-taet Dresden, Germany.
E-mail: jan.meyer@tu-dresden.de
How to cite: Romero-L, M., Gallego L., Müller S., & Meyer, J. (2015). Characterization of non-linear household loads for frequency domain modeling. Ingeniería e Investigación, 35(Supl), 65-72. DOI: http://dx.doi.org/10.15446/ing.investig.v35n1Sup.53895
ABSTRACT
Component-based harmonic studies in public Low Voltage grids require realistic models of individual loads as well as their typical penetration ratios. As fundamental basis for the development of comprehensive models for residential users, this paper identifies the most commonly used household loads in Colombia. The loads are classified according to their Power Factor Correction (PFC) circuit topology in no-PFC, passive-PFC and active-PFC devices, and a comprehensive set of loads is selected. Their behavior in terms of harmonic emission is characterized by intensive lab measurements with systematically varied supply voltage distortion. Based on several indices, the suitability of different frequency-domain modeling approaches (e.g. constant current source, decoupled and coupled Norton models) is assessed.
Keywords: Harmonic distortion, frequency-domain analysis, load modeling.
RESUMEN
Los estudios de armónicos en redes de baja tensión requieren el desarrollo de modelos realistas de cargas individuales así como el conocimiento de sus niveles típicos de penetración. Como base para el desarrollo de modelos en frecuencia, este artículo identifica las cargas no lineales más comunes que se usan en redes residenciales de Colombia. Estas cargas se clasifican de acuerdo con la topología de su circuito de corrección de factor de potencia (PFC) en no-PFC, PFC-pasivos y PFC-activos, y se selecciona un grupo representativo de cargas para cada caso. El comportamiento de la distorsión armónica para cada grupo se caracteriza a través de mediciones en laboratorio variando sistemáticamente la distorsión en tensión. Finalmente, se calculan varios indicadores para evaluar la conveniencia de los diferentes modelos en frecuencia (fuente de corriente constante, Norton acoplado y desacoplado) para cada grupo de cargas.
Palabras clave: Distorsión armónica, análisis en el dominio de la frecuencia, modelado de cargas no lineales.
Received: September 8th 2015 Accepted: October 8th 2015
Introduction
The use of power electronic-based loads such as laptops, TVs, compact fluorescent lamps (CFL's) or electrical vehicle chargers increases continuously in residential networks. These electronic loads are nonlinear and can inject harmonics into the network. The impact of individual loads to the total distortion is usually neglectible, but the aggregated impact of hundreds of loads could considerably affect the harmonic voltages in the network.
The impact of nonlinear household loads on current harmonic distortion has been studied for a long time. Generally, harmonic studies can be based on component based or on measurement-based models. Component-based models require the representation of individual devices either in time-domain or frequency-domain. Time domain models can have a high accuracy level; however, the development of these models requires knowledge of internal elements (filters, resistors, capacitors, etc.) and the circuit diagram (Collin et al., 2010; Medina et al., 2013). Time domain models quickly become difficult and time-consuming in case of more complex devices (i.e. with active power factor correction). Additionally, knowledge about the implemented control algorithms is also necessary sometimes.
The development of frequency domain models of electronic devices does not usually require knowledge about internal elements, but needs very detailed measurements of the relation between current harmonic distortion and voltage harmonic distortion. As long as nonlinearities are not too significant, frequency-domain models are simpler and easier to obtain (Salles et al., 2012).
Frequency models with different level of detail have been developed in the last years. Constant current source models have limitations, because the current distortion generated by an electronic load usually depends on the supply voltage distortion. E.g. in (Blanco et al., 2015) the impact of supply voltage distortion on the harmonic emission of electronic household equipment is analyzed. In (Yanchenko et al., 2015) the impact of time-domain parameters of voltage waveform on both individual devices and aggregated household loads is assessed, in order to compare their harmonic current emission for distorted and sinusoidal supply voltages.
In order to overcome the limitations of constant current source models, (Mau et al., 2007) proposed a current injection model characterized by means and variances associated with harmonic spectra produced by aggregated loads. In (Ghorbani et al., 2011) classic Norton model parameters were calculated based on measurement of voltage and current spectra for two different operating conditions of the supply system. The validity and accuracy of those models was performed in terms of load rms current and its THD. In (Fõlting et al., 2014) a practical implementation of coupled Norton models was performed. The nonlinearity of current distortions in time domain was modeled by a linear set of equations in frequency domain. The model parameters were evaluated and validated for different groups of nonlinear devices.
In (Cuk et al., 2013) and (Cobben et al., 2007) measurement procedures for modeling were presented and the way to make a harmonic fingerprint for individual devices or total installations was proposed. Results show that fingerprints for some electronic loads have a non-linear behavior and, subsequently, conventional Norton models could have significant errors compared to the real behavior of the respective electronic load. Furthermore, according to (Müller et al., 2014) some loads show cross-dependencies between different harmonic orders. This relationship can be included in the model by using coupled Norton models.
In order to decide if a sufficient accurate frequency domain model is possible and which type of model shall be used, a detailed characterization of the household loads is necessary. In case an adequate modeling in frequency-domain is possible, the measurement data provides a comprehensive basis for parameterization of the model.
The first part of the paper identifies the commonly used household loads in Colombia and their penetration ratios. The loads are classified according to the circuit topology of the Power Factor Correction (PFC) into no-PFC, passive-PFC and active-PFC. Few representative loads of every topology are selected and measured in the laboratory for systematically varied supply voltage distortions. Based on several indices quantifying sensitivity, nonlinearity and asymmetry of the relation between applied voltage harmonics and emitted current harmonics (fingerprints), the suitability of frequency-domain models is assessed. Finally, for each load a recommendation for the suitability of frequency-domain models is provided.
Identification and classification of loads
Residential users commonly use loads such as lighting devices, TV's, computers, heating devices, washing machines, etc. Furthermore, new technologies like electrical vehicles will increase in number. According to (Collin et al., 2010; Djokic et al., 2014) household loads could be classified as follows:
- Electronic devices (Switch-mode power supply SMPS)
- Energy efficient lighting devices
- Resistive loads
- Directly connected motor loads
This paper focuses on the analysis of electronic loads and energy efficient lighting because their aggregated impact on harmonic distortion may be very significant. Models of other devices at power frequency can be obtained e.g. from (Collin et al. 2010).
Table 1 presents the typical electronic loads in Colombian households. Every load has a different penetration level and the simultaneous connection of these devices can result in many different scenarios of harmonic distortion.
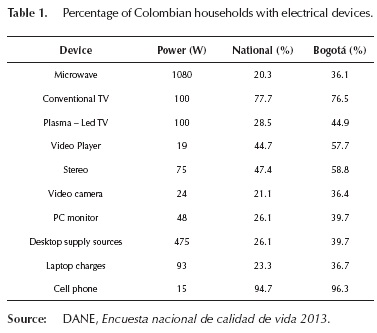
Electronic devices have different internal topologies according to the characteristics of the Power Factor Correction (PFC) circuit. Those topologies have a qualitative different harmonic emission as well as different response behavior on a varying supply voltage distortion. Table 2 presents a selection of single-phase loads representing some device categories in Table 1 and considering the different circuit topologies above mentioned.
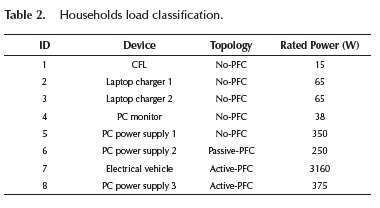
Devices without PFC (no-PFC) usually have a simple SMPS consisting only of a rectifier bridge and DC-link capacitor, i.e. Laptop chargers with rated power below 75W and CFL's smaller than 25 W. Devices with passive-PFC have additional capacitors or inductors to improve the current waveform. Finally, modern energy-efficient devices like some computer power supplies and electrical vehicle chargers utilize an active-PFC with different DC-DC converters in order to obtain an almost sinusoidal current waveform with a THDi usually below 10%.
The harmonic distortion could be affected by the voltage distortion in real grids. In order to characterize the impact of the voltage distortion on the current harmonics, extensive laboratory measurements were performed, which are described in detail in the next section.
Measurement framework
The used test stand consists of a control computer, a power amplifier and an adjustable network impedance to which the equipment under test (EUT) is connected (cf. Figure 1).
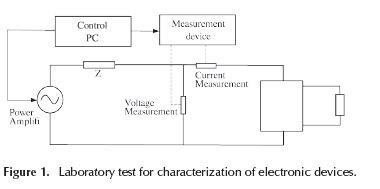
It is possible to generate supply voltages with freely programmable individual harmonic distortion levels, which can be varied both in magnitude and phase angle. As limits for the maximum magnitude of the individual harmonics, the limits given in the standard IEEE 519 (IEEE, 1992) are used. The power amplifier can supply three-phase loads up to 45kVA. Impedance Z can be adjusted to analyze the impact of the main impedances on the current distortion. A power quality analyzer (measurement device) records voltage and current signals from the EUT. In case of computer power supplies a constant DC load was connected in order to provide constant, reproducible operating conditions.
The measurement for each load consists of three steps:
- Generation of a fundamental voltage 120V/60Hz
- Addition of a voltage harmonic that is varied in magnitude and phase angle
- Recording of voltage and current harmonic spectra
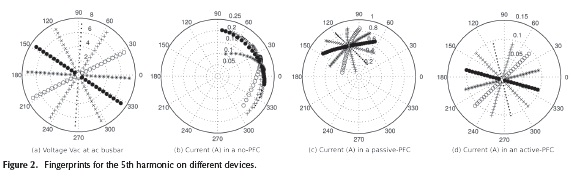
Variations of voltage harmonic magnitude and phase angle are graphically represented by fingerprints (Cobben et al., 2007). Figure 2a depicts as example the variation of 5th voltage harmonic. All bullets are harmonic voltages which were added to the fundamental voltage with the given magnitude and phase. 12 different magnitudes times 12 different phase angles for each magnitude results in 144 individual measurement points per harmonic. The harmonic current response on this harmonic voltage is given for a no-PFC, a passive -PFC, and an active-PFC devices in Figures 2b, 2c, and 2d. A qualitative different behavior of current harmonics can be identified from Figure 2. The current harmonic behavior of the no-PFC device in Figure 2b is strongly asymmetrical and non-linear with respect to voltage harmonic. The current harmonic behavior of the passive-PFC device in Figure 2c is almost linear and more symmetrical than the no-PFC device. Finally, the current harmonic of the active-PFC device in Figure 2d shows a highly linear and symmetrical behavior. Consequently, the no-PFC device is considerably less suitable for frequency-domain modelling than the active-PFC device.
Emission at reference conditions
(a) Voltage Vac at ac busbar (b) Current (A) in a no-PFC (c) Current (A) in a passive-PFC (d) Current (A) in an active-PFC.
In order to analyze the harmonic distortion of the selected loads under reference conditions, a sinusoidal voltage signal 120V/60Hz was applied and harmonic currents of every load were measured. Figure 3 shows the absolute magnitudes and Figure 4 the relative magnitudes of the odd current harmonics from order 3 to 11 of the measured devices. Each of the eight bars represents a device in Table 2 in their respective order. The colors indicate the different circuit topologies.
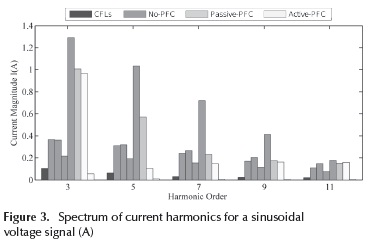
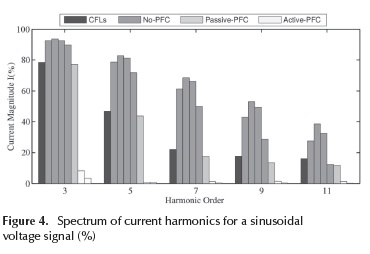
Figure 3 shows that harmonic distortion of the loads under sinusoidal voltage condition is different, which is caused by the combination of different rated power and circuit topologies. For all loads, the 3rd harmonic is the biggest and the 11th harmonic is the smallest. Furthermore, a non-direct relationship between power rated and harmonic distortion levels can be identified. E.g. harmonic distortion produced by the 3.16kW electrical vehicle (device 7) is lower than the distortion of the 350W and 250W PC power supplies (devices 5 and 6).
In order to identify patterns related to circuit topology, harmonic currents were related to the corresponding fundamental current of the load. Harmonic currents in (%) are shown in Figure 4.
Patterns for the individual circuit topology can be clearly identified. No-PFC loads have the highest harmonic distortion. Hence, the CFL is also a no-PFC load, and its emission is slightly smaller due to the different sizing of the DC-link capacitor compared to the other no-PFC loads. The 3rd harmonic is the biggest, and the higher the harmonic order, the smaller the harmonic magnitude becomes. Passive-PFC loads have smaller harmonic distortion than no-PFC loads. Finally, active-PFC loads have the smallest distortion of all devices in presence of sinusoidal supply voltage.
Fingerprint characterization
In order to characterize the fingerprints and to quantify the suitability for frequency-domain modelling, different indices, namely sensitivity, asymmetry and linearity index are calculated for each individual harmonic. These indices are slight modifications of the indices introduced in (Cobben et al., 2007; Müller et al., 2015).
Sensitivity indicates whether the variation of harmonic current is significant. Low values of sensitivity mean that a constant current approach could be enough to model the current harmonic with sufficient accuracy. In case of higher values, the different Norton approaches are usually necessary. Asymmetry and linearity indices evaluate the expected accuracy of the respective Norton approaches.
Sensitivity index
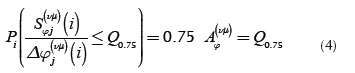
With the aim of identifying the influence of voltage distortion on current distortion for every load, several sensitivity indices were calculated. The sensitivity indices are defined as the ratios of harmonic current variation to fundamental harmonic current. The sensitivity index is calculated for both impact of voltage harmonic on the current harmonic of the same order (auto-sensitivity), and impact of voltage harmonic on the current harmonic of a different order (cross-sensitivity). Sensitivity indices are calculated as follows:

The symbols v and y indicate the orders of the voltage and current harmonic, respectively. n indicates the number of branches of the fingerprint.
Linearity index
The relationship between voltage and current harmonic can be very non-linear (cf. Figure 2b). This behavior can have a significant impact on the accuracy of the frequency domain models. The linearity index is defined as the ratio of the distance between the maximum value of each branch and the center of the fingerprint to the sum of the distances between the individual successive measurement points of the considered branch. As suggested in (Müller et al., 2015), the 25th percentile is used as linearity index L(vµ) and calculated as follows:
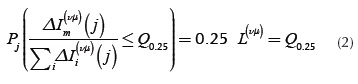
Where:
- Δim is the distance between the maximum value of a branch and the center of the fingerprint.
- Δli is the distance between successive points of each branch j.
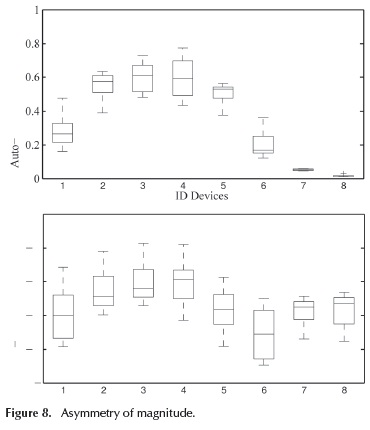
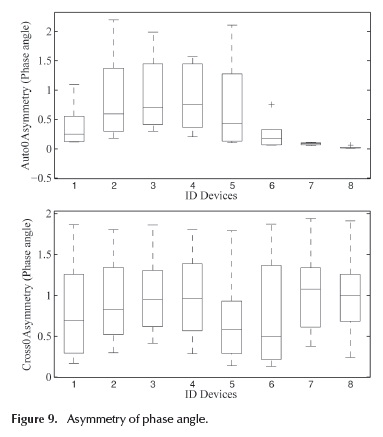
Asymmetry index
Asymmetry indices are calculated both for magnitude and phase angle. The magnitude asymmetry index indicates the difference between the branches in length. Phase angle asymmetry indicates the difference of the angle between neighboring branches. The asymmetry indices for magnitude and phase angles were calculated as follows:
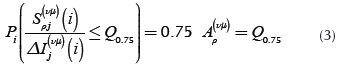
Phase angle asymmetry index
The 75th percentile is used as magnitude asymmetry index Ap(vµ) and as phase angle asymmetry index Aφ(vµ), respectively.
Identification of Norton model parameters
Various approaches have been introduced to consider the interaction between voltage and current harmonics. Among these approaches, the Norton model is one of the most common ones in frequency domain. Whereas the classic Norton model neglects a coupling between different harmonic frequencies, the coupled Norton model takes this effect into account (Fõlting et al., 2014). The Norton Model is represented by a current source and parallel admittance. (See Equation (5)).
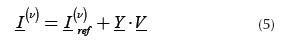
The vector elements  represent harmonic currents at sinusoidal voltage conditions. The diagonal elements of the admittance matrix
  represent the impact of voltage harmonic on the current harmonic of the same order and non-diagonal elements represent the frequency coupling of harmonic voltages and currents.
In order to estimate the admittance matrices and the suitable frequency models, limits for sensitivity, linearity and asymmetry indices are proposed, and the following methodology is applied:
- Matrix of sensitivity indices is calculated.
- Stage 1: If sensitivity values are smaller than the defined threshold, matrix element Y(vµ) is set to zero. Otherwise, stage 2 is initiated.
- Stage 2: If linearity values are higher than the threshold and magnitude and phase angle asymmetry values are smaller than the threshold, matrix element Y(vµ) is used. Otherwise the model is not accurate enough to represent the impact of V(v) to I(µ).
Depending on which matrix elements Y(vy) are set to zero, a possible frequency model can be identified. In addition, linearity and asymmetry of matrix elements Y(vy) different to zero are assessed to determine the model accuracy.
Results
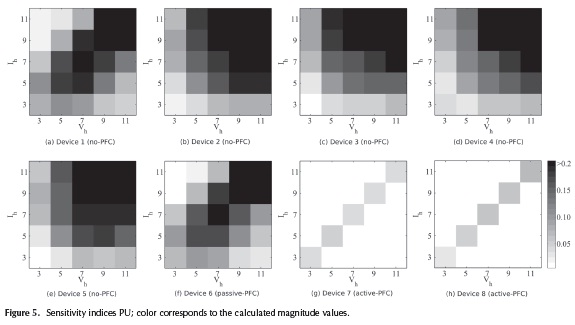
Sensitivity index
Sensitivity indices calculated for the eight devices are shown in Figure 5. Dark colors indicate higher sensitivity. From this figure it can be seen that passive-PFC and CFL loads have a strong cross impact to neighboring harmonics. The absolute auto-sensitivity value for the 3rd harmonic is small, but high in comparison with the other devices. The auto-sensitivity value for the 3rd harmonic of no-PFC loads is very small. The higher the harmonic order the bigger the auto-sensitivity values become. A strong cross impact among 7th, 9th and 11th harmonics is identified. For active-PFC loads the cross sensitivity can mostly be neglected.
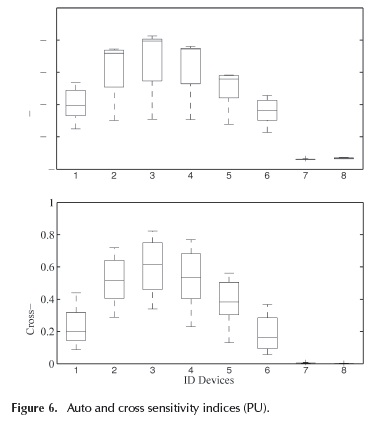
Figure 6 presents the variance of auto and cross sensitivity indices for all eight devices by Box-Whisker plots. In Figure 6 auto and cross sensitivity indices are not significantly different for no-PFC and passive-PFC loads. Auto-sensitivity values are always higher than cross sensitivity values. Finally, active-PFC loads have insignificant cross sensitivity levels.
Linearity index
Box plots for linearity indices are shown in Figure 7. Values close to 1 mean that the fingerprint is highly linear.
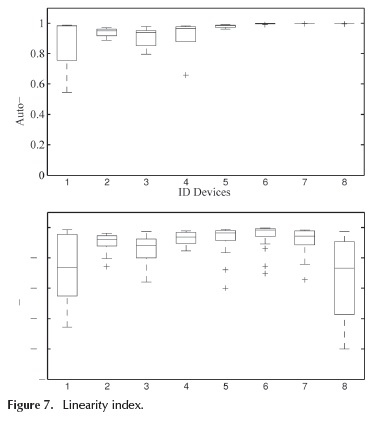
In Figure 7 the auto-linearity levels show that the relationship between current and voltage harmonic of same order is almost linear for all measured devices. The CFL load has the smallest auto-linearity index. Regarding cross-sensitivity, CFL and load 8 (active-PFC, PC power supply) have the lowest cross-linearity values.
Asymmetry index
Box plots for asymmetry indices are shown in Figures 8 and 9. Values of asymmetry close to 0 mean that the fingerprint is highly symmetrical. According to Figures 8 and 9, no-PFC loads have the most asymmetric fingerprints. CFL and passive-PFC loads are more symmetric than no-PFC loads and active-PFC loads have the most symmetric fingerprints.
Suitability of frequency-domain models
In order to estimate the suitability of frequency domain models for the different loads, the following thresholds for each index are proposed:
- Sensitivity threshold: 0.05 P.U.
- Linearity threshold: 0.8
- Magnitude asymmetry threshold: 0.5
- Phase angle asymmetry threshold: 1
Every individual current harmonic fingerprint represents one particular value in the admittance matrix. Applying the threshold for sensitivity index (stage 1), fingerprints with significant variations (high sensitivity) and fingerprints with insignificant variations (low sensitivity) are identified. The number of elements in the admittance matrix is reduced as all values with low sensitivity are neglected and set to zero. By assessing linearity and asymmetry indices (stage 2), the admittance elements that exceed the respective thresholds are excluded from the model.
In Figure 10 the black column indicates the number of matrix elements that should be included in the model due to their high sensitivity levels. The white column indicates the number of matrix elements with enough symmetry and linearity to be modeled with the Norton approach.
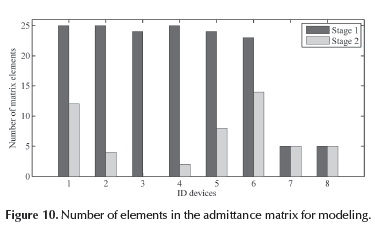
Summary of results
From Figure 10 it can be seen that all elements of admittance matrix for no-PFC devices (2, 3, 4 and 5) should be modeled due to their high sensitivity levels. However, only few elements remain after second stage, as symmetry and linearity are very low. Therefore, frequency domain models are expected to have high errors. For devices 1 and 6 (CFL and passive-PFC PC power supply) more elements remain in the final admittance matrix and a better accuracy is expected. As still a lot of elements are removed, the accuracy might not yet be sufficient. Finally, for devices 7 and 8 (active-PFC electric vehicle and active-PFC PC power supply) no reduction of number of matrix elements is observed and a high accuracy of the frequency models is expected.
Conclusions
This paper uses a set of indices that allows a quantitative assessment whether a nonlinear household load can be represented by a sufficient accurate frequency domain model. Frequency-domain models are preferred for large scale simulations, because development time and simulation times are considerably shorter than for component-based time-domain models. In order to select representative devices, a study of commonly used equipment in Colombia was carried out.
The devices have been classified into no-PFC, passive-PFC and active-PFC, and a representative set of devices was selected and measured. Fingerprints for every load were calculated and suitability of a frequency domain model for the respective device was assessed based on three individual indices.
The results show that no-PFC devices and passive PFC devices have high auto and cross sensitivity levels, but also high levels of asymmetry and nonlinearity. Therefore, significant errors are expected with a coupled Norton model and either lookup tables for admittance values or time-domain models are recommended.
Active-PFC devices have high auto sensitivity levels and low cross sensitivity levels. As the fingerprints for active-PFC devices are highly linear and symmetric, a high accuracy of decoupled Norton models are expected. Finally, a hybrid approach consisting of time-domain models for the loads with simple circuits (no-PFC and passive-PFC) and frequency-domain models for complex devices with active PFC seems to be most promising for efficient and accurate network harmonic studies.
As one of the next steps, a detailed simulation-based comparison of frequency-domain and time-domain models for the simple no-PFC equipment will be carried out in order to quantify the model errors. Furthermore, the suitability of different improvements of the frequency-domain approach will be tested with the main focus in order to develop a sufficiently accurate but also fast model of highly nonlinear devices for large-scale network simulations.
References
Blanco, A. M., Yanchenko, S., Meyer, J. & Schegner, P. (2015). The impact of supply voltage distortion on the harmonic current emission of non-linear loads. In DYNA vol. 82, no. 192, pp. 150-159. DOI: 10.15446/dyna.v82n192.48591. [ Links ]
Cobben, J.F.G., Kling, W.L. & Myrzik, J.M.A. (19-25 May 2007). The making and purpose of harmonic fingerprints, Proceedings of 19th International Conference on Electricity Distribution (CIRED 2007), Vienna, Austria. [ Links ]
Collin, A. J., Acosta, J. L., Hayes, B. P., & Djokic, S. Z. (November 2010). Component-based aggregate load models for combined power flow and harmonic analysis, 7th Mediterranean Conference and Exhibition on Power Generation, Transmission, Distribution and Energy Conversion (MedPower 2010), pp. 171-171. [ Links ]
Ceuk, V., Cobben, J.F.G., Kling, W.L., & Ribeiro, P.F. (December 2013). Analysis of harmonic current summation based on field measurements, in Generation, Transmission & Distribution, IET, vol.7, no.12, pp.1391-1400. [ Links ]
Djokic S. Z & Collin A. J., (May 2014). Cancellation and attenuation of harmonics in low voltage networks, Proceedings of International Conference on Harmonics and Quality of Power, ICHQP, 2014, pp. 137-141. [ Links ]
Fõlting, A., Myrzik, J., Wiesner, T., & Jendernalik, L., (August 18-22, 2014). Practical Implementation of the Coupled Norton Approach for Nonlinear Harmonic Models. 18th Power Systems Computation Conference Wroclaw, Poland. Pp.1-6. [ Links ]
Ghorbani, M. J., Rad, M. S., Mokhtari, H., Honarmand, M. E., & Youhannaie, M., (March 25-28 2011). Residential Loads Modeling by Norton Equivalent Model of Household Loads, in Asia-Pacific Power and Energy Engineering Conference, pp. 1-4. [ Links ]
Institute of Electrical and Electronics Engineers. Std 519-1992, Recommended Practices and Requirements for Harmonic Control in Electrical Power Systems, pp.1, 112. [ Links ]
Kiss, P., & Balazs, G. G., (2014). Double Domain Simulation -modelling the harmonic effect of different nonlinear loads, in 2014 16th International Conference on Harmonics and Quality of Power (ICHQP), pp. 395-399. [ Links ]
Mau Teng Au., & Milanovic, J.V., (Jan. 2007). Development of Stochastic Aggregate Harmonic Load Model Based on Field Measurements, in Power Delivery, IEEE Transactions on, vol.22, no.1, pp.323-330. [ Links ]
Medina, A., Segundo, J., Ribeiro, P., Xu, W., Lian, K.L., Chang, G.W., Dinavahi, V., & Watson, N.R., (July 2013). Harmonic Analysis in Frequency and Time Domain, in Power Delivery, IEEE Transactions on, vol.28, no.3, pp.1813-1821. [ Links ]
Müller, S., Meyer, J., & Schegner, P., (May 2014). Characterization of small photovoltaic inverters for harmonic modelling. 16th International Conference on Harmonics and Quality of Power (ICHQP), pp. 659-663. [ Links ]
Müller, S., Meyer, J., Schegner, P., & Djokic, S., (2015). Harmonic modeling of electric vehicle chargers in frequency domain, in International Conference on Renewable energies and Power Quality (ICREPQ), pp. 1-6. [ Links ]
Salles, D., Chen, J., Xu, W., Freitas, W., & Mazin, H.E., (Oct 2012). Assessing the Collective Harmonic Impact of Modern Residential Loads-Part I: Methodology, in Power Delivery, IEEE Transactions on, vol.27, no.4, pp.1937-1946. [ Links ]
Yanchenko, S., & Meyer, J., (2015). Harmonic Emission of Household Devices in Presence of Typical Voltage Distortions. In PowerTech 2015, Eindhoven. Pp. 1-6. DOI: 10.1109/PTC.2015.7232518. [ Links ]
