


Serviços Personalizados
Journal
Artigo
 Inglês (pdf)
 Artigo em XML
 Referências do artigo
 Enviar este artigo por email
Indicadores
-
 Citado por SciELO
 -
 Acessos
Links relacionados
-
 Citado por Google
 -
 Similares em
SciELO
Similares em
SciELO -
 Similares em Google
Compartilhar

 Permalink
Ingeniería e Investigación
versão impressa ISSN 0120-5609
Ing. Investig. vol.35 supl.1 Bogotá dez. 2015
https://doi.org/10.15446/ing.investig.v35n1Sup.53435
DOI: http://dx.doi.org/10.15446/ing.investig.v35n1Sup.53435
Comparison of maintenance scheme effects on power transformer reliability performance
Comparación de los efectos de esquemas de mantenimiento en el desempeño de la confiabilidad de un transformador de potencia
I.C. Durán1, L.S. Rosero2, A. Pavas3, and O.G. Duarte4
1 Ivan Camilo Durán: Electrical Engineer, Universidad Nacional de Colombia, Colombia. MSc in Electrical Engineering, Universidad de los Andes, Colombia. Affiliation: PhD Candidate in Electrical Engineering, Universidad Nacional de Colombia, Colombia.
E-mail: icdurant@unal.edu.co
2 Laura Sofía Rosero: Affiliation: Electrical Engineering Student, Universidad Nacional de Colombia, Colombia.
E-mail: lsroseroz@unal.edu.co
3 Andrés Pavas: Electrical Engineer, Universidad Nacional de Colombia, Colombia. MSc in Electrical Engineering and PhD in Electrical Engineering, Universidad Nacional de Colombia, Colombia. Afiliation: Assitant professor, Universidad Nacional de Colombia, Colombia.
E-mail: fapavasm@unal.edu.co
4 Oscar Germán Duarte: Electrical Engineer, Universidad Nacional de Colombia, Colombia. MSc in Industrial Automation, Universidad Nacional de Colombia, Colombia. PhD in Informatics, Universidad de Granada, España. Afi-liation: Associate professor, Universidad Nacional de Colombia, Colombia.
E-mail: ogduartev@unal.edu.co
How to cite: Duran, I.C., Rosero, L.S., Pavas, A., & Duarte, O. (2015). Comparison of maintenance schemes effects on power transformer reliability performance, Ingeniería e Investigación, 35(Supl) 73-81. DOI: http://dx.doi.org/10.15446/ing.investig.v35n1Sup.53435
ABSTRACT
Power transformer failures have a significant impact on electrical systems reliability, as they compromise the electricity delivery. Failures impact the operational cost of electric utilities as they endanger the accomplishment of power commitments. Power transformer failure rate can be modeled from its health condition, which is determined from different condition parameters. This paper is aimed to compare different maintenance schemes that allow the asset to be available the longest possible time. The power transformer operation is represented considering actual electric load profiles and temperature. Electrical and thermal transformer parameters are taken from manufacturer tests and technical standards. An electrical-thermal model is employed to estimate the life span reduction and temperature changes. From life span and loading, the health condition is determined, so as the effects of different maintenance schemes. The failure rates are calculated for unmaintained conditions and different maintained schemes, allowing to determine their effects on transformer reliability. Optimal maintenance schemes are determined and the expected benefits in failure rate reduction, asset reliability and life span extension are presented. As a result, it was found that certain time-based maintenance schemes provide better transformer reliability performance in comparison to condition based schemes, allowing to reduce the interruptions and extending the life of the transformer.
Keywords: Power transformer, failure rate, maintenance, health index, reliability improvement, asset management.
RESUMEN
Las fallas en los transformadores de potencia tienen un impacto significativo sobre la confiabilidad de los sistemas eléctricos, debido a que comprometen la prestación del servicio de energía. Las fallas impactan los costos operacionales de la energía debido a que ponen en riesgo el cumplimiento de los contratos de energía. La tasa de falla en los transformadores de potencia puede modelarse a partir de su condición de salud, la cual es determinada a partir de diferentes parámetros de condición. Este artículo apunta a comparar diferentes esquemas de mantenimiento que permitan tener el activo disponible el mayor tiempo posible. La operación del transformador de potencia es representada considerando perfiles reales de temperatura y carga eléctrica. Los parámetros eléctricos y térmicos del transformador son tomados de pruebas de fabricantes y estándares técnicos. Un modelo eléctrico-térmico es empleado para estimar la reducción de vida útil y los cambios de temperatura. A partir de la vida útil y la carga se determina la condición de salud, así como el efecto de diferentes esquemas de mantenimiento. Se calculan las tasas de falla para condiciones sin mantenimiento y para diferentes esquemas de mantenimiento, permitiendo determinar los efectos en la confiabilidad del transformador. De los esquemas de mantenimiento se presentan los beneficios esperados en la reducción de la tasa de fallas, confiabilidad del activo y extensión de la vida útil. Como resultado, se encontró que ciertos esquemas de mantenimiento basados en el tiempo proveen un mejor desempeño de la confiabilidad del transformador que permitiendo reducir las interrupciones y extendiendo la vida útil del transformador.
Palabras clave: Transformador de potencia, tasa de fallas, mantenimiento, índices de salud, mejoramiento de la confiabilidad, gestión de activos.
Received: September 15th 2015 Accepted: October 15th 2015
Introduction
In asset management, maintenance of power transformers is considered an important task. Thanks to maintenance, it is possible to mitigate the problems of premature aging and extend the equipment useful life (Brown, & Humphrey, 2005). The main issue of maintenance is to know the most pertinent moment to perform the activities. Transformer manufacturers, standards and maintenance engineers suggest either schedules or advisable moments when the maintenance should be performed. Maintenance seeks to avoid potential equipment failures and the use of corrective maintenance, which involves stopping transformer operation indefinitely.
When maintenance is scheduled at regular moments it is known as time-based maintenance (TBM), which has been widely implemented and documented in several standards. This practice presents many advantages over corrective maintenance, but also has disadvantages in comparison to other types of maintenance (Shneider, Gaul, Neumann, Hogrãfer, Wellbow, Shwan, & Shnettler, 2006). The advantages and disadvantages are:
- It can detect faults for reduced maintenance intervals.
- It can increase useful life of the power transformer for regular maintenance.
- It can be expensive when regular inspections happen to be unnecessary.
- It does not always detect faults over long periods of maintenance.
- It can lead to unnecessary transformer shutdowns, increasing operational costs.
The kind of maintenance performed according to certain performance or observed physical conditions, is known as Condition-Based Maintenance (CBM). This type of maintenance is based on transformer health status, modifying the maintenance schedule, reducing possible potential failures and their corresponding costs.
This paper presents a method to estimate the optimal maintenance scheme based on the calculation of reliability, condition and failure rates of power transformers. The transformer condition is determined from the aging and the insulation degradation. Methodologies for estimating the aging are extracted from currently available methods.
The paper is divided in five sections. The first section briefly explains how to model the power transformer using an electro-thermal approach. The second section explains how to model the health index, the failure rate and the maintenance effects on failure rate for power transformers. The next section evaluates the reliability performance for different maintenance schemes with an optimization and application case. The application case is divided in: settings, loss of life due to thermal effects, condition monitoring results, reliability and optimization results. The fourth section presents some discussion about maintenance schemes. Finally, the last section presents the conclusions.
Electrical-thermal power transformer model
The Power Transformer is modeled with an approximate model, which represents the temperature exchange between the ambient and the transformer, so as the oil circulation. The model works with two differential equations, which are the mathematical representation of the equivalent circuits of the oil-to-air and the winding-to-oil heat transfer (Duran et al, 2013), (Mazo et al, 2015). Equation (1) represents the oil-to-air heat transfer and Equation (2) models the simplified winding-to-oil heat transfer
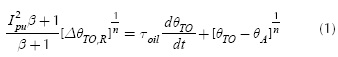
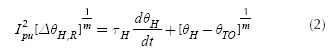
Where θTO is the Top-oil temperature rise over ambient, θH is the Hot-spot temperature rise over the oil, θλ is the ambient temperature, is the exponent of loss function vs. top-oil rise and m is the exponent of load squared vs. winding gradient (Institute of Electrical and Electronics Engineers [IEEE], 2011), τH is the winding time constant at the hot spot location in minutes, ΔθHR is the rated temperature hot-spot rise over ambient, IPM is the per unit load, β is the ratio of load to no-load losses (IEEE, 2011), τOIL is the top oil time constant in minutes, and ΔθTOR is the rated top oil temperature rise over ambient. All temperatures are in Celsius.
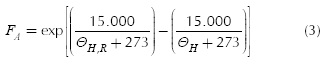
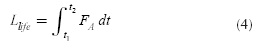
With the Hot-Spot temperature, the accelerated aging factor can be calculated according to Equation (3) for thermally-upgraded power transformers (Duran & Duarte, 2012), (Duran et al, 2015). The loss of life Llife is extracted from Equation (4) (Duran et al, 2013), (International Electrotechnical Commission [IEC], 2005), for an observation time t2-t1 in hours.
Health index and failure rate modeling
Health Index is a powerful tool that allows to estimate the conditions in power transformers, combining multiple measurement and inspections as a single quantitative indicator. This indicator can be useful to make a simple model for the behavior of the failure rate in power transformers.
Health index
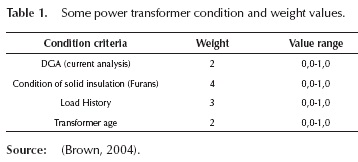
A methodology to calculate a health index is the weighted sum of individual indicators (Jahromi, Piercy, Cress, Service, & Fan, 2009), (Brown, 2004). This sum requires to set the individual indicators over a numeric range, where excellent condition is set to 0,0 and worst condition to 1,0. The thresholds for each state are based on the limits proposed by international standards (Institute of Electrical and Electronics Engineers [IEEE], 2009), (IEC, 2005). These limits can be modified according to local conditions and expert experience.
In (Jahromi et al, 2009) some thresholds for individual indices are proposed, with five health states ri for each index. In (Brown, 2004) the thresholds use nine numeric states. References (Jahromi et al, 2009) and (Brown, 2004) use different weights wi for each index. This paper takes into account the weight criteria of (Brown, 2004), as listed in Table 1. Table 2 shows the thresholds for the Load History indices (Jahromi et al, 2009). The Value range for the index is modified to use the same range showed in Table 1.
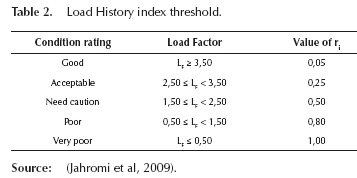
To calculate the Load Factor, a linear method of load score is proposed in (Jahromi et al, 2009), applying Equation (5) and Table 3.
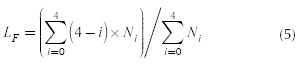
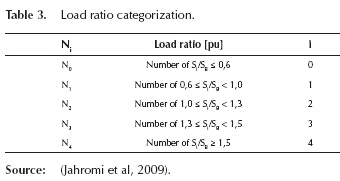
Where Ni is number of Si/SB, Si is the monthly peak load, and SB is the rated loading of the transformer. For the present paper, Si/Sb=Ipu.
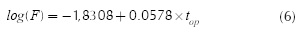
Some condition indicators are only for current values, but not for trending values. Some authors established trending equations for these types of indicators, such as furans. In (Shang, 2001) an equation was proposed to calculate the time of operation top of solid insulation in hours, based on the amount of parts per million (ppm) of furans F in the oil, also based on the Chendong degree of polymerization. The trend equation is shown in Equation (6).
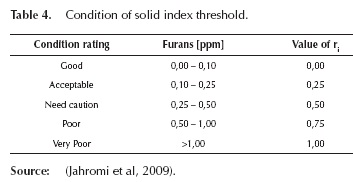
The threshold for Furans is shown in Table 4 (Jahromi et al, 2009). Again, the value range for the index is modified to use the range shown in Table 1.
In the case of Dissolved Gas in oil Analysis (DGA), it is much more difficult to determine a trend equation. Reference (IEEE, 2009) proposes a table with different increase rates for the dissolved gas content TDCG. This dissolved gas content is calculated with Equation (7) (IEEE, 2009).
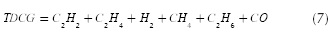
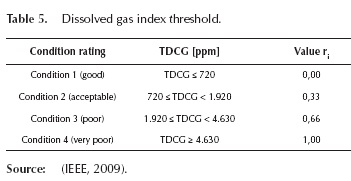
Table 5 shows the threshold used calculate the condition for dissolved g value range is proposed for condition.
For transformer age, the individual condition index is taken from (Brown, 2004) and shown in Table 6.
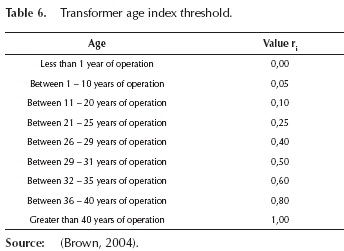
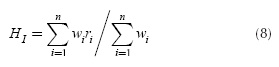
With wi and from Tables 1, 2, 4, 5 and 6, the health index Hi is calculated with Equation (8) (Brown, 2004).
Failure rate modeling
In order to obtain the transformer failure rate, it is necessary to have a history of failures and maintenance workouts to estimate a statistics model. An interesting technique is proposed in (Brown, 2004), which performs an interpolation between three failure rates (good, average and bad condition) for power transformers. The result is an exponential Equation (9), where the failure rate is calculated in function of the health index.
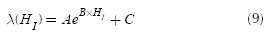
Where A, B and C are constants. Reference (Brown, 2004) presents an interpolation procedure to determine the given constants with Equations (10) to (12).
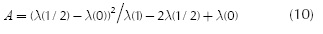
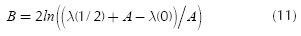
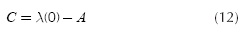
Where λ(0) is the failure rate for good condition, λ(1/2) is the failure rate for average condition and λ(1) is the failure rate for bad condition.
Maintenance effects on failure rates
Maintenance work on power transformers is applied not only to fix damages inside the equipment, but also as a preventive measure to reduce the possibility of future failures and extending the transformer useful life. A good maintenance work reduces the general health to the immediately previous condition state. Some indicators do not change with maintenance work, such as age or internal solid insulation, but others like DGA can be reduced even to zero.
The health condition index always tries to return to its natural behavior without maintenance. The time gained between maintenance work and the return to the natural aging will be the transformer life span extension.
With the aim of determining the possible decrease in the failure rate due to maintenance, (Wang, Lu, Bie, You, & Cao, 2014) proposed the iterative Equation (13), which calculates different failure rates, and the result is the maximum value achieved from these iterations.
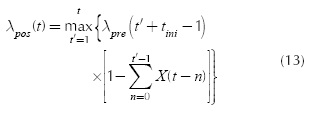
Where λpos(t) the transformer failure rate after maintenance, λpre(t') is the previous failure rate for iteration t', t is the total study time, tini is the initial time duration after last maintenance, X(t) is an auxiliary binary variable, equal to 1 if maintenance is conducted or otherwise equal to 0.
Evaluation of maintenance schemes performance
Because TBM, supplied by manufacturers and standards, is not always the most suitable maintenance, some experts apply a CBM to improve maintenance issues. However, CBM schemes cannot be completely optimal, and therefore it is necessary to evaluate the reliability performance in order to know the benefits among different maintenance schemes.
Failure simulation and reliability estimation
The irst step to evaluate the performance of each maintenance scheme is the calculation of failure rates. For every scheme, the evolution of the condition is calculated with and without maintenance using Equation (8), and then the failure rate is calculated with Equations (9) and (13). From the failure rate curves, with a Monte Carlo simulation, the reliability of the transformer is determined by calculating the probability of expected interruptions for each scheme. An Exponential distribution model is employed to simulate the failures, as shown in Equation (14).
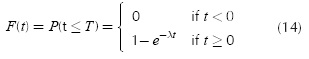
Where F(t) stands for the probability of a failure to happen for a time lesser than T, and λ is the failure rate.
Optimization of maintenance schemes
Once the failure rates and the expected reliability for each maintenance schemes are calculated, maintenance schedules are technically optimized by minimizing the number of interruptions and maintenance actions as function of the applied maintenance schedule.
The applied optimization is linear multivariable. The Equations of the objective function and constraints are shown in (15).
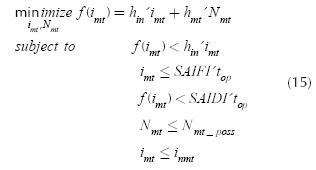
Where f(imt) is the objective function which depends on the number of interruptions imt and number of maintenance activities Nmt in each case, hin is the duration in hours for the interruptions, hmt is the duration in hours for each maintenance action, inmt is the number of interruptions without maintenance, Nmt_poss is the maximum number of possible maintenance works, and top is the operation time in years.
SAIDI and SAIFI indexes are reliability performance indicators for distribution systems. These indexes are not the most commonly employed indicators to study reliability performance for power transformers, but provide an initial quantification to study interruptions frequency and duration, i.e. transformer reliability. Both indexes are calculated using Equations (16) and (17).
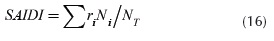
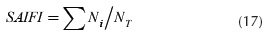
Where ri is the restoration time for each interruption event, Ni is the Number of interrupted customers for each sustained interruption event during the reporting period, and NT is the Total number of customers served for the area (IEEE, 2012).
Application case
In order to assess the reliability performance for different maintenance schemes, a power transformer of 25 MVA 66/11 kV ONAF is simulated. The study time starts 5 years from commissioning to 40 years.
Maintained scenarios parameters
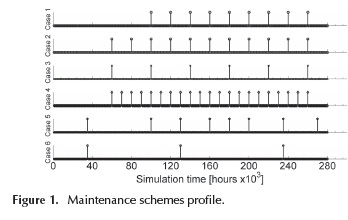
The first simulation (Case 1) consists of a TBM with the maintenance intervals of 20.000 hours between maintenance actions, starting from 100.000 hours. The second TBM simulation (Case 2) is performed with the same intervals of Case 1, but starting from 60.000 hours. The third TBM simulation (Case 3) starts maintenance actions at the same time of Case 2, but the maintenance interval is 40.000 hours (one half the frequency of Case 2). The last TBM simulation (Case 4) starts maintenance action at 60.000 hours, but the maintenance interval is 10.000 hours (twice the frequency of Case 2). The fifth simulation consists in a CBM with maintenance actions in every condition change, and some TBM maintenance every 20.000 hours. Finally, the second CBM simulation (Case 6) performs each maintenance action only where a condition change is observed. Case 6 shows the moments where CBM maintenance is applied for Case 5 and 6. Figure 1 illustrates the six proposed maintenance schemes.
Transformer parameters
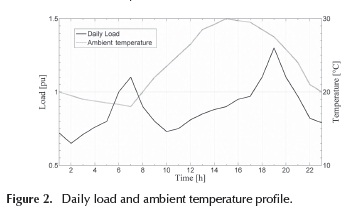
The input parameters for the power transformer are given in Table 7. The load profile and the ambient temperature profile are show in Figure 2. A yearly constant demand growth of 0,06 % is assumed.
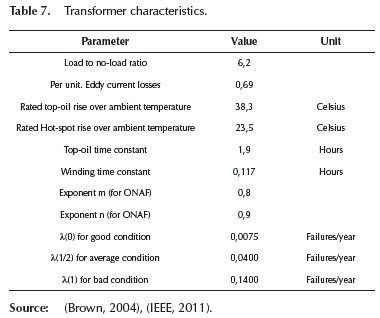
Using the parameters of Table 7, considering only the effects of ambient temperature and load heating, without considering any kind of maintenance, and not taking into account any other factors capable of affecting the useful lifetime, the transformer experiences a 2,72 years loss of life for a 35 years simulation. This kind of aging is unlikely to happen in real conditions; therefore, the proposed modeling procedure must be applied. This result will be employed for the simulation cases in the next section as a reference aging baseline.
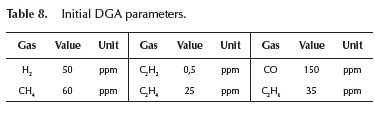
For condition monitoring, four individual indicators are considered. The indicators and their weights are taken from Table 1. Initial values for DGA are derived from technical standards, Table 8 shows the values assumed for the application case. Equation (6) is used for furans growth, for an operation time top = 306.600 hours.
Unmaintained performance simulation
The following results will be displayed against a time scaled at thousands of hours, which corresponds approximately to one month.
Taking into account the reference temperature aging baseline calculated above, the growth of furans and DGA, Figure 3 shows the behavior of every individual condition indicator. It is worth to note that the age indicator remains constant over the 40 years. In addition, the load indicator remains constant. On the other hand, DGA and furans indicators have significant condition changes.
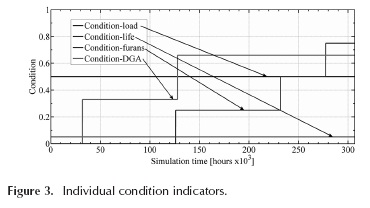
In the case of furans, its change follows Equation (6) and is calculated for an approximate solid insulation total life of 55-60 years. For the DGA, growth is given in the early stages for transformer simulation, and then stabilizes. This behavior is unique to this simulation.
When applying Equation (8) with the given indicators and the weights, Hi is calculated for the power transformer. The result is a stepped curve shown in Figure 4. This curve is converted to a continuous condition curve (ramp), by joining the points where the condition values change. The unmaintained failure rate is calculated using Equation (9) and displayed in Figure 5.
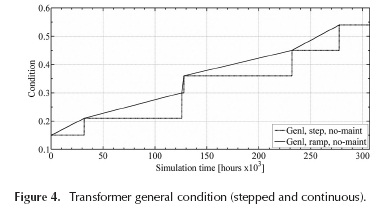
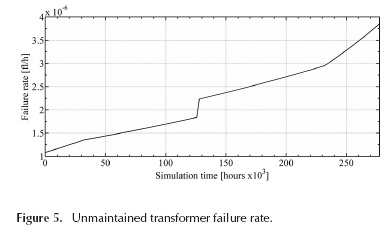
In Figure 4, a sharp rise in the failure rate between 125.900 and 128.000 hours can be observed. This increase, although it lasts a short duration (only 2.100 hours), is caused by the simultaneous changes in furans and DGA indicators, as can be detailed in Figure 3. It is also noted that the change is comparable to the increase after 231.800 hours, which lasts longer. These types of jumps, in the case of dissolved gases, can be improved by means of preventive maintenance actions.
Maintained scenarios performance simulation
Figures 6 to 9 show the yielded failure rates for all TBM Cases, which were derived from Equation (13). Figures 10 and 11 show the failure rate results for CBM Cases 5 and 6.
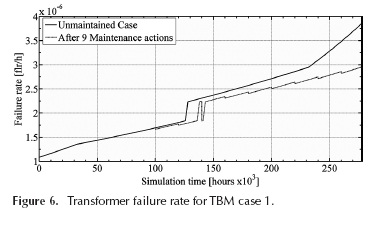
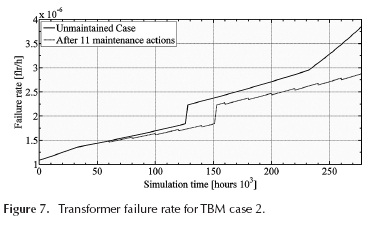
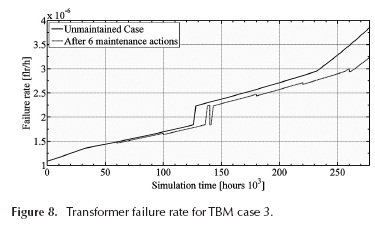
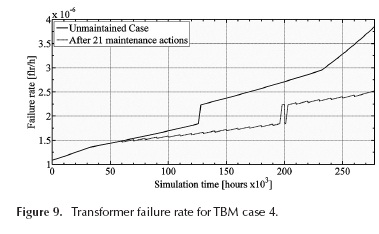
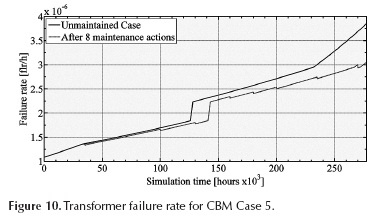
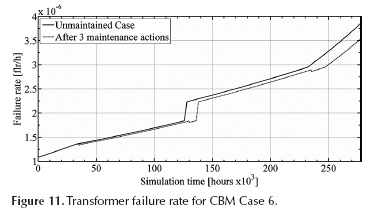
In both cases, no abrupt reductions in the failure rate are observed, especially in the middle of the simulation. This is because these schemes applied the maintenance just a few hours after the condition change. This shows, compared with what happened in the cases 1, 3 and 4, that the maintenance action must be placed just after a significant increase in the failure rate. This ensures a longer useful life for the power transformers without incurring in high-maintenance costs.
It is important to highlight which indicator causes the failure rate increase, since some components such as the solid insulation are not repairable.
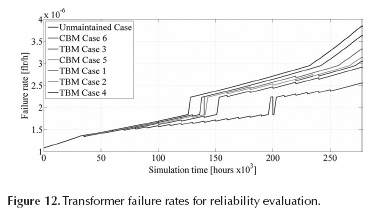
From the results of Figures 6 to 11, the amount of non-programmed interruptions for TBM and CBM cases during the 35 years of simulation was calculated. Figure 12 shows seven cases of failure rate were the calculation of reliability is applied. The cases found in the box are listed in a descendent way. For the calculation of unscheduled interruptions, as previously explained, a Monte Carlo simulation is applied, with 200 realizations as the initial parameter. Equation (14) is applied to determine the probability of interruption for the each case.
The results in Figure 13 show in more detail the comparison of non-programmed interruptions for all the six Maintained Cases against the Unmaintained Case. The cases found in the box are listed from right to left.
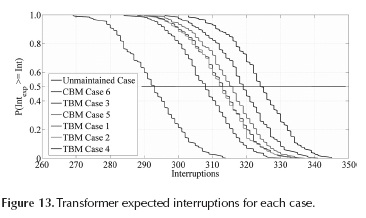
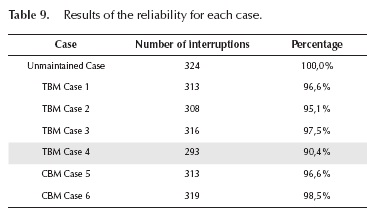
First, noted in the middle of the figure, Cases 1 and 5 had the same amount of expected interruptions. This is because the number of maintenance actions are almost equal and with similar points of application. As the number of maintenance applied decreases, the expected interruptions approach the case without maintenance, as shown in Cases 3 and 6. In contrast, when increasing the number of maintenance actions, there was a considerable achievement in reductions in interruptions, as shown in Cases 2 and 4. Comparing CBM and TBM cases, a gain in reliability appears if the maintenance frequency increases. The probabilities of 50 % of interruptions for all cases are shown in table 9.
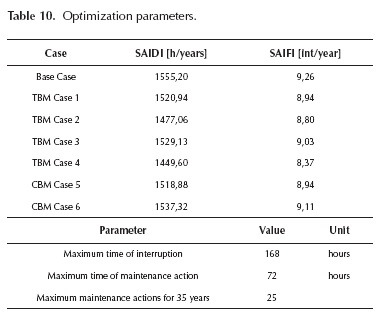
Finally, the optimization of Equation (15) is performed for each simulated case. The SAIDI and SAIFI are calculated from the 50 °% of interruptions of the reliability simulation using Equations (16) and (17). The maximum number of hours per interruption, hours required to perform a maintenance action and maximum of maintenance works are arbitrary values. Table 10 shows the values for the optimization.
The optimization results are listed in Table 11, which are the number of expected interruptions for each maintenance scheme and the number of maintenance actions.
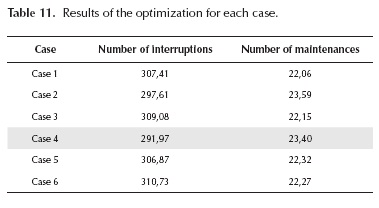
Note that the TBM Case 1 and CBM Case 5 once again had similar results, since interruptions curves are superposed, as show in Figure 13. TBM Case 4 had the best scheme because it had the lower number of interruptions with respect to the other cases (approximately 292). This quantity of interruptions is for 23 maintenances preformed during the 35 years of simulation.
Discussion
The results demonstrated that while the condition-based maintenance cases succeed by not using unnecessary maintenance actions, they fail when trying to decrease the lifetime maintenance with respect to the unmaintained base case. In asset management theory, CBM has advantages with respect to TBM, but this investigation found that it cannot be true under certain conditions.
Table 12 shows how each maintenance scheme, with respect to the unmaintained case, improved or not the most representative indicators for reliability and useful life.
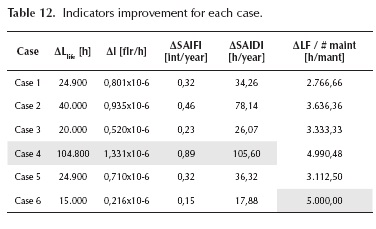
Clearly, this table shows that a time-based, such as Case 4, is much better since it increases the useful life of the transformer in 104.800 hours or 11,96 years, significantly reduces the failure rate in 1,331x10-6 failures/hour (65,5 °% in comparison to non-maintained case) and has the largest decrease of SAIFI (0,89 int/year) and SAIDI (105,60 h/year). If the best increase of transformer lifetime per maintenance action is the desired result, the optimal solution is Case 6. This is because it takes fewer interruptions during the life cycle of the transformer, achieving a reasonable extension of useful life.
Finally, it is interesting to see the analysis of results, how the time-location of the maintenance action is essential. This is due to the fact that when there are some points with a high decrease in the health condition, the maintenance actions will not make the desired life extension, despite its significant failure rate reduction.
Conclusions
Maintenance schemes for power transformers, independent of the type, are mechanisms capable of reducing the failure rate and extending the useful life with respect to its normal growth due to the aging and usual usage.
Choosing a scheme based on the behavior of individual and general condition of the transformer can anticipate possible potential failures, mitigating the problems of aging in the power equipment.
The after-maintenance failure rate method appliance shows that there are maintenance works which reduce the failure rate, but do not ensure a long extension of useful life, and they are more expensive than other maintenance works.
The combination of time-based and condition-based schemes allow to choose an optimal plan to extend the life of the transformer.
A hybrid scheme between time and condition-based maintenance may be optimal when the study is centered in future aging, which only takes into account the past and present behavior.
Acknowledgment
The authors would like to thank Engineers Fernando Suescún and Daniel Rondón of Siemens S.A.G. for their invaluable support in the development of this paper. They also acknowledge the support of Universidad Nacional de Colombia and PAAS-UN Research Group.
References
Brown, R. (2004, June). Failure rate modeling using equipment inspection data. Presented at the Power Engineering Society General Meeting. 2004. Source: 10.1109/ PES.2004.1372900. [ Links ]
Brown, R., & Humphrey, B. (2005). Asset management for transmission and distribution, Power and Energy Magazine, IEEE, 3, 39 - 45. DOI: 10.1109/MPAE.2005.1436499. [ Links ]
Duran, I., & Duarte, O. (2012, November). A survey of methods of estimating lifetime and aging of assets in substations. Paper presented at the 9th IET International Conference on Advances in Power System Control, Operation and Management (APSCOM 2012), DOI: 10.1049/cp.2012.2141. [ Links ]
Duran, I., Duarte, O., & Pavas, A. (2013, March). Insulation temperature increase in power transformers due to stationary disturbances: Comparison of methods. Paper presented at the Workshop on Power Electronics and Power Quality Applications (PEPQA). DOI: 10.1109/ PEPQA.2013.6614960. [ Links ]
Duran, I., Duarte, O., & Pavas, A. (2015, August). Effects on lifetime of low voltage conductors due to stationary power quality disturbances. DYNA, 82, 44-51. DOI: 10.15446/dyna.v82n192.48568. [ Links ]
International Electrotechnical Commission [IEC]. (2005). Power transformers - Part 7: Loading guide for oil-immersed power transformers. (IEC 60076-7), Geneva, Switzerland. [ Links ]
International Electrotechnical Commission [IEC]. (1999). Mineral oil-impregnated electrical equipment in service, guide for interpretation of DGA. (IEC 60599) Geneva, Switzerland. [ Links ]
Institute of Electrical and Electronics Engineers [IEEE]. (2011). Guide for Loading Mineral-Oil-Immersed Transformers and Step-Voltage Regulators (Revision of IEEE Std C57.91-1995). (Std C57.91-201 1). Retrieved from IEEE Online. [ Links ]
Institute of Electrical and Electronics Engineers [IEEE]. (2009). Guide for the Interpretation of Gases Generated in Oil-Immersed Transformers (Revision of IEEE Std C57.I04-1991). Retrieved from IEEE Online. [ Links ]
Institute of Electrical and Electronics Engineers [IEEE]. (2012). Guide for Electric Power Distribution Reliability Indices (Revision of IEEE Std 1366-2003). (Std 1366-2012). Retrieved from IEEE Online. [ Links ]
Jahromi, A., Piercy, R., Cress, S., Service, J. & Fan, W. (2009). An approach to power transformer asset management using health index. Electrical Insulation Magazine, IEEE, 25, 20-34. DOI: 10.1109/MEI.2009.4802595. [ Links ]
Mazo Mantilla, H. F., Salcedo Merchán, M. A., Pavas, A. Durán, I. (2015). Modeling of a Distribution Transformer Performance Operating under Harmonic Polluted Conditions. Paper presented at the Second Workshop on Power Electronics and Power Quality Applications (PEPQA), Bogotá, Colombia, 1-6, June 2015. [ Links ]
Peña Huaringa, O. J., (2011, October). Studying and Simulating Transformer Configuration to Improve Power Quality. REVISTA INGENIERÍA E INVESTIGACIÓN, 31 Suplemento No. 2 (SICEL 201 1), 125-130. Retrieved from Ingeniería e Investigación Online. [ Links ]
Shang, Y., Yang, L., Guo, Z., & Yan, Z. (2001, June). Assessing aging of large transformers by furfural investigation. Paper presented at the of the 2001 IEEE 7th International Conference on Solid Dielectrics (ICSD '01). DOI: 10.1109/ICSD.2001.955620. [ Links ]
Shneider, J., Gaul, A. J., Neumann, C., Hogrãfer, J., Wellbow, W., Shwan, M., & Shnettler, A. (2006). Asset management techniques. International Journal of Electrical Power & Energy Systems, 28, 643 - 654. DOI: 10.1016/j.ijepes.2006.03.007. [ Links ]
Wang, J.; Lu, J.; Bie, Z.; You, S., & Cao, X. (2014). Long-Term Maintenance Scheduling of Smart Distribution System through a PSO-TS Algorithm. Journal of Applied Mathematics. Special Issue, 1-12. DOI: 10.1155/2014/694086. [ Links ]
