


Services on Demand
Journal
Article
 English (pdf)
 Article in xml format
 Article references
 Send this article by e-mail
Indicators
-
 Cited by SciELO
 -
 Access statistics
Related links
-
 Cited by Google
 -
 Similars in
SciELO
Similars in
SciELO -
 Similars in Google
Share

 Permalink
Ingeniería e Investigación
Print version ISSN 0120-5609
Ing. Investig. vol.36 no.1 Bogotá Jan./June 2016
https://doi.org/10.15446/ing.investig.v36n1.51580
DOI: http://dx.doi.org/10.15446/ing.investig.v36n1.51580
Time-frequency analysis of DC bias vibration of transformer core on the basis of Hilbert-Huang transform
Análisis de tiempo y frecuencia de vibración de polarización DC del núcleo del transformador sobre la base de Hilbert-Transform Huang
X.M. Liu1, Y.M. Yang2, F. Yang3, and Q.Y. Shi4
1 Xingmou Liu. M.S. degree in Electrical Engineering, Chongqing University, Chongqing, China. Affiliation: Ph.D candidate in Electrical Engineering, Chongqing University, Chongqing, China.
E-mail: liuxingmou@cqu.edu.cn.
2 Yongming Yang. Ph.D in Electrical Engineering, Chongqing University, Chongqing, China. Affiliation: professor at College of Electrical Engineering, Chongqing University, China.
E-mail: yangyym@cqu.edu.cn.
3 Fan Yang. Ph.D in Electrical Engineering, Chongqing University, Chongqing, China. Affiliation: professor at the College of Electrical Engineering, Chongqing University, China.
E-mail: yangfancqu@gmail.com.
4 Qingyan Shi. M.S. degree in Electrical Engineering from Chongqing University, Chongqing, China,. Affiliation: engineer at Yantai Electric Power Supply Company, Shandong Electric Power Company, State Grid Corporation of China, China.
E-mail: 527883354@qq.com.
How to cite: Liu, X., Yang, Y., Yang, F., & Shi, Q. (2016). Time-frequency analysis of DC bias vibration of transformer core on the basis of Hilbert-Huang transform. Ingeniería e Investigación, 36(1), 90-97. DOI: http://dx.doi.org/10.15446/ing.investig.v36n1.51580.
ABSTRACT
This paper presents a time-frequency analysis of the vibration of transformer under direct current (DC) bias through Hilbert-Huang transform (HHT). First, the theory of DC bias for the transformer was analyzed. Next, the empirical mode decomposition (EMD) process, which is the key in HHT, was introduced. The results of EMD, namely, intrinsic mode functions (IMFs), were calculated and summed by Hilbert transform(HT) to obtain time-dependent series in a 2D time-frequency domain. Lastly, a test system of vibration measurement for the transformer was set up. Three direction (x, y, and z axes) components of core vibration were measured. Decomposition of EMD and HHT spectra showed that vibration strength increased, and odd harmonics were produced with DC bias. Results indicated that HHT is a viable signal processing tool for transformer health monitoring.
Keywords: DC bias, transformer, vibration, HHT.
RESUMEN
En este trabajo se presenta un análisis tiempo-frecuencia de la vibración del transformador bajo polarización de corriente continua (CC) a través de transformación Hilbert-Huang (HHT). En primer lugar, se analizó la teoría de la DC de polarización para el transformador. A continuación, el proceso de descomposición de modo empírico (EMD), que es la clave en HHT, se introdujo. Los resultados de EMD, a saber, las funciones del modo intrínsecas (IMFS), se calcularon y se suman por transformada de Hilbert (HT) para obtener series dependientes de tiempo en un dominio de tiempo-frecuencia 2D. Por último, un sistema de prueba de medición de vibraciones para el transformador se creó. Se midieron tres componentes de dirección de vibración del núcleo (ejes x, y, y z). La descomposición de los espectros EMD y HHT mostró que la fuerza de la vibración aumentó, y los armónicos impares se produjeron con polarización CC. Los resultados indicaron que la HHT es una herramienta de procesamiento de señales viable para la vigilancia de la salud del transformador.
Palabras clave: Sesgo DC, transformadores, vibración, HHT.
Received: June 29th 2015 Accepted: December 22nd 2015
Introduction
In the coming years, an increasing number of UHVDC systems are expected to be built all over the world. According to the latest research report of Markets and Markets, the profits generated by the UHVDC market will reach USD 13.54 billion in 2020, and the compound growth rate during the growth period is predicted to exceed 17 %. However, when UHVDC systems are operated under monopole mode, DC bias occurs in transformers with neutral grounding points (Baguley & Madawala 2008, DANG et al. 2009, YANG et al. 2012). DC bias causes magnetic saturation and induces overheating and vibration (Franz et al. 2014), which deteriorate the safety mechanisms of transformers and shorten their life spans (Bai et al. 2010, Li et al. 2013).
Most existing studies only focus on the analysis of the exciting current of transformers under DC bias conditions and the identification of exciting current distortions. Hence, extensive research on the external performance characteristics of transformers under DC bias is lacking (Monteiro et al. 2012).
Vibration increase is a key factor in detecting whether a transformer works normally or not. Thus, the vibration signal must be analyzed through signal processing. Traditional time-frequency analyses, such as wavelet and short-time Fourier transform (STFT), have many limitations when applied to non-linear signals (Andrade et al. 2014). By contrast, Hilbert-Huang transform (HHT) is not subject to other uncertainty limitations for time and frequency resolutions. HHT is a completely self-adapting approach for the identification of damage time instant and location in civil and mechanical structures (Andrade et al. 2004, Liu et al. 2006, Messina & Vittal 2005, Sanchez-Gasca et al. 2005, Ruiz-Vega et al. 2005).
In this study, a transformer with DC bias was analyzed. Transformer vibration is obviously reinforced when DC current flows into the transformer neutral grounding. A test system of vibration measurement for the transformer was then set up. Three direction (x, y, and z axes) components of core vibration were measured. The results of empirical mode decomposition (EMD) and HHT spectrum decomposition showed that vibration strength increased, and odd harmonics (particularly 50, 150, and 250 Hz) were produced with DC bias. Observations from the marginal spectra implied that the 50 Hz component appeared, the 50 Hz component increased twofold in y-direction, and the 150 Hz component increased threefold in z-direction. DC bias affected the transformer seriously and may influence power quality or system safety in the long-term processes.
Transformer DC Bias
DC magnetic biasing is caused by DC magnetic flow in the transformer iron core; it causes asymmetric saturation of a positive or negative half cycle and a series of magnetic effects. Geomagnetic storm and a large current of DC transmission system earth electrode are the main reasons for this phenomenon.
When a high-voltage direct current earth electrode pours DC current in single pole operation, potential distribution is formed in the nearby ground; through the earth, the current flows to contra variant substation DC electrode (Huang et al. 2007). If a transformer exists near the DC electrode neutral ground, a part of the current will flow into the transformer through the grounding neutral point, which is a loop formed with an alternating current (AC) electric network. Consequently, exciting current combines DC current with AC field current, as shown in Figure 1, thereby causing the magnetization curve to go into the saturation region (Kang et al. 2011, Lee et al. 2011). This phenomenon causes DC magnetic biasing.
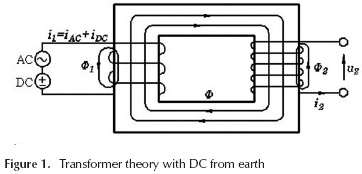
Figure 2 shows the magnetizing current resulting from the saturation of a transformer by a DC bias. The figure presents the magnetization curve and the flux and magnetizing current curves for cases with and without DC current. The magnetizing current is plotted from the flux and magnetization curve. (a) is the flux curve, (b) is the exciting curve of the transformer, and (c) is the curve of exciting current.
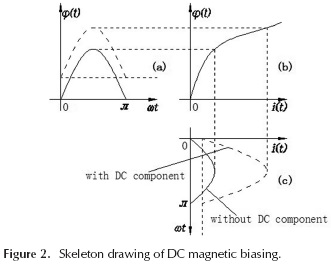
The distortion of exciting current with the DC current component is caused by the non-linearity of the transformer magnetization curve. In this condition, the transformer core is in the saturated state. The magnitude of exciting current is related to DC current size besides transformer design.
HHT Processing
Empirical Mode Decomposition
EMD is a multiresolution decomposition way that disposes the nonstationary or nonlinear signal into many IMFs that originated from an analyzed signal itself (Huang et al. 1998, Huang et al. 2003, Yan & Gao 2007). But the IMF must satisfy two conditions.
-
The number of extrema and the number of zero-crossings are either equal to each other or differ by at most one.
-
At any point, the mean value between the envelope defined by local maxima and the envelope defined by the local minima is zero.
The EMD could be described and expressed into IMFs by the process following:
-
For the analyzed signal x(t), find the all local maximums and minimums, then fit them into upper envelope xmax(t) and lower envelope xminJt) by cubic spline.
-
To get the envelope mean of upper and lower envelopes:
-
Compute the difference between x(t) and m1(t), resulting in first component h1(t):
-
To judge the result h1(t), if it accords with the two conditions of IMF, record c1(t)=h1(t). and it is the first IMF component. Otherwise, treat h1(t) as the analyzed signal and iteration on h1(t) by steps 1-4.
-
Through the k times iteration, the difference between the signal and the mean envelope which is defined as h1k(t)
-
The residue is expressed as:


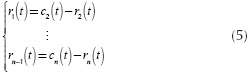
where m1k(t) is the mean value of envelope after k times iteration and h1(k1)(t) is the difference between signal and mean of iteration. If the hik(t) satisfies the IMF component, recorded as c(t) = htk(t):

Then, the r1(t) can be regarded as a new signal, iterate repeatedly to get the other IMFs according to steps 1-5 and obtain cn (t) and a residue rn (t).
Therefore, the signal x(t) can be written as:
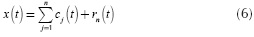
Where cj.(t) is the jth IMF, rn(t) is the residue of signal decomposition.
However, it is impossible that each signal satisfies the two IMF conditions perfectly. The iteration stop condition must be considered as:
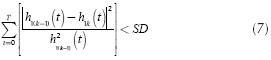
Where SD is the standard deviation, and can usually be controlled between 0.2 and 0.3. Then, it is the complete express of EMD process. the signal can be reconstructed by Equation (6).
Hilbert Transform
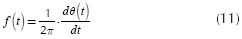
The HHT technique is based on the instantaneous frequency calculation. Generally, all of the analytic signals can be expressed by the sum of the real part x(t) and the imaginary part y(t). It is necessary to construct an analytic signal as Equation (8). Where a(t) is the instantaneous amplitude, and  (t) is the instantaneous phase. The imaginary part of the analytic signal is created by Hilbert transform of the signal. Thus, the Hilbert transform is expressed as Equation (9).
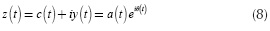
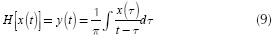
Where H[.] presents the Hilbert transform operation. And the imaginary part y(t) is the result of H[x(t)]. Hence, Equation (8) can written by means of the polar coordinate system.
Among
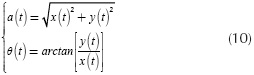
Thereby, the instantaneous frequency can be given as
The Hilbert Spectrum
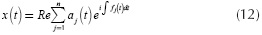
Each IMF component was obtained by EMD and recorded as ci(t). After performing them according to HT, the analyzed signal x(t) could be expressed as the real part of the analytic signal shown in Equation (12).
The signal is thus presented by time-frequency distribution. The underlying HHT of the signal is mathematically defined as:
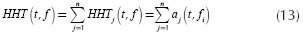
where HHTj(t,f) presents the time-frequency distribution. It is computed by j th IMF from the aforementioned Equation (8)-(11). The aj(t,f) consists of amplitude aj(t) and instantaneous frequency fj(t) of each IMF component.
The HHT spectrum is an illustration of vibration signal. It focuses on the time-dependency of the frequency components and signal energy. Thus, it is more efficient for nonstaitionary or nonlinear signal.
Experiment and analysis of vibration
Test platform
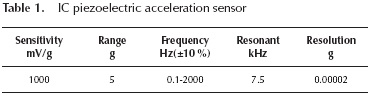
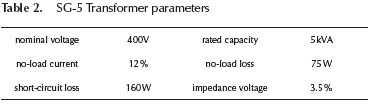
A test system was used in the vibration analysis of the transformer core. The piezoelectricity acceleration sensors were used to measure the vibration acceleration of the transformer core. Its performance is as shown in Table 1.
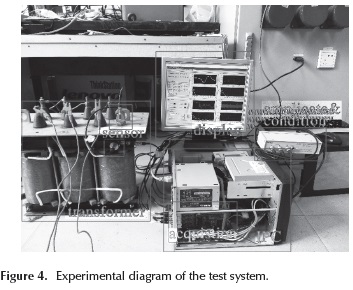
The measured signal was stored in an acquisition card after amplification and conditioning. An industrial personal computer was then used to analyze the measured signal. The block diagram is shown in Figure 3. The experimental diagram is shown in Figure 4.
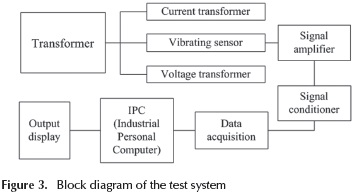
The data acquisition program was designed to obtain the signals based on LABVIEW software. By means of calculation with MATLAB software, the time-frequency analysis of vibration signals have been realized.
Experimental data analysis
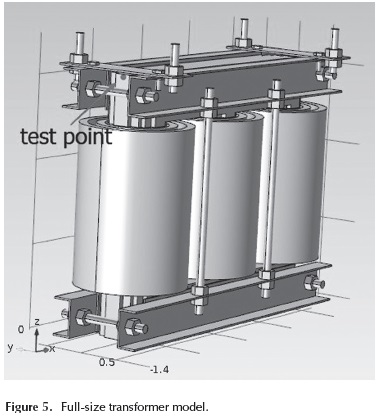
The transformer studied is a dry, three-phase unit (5 kVA, 50 Hz), as shown in Figure 4. Table 2 presents the parameters of this transformer. According to experience and the calculation performed, when the magnetic field flows around in core, the magnetic circuit causes the maximum in the top of core limb. Magnetic flux mainly gathers into core limbs, so the vibration of core limbs will be a more accurate reflection of the magnetostriction change. The vibration strength at the sharp point of the core limb (the red point in Figure 5) was the most serious. Thus, this point (as the vibration test object) was measured and analyzed.
The acceleration waves of the x, y, and z directions were collected to analyze their spectrum, as well as the core with no load and a 2 A DC current.
In the vibration test, the transformer worked with rated condition. Then, at the arrival time of 0.18 s, a 2 A DC current was injected into the grounding electrode of the transformer, and DC bias of the transformer was produced. The abnormal vibration caused by DC bias was recorded through the Test platform. Figure 6 shows the vibration signals of x-, y-, and z-direction components at the test point. The wave at 0.18 s changed the jumping. Thus, part I presents vibration under normal work, and part II presents vibration under DC bias.
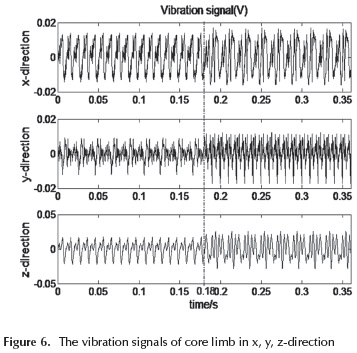
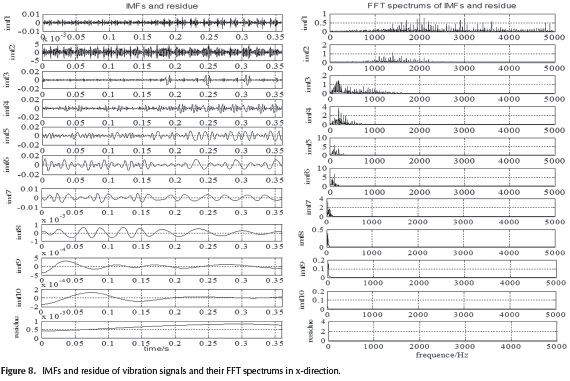
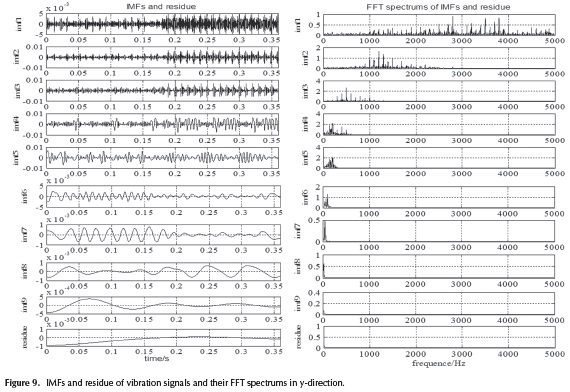
In fact, the abnormal vibration of z-direction influenced by DC bias was more serious than that of other two directions, since the magnetic flux direction mainly focused on z-direction of the magnetic circuit. Therefore, the vibration strength of the signal in z-direction was larger than that in the other two directions. We decomposed the signal of the z-direction component by EMD and obtained the IMFs and residue as shown Figure 7. The amplitudes of IMF1 and IMF2 were too small, i.e., approximately 10e-3 magnitude. The main frequency range of IMF1 was approximately 4500 Hz to 5000 Hz, and the main frequency range of IMF2 was approximately 1000 Hz to 2000 Hz. These results indicate interference or noise. IMF3 to IMF9 presented the intrinsic modes of the vibration signal. Figure 7 and Figure 8 show the signal and FFT spectrums of each IMFs and residue in x-direction and y-direction, respectively. There are 10 IMFs in x-direction and 9 IMFs in y-direction. In x-direction and y-direction, the first two IMFs were too small. The main frequency range of IMF1 were located from 1000 Hz to 5000 Hz. And the main frequency range of IMF2 were located from 1000 Hz to 2000 Hz. Both IMF1 and IMF2 expressed the noise model of vibrations.
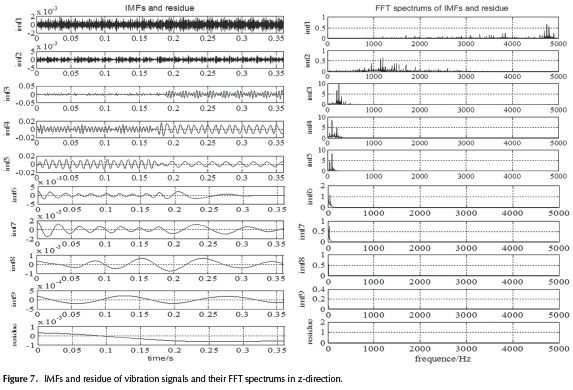
All three direction results show that EMD filtrated the signal and obtained intrinsic modes from high frequency to low frequency. When DC bias was produced in the transformer, the high-frequency components increased significantly as exhibited by IMF3 and IMF4; IMF5 shows that the amplitude of the mid-frequency components changed larger by DC bias. However, the low-frequency components were decreased with DC bias in later IMFs of three direction vibrations. The residual should be left out of the HHT spectral analysis since it is a monotonic function or a constant and it has no frequency components. Therefore, each mode of vibration should be investigated through IMF performance.
According to Equations (8)-(13), the HHT spectrum of the z-direction vibration signal was generated to observe the time-frequency property intuitively. In Figure 10, the shade represents the signal energy in decibels.
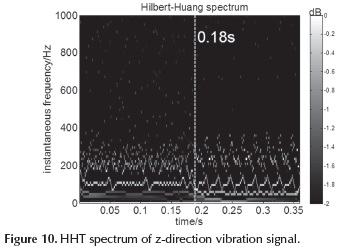
The corresponding HHT identified frequency changes at the time instance of 0.18 s during the first data segment and after another 0.18 s during the second data segment. The time-frequency and signal strength change indicate that DC bias was produced at 0.18 s. When the transformer worked normally, 100 and 200 Hz were the main components. However, owing to the DC bias, the original frequencies (100 and 200 Hz) fluctuated periodically and obviously, and their intensity increased significantly, as indicated by the color change. In addition, many odd harmonics (50 and 250 Hz) were produced and reinforced. Frequency undulation with time can be clearly distinguished.
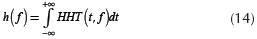
The introduction of a marginal spectrum can be observed from the total amplitude of instantaneous frequency, as shown in Equation (14).
The marginal spectrum was clear and more exact than the Fourier spectrum in reflecting the real frequency of the signal. According to the marginal spectrum, the energy focused on a certain frequency. The marginal spectrum of the z-direction vibration signal is shown in Figure 11.
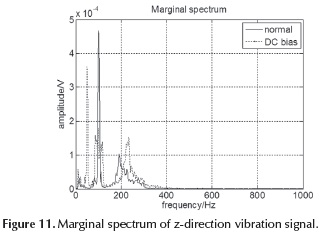
Figure 11 illustrates the total amplitude of each frequency. When DC bias was produced, the 150 and 250 Hz components occupied a large part of energy. This result is consistent with the result of the HHT spectrum.
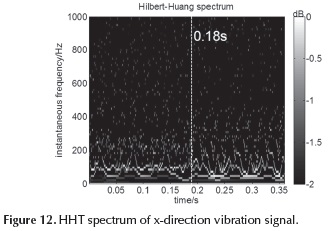
The HHT of the other two directions was calculated to analyze the vibration of the core. The EMD processes and IMFs were omitted.
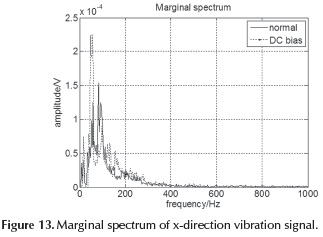
Figure 12 shows the HHT spectrum of the x-direction vibration signal. Similar to the condition presented in Figure 8, DC bias occurred at 18 s. From 0.18 s to 0.36 s, the frequency of 50 Hz increased considerably, and the undulation of instantaneous frequency was more serious than that before 0.18 s. As shown in Figure 13, in the marginal spectrum, the total amplitude of the 50 Hz component occupied the main part of energy after 0.18 s. This result is consistent with that of HHT.
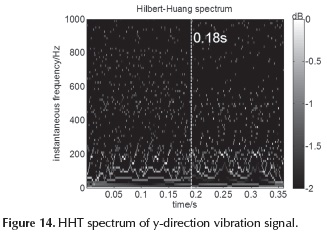
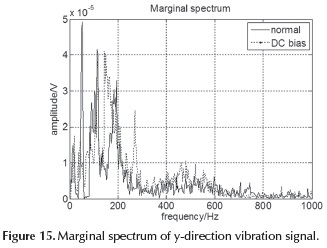
Figures 14 and 15 present the HHT and marginal spectra of the y-direction vibration signal. The energy or amplitude of y-direction differed from those of the other two directions. Figure 12 shows that the 200 Hz component increased and the 100 Hz component decreased. The marginal spectrum shows that the 100 Hz component weakened, but the 150 Hz component slightly increased.
Conclusion
The experimental studies conducted on a transformer showed that DC bias can be clearly detected by time-dependent amplitudes and instantaneous frequency resulting from HHT. This method can be further applied to the health monitoring of other transformers or equipment.
In this paper, HHT theory was introduced through EMD to obtain IMFs and calculate instantaneous frequency and HH transform. The HHT spectrum was then depicted to analyze the signal property. Thereafter, transformer DC bias theory was investigated. Lastly, the real transformer vibration signal was analyzed through HHT. The results indicated that DC bias leads to an increase in vibration and the generation of odd harmonics, especially vibration in z-direction of the core. The transformer would work abnormally and may affect grid safety if long-term operation with DC bias continues.
References
Andrade M.A., Messina A.R., Rivera C.S. and Olguin D. (2004, August). Identification of instantaneous attributes of torsional shaft signals using the Hilbert transform. IEEE Trans. Power Syst., vol. 19, no. 3, 1422-1429. DOI: 10.1109/TPWRS.2004.829664. [ Links ]
Baguley A., Carsten B. and Madawala U. K. (2008). The Effect of DC Bias Conditions on Ferrite Core Losses. IEEE Transactions on Magnetics, 44(2), 246-252. DOI: 10.1109/TMAG.2007.911594. [ Links ]
Bai B.D., Liu C., Wang J.Y.. (2013). Simulation and Experimental Research of Transformer Vibration under DC Magnetic Bias. Transactions of China Electrotechnical Society, 28(sup.2), 427-433. [ Links ]
DANG K., ZHANG X.Y., ZHANG F., DANG Z.Y. (2009). Simulative Study on Power Transformer With DC Magnetic Biasing. Power System Technology, 33(20), 189-192. [ Links ]
Franz H., Helmut P., Georgi S. (2014). Rise-of-temperature method for building factor distribution in 1-phase model transformer core interior considering high DC bias. International Journal of Applied Electromagnetics and Mechanics, 44(3-4), 349-354. [ Links ]
Huang, N.E., Shen, Z., Long, S.R., Shih, H.H. (1998). The empirical mode decomposition and the Hilbert spectrum for nonlinear and nonstationary time series analysis. Proc. R. Soc. A, Math., Phys. Eng. Sci., vol.454, no.1971, 903-995. DOI:10.1098/rspa.1998.0193. [ Links ]
Huang N.E., Wu M.C., Long S.R., Shen S.P., Qu W., P. Gloer-sen, and K. L. Fan. (2003). A confidence limit for the empirical mode decomposition and the Hilbert spectral analysis. Proc. Royal. Soc. London. A, vol. 459, 2317-2345. DOI: 10.1098/rspa.2003.1123. [ Links ]
Kang Y C, Lee B E, Hwang T K. Estimation of the Separate Primary and Secondary Leakage Inductances of a Y-A Transformer Using Least Squares Method. Journal of Electrical Engineering & Technology, 5(4), 538-544. [ Links ]
Lee J Y, Moon S R, Koo D H, Lee G H. (2011). Comparative study of stator core composition in transverse flux rotary machine. Journal of Electrical Engineering & Technology, 6(3), 350-355. DOI: 10.5370/JEET.201 1.6.3.350. [ Links ]
Liu, B., Riemenschneider, S., Xu, Y. (2006). Gearbox fault diagnosis using empirical mode decomposition and Hilbert spectrum. Mech. Syst. Signal Process. vol.20, no.3, 718-734. [ Links ]
Liu S., Messina A.R. and Vittal V. (2004). Characterization of nonlinear modal interaction using Hilbert analysis and normal form theory. Proc. IEEE Power Eng. Soc. Power Systems Conf. Expo., New York. DOI: 10.1016/j.ymssp.2005.02.003. [ Links ]
LI X.P., WEN X.S., LAN L. (2010). Test and Simulation for Single-phase Transformer Under DC Bias. Proceedings of the CSEE, 25(4), 71-76. [ Links ]
Monteiro T.C., Martinz F.O., Matakas L. and Komatsu, W. (2012). Transformer Operation at Deep Saturation: Model and Parameter Determination. IEEE Transactions on Industry Applications, 48(3), 1054-1063. DOI: 10.1109/TIA.2012.2190256. [ Links ]
Messina A.R. and Vittal V. (2005). Assessment of nonlinear interaction between nonlinearly coupled modes using higher order spectra. IEEE Trans. Power Syst., vol.20, no. 1, 1515-1521. DOI: 10.1109/TPWRS.2004.841240. [ Links ]
Ruiz-Vega D., Messina A.R. and Harper G. (2005, August). Analysis of interarea oscillations via non-linear time series analysis techniques. Proc. 15th Power Systems Computation Conf. Liege: Belgium. [ Links ]
Sanchez-Gasca J.J., Vittal V., Gibbard M.J., Vowles D.J., Liu S. and Annakage U.D. (2005, June). Analysis of higher order terms for small signal stability analysis. Proc. IEEE Power Eng. Soc. General Meeting, San Francisco: CA. DOI: 10.1109/pes.2005.1489301. [ Links ]
YANG Y.M., LIU X.M., CHEN T., YANG F., XIANG D. (2012). Research on Considering the Soil Structure of UHVDC Influencing Transformer DC Magnetic Biasing. Power System Technology, 36(7), 26-32. [ Links ]
Yan R. and Gao R.X. (2007, October). A tour of the Hilbert-Huang transform: An empirical tool for signal analysis. IEEE Instrum. Meas. Mag., vol.10, no.5, 40-45. DOI: 10.1109/MIM.2007.4343566. [ Links ]

