


Services on Demand
Journal
Article
 English (pdf)
 Article in xml format
 Article references
 Send this article by e-mail
Indicators
-
 Cited by SciELO
 -
 Access statistics
Related links
-
 Cited by Google
 -
 Similars in
SciELO
Similars in
SciELO -
 Similars in Google
Share

 Permalink
Ingeniería e Investigación
Print version ISSN 0120-5609
Ing. Investig. vol.36 no.2 Bogotá May/Aug. 2016
https://doi.org/10.15446/ing.investig.v36n2.53773
DOI: http://dx.doi.org/10.15446/ing.investig.v36n2.53773
Optimal under voltage load shedding based on voltage stability index
Esquema óptimo de deslastre de carga por baja tensión basado en índice de estabilidad de tensión
Karol López1, Sandra Pérez2, and Luis Rodríguez3
1 Electrical Engineer, Universidad Tecnológica de Pereira, Colombia. Affiliation: Researcher at ICE3, Universidad Tecnológica de Pereira, Colombia. E-mail: kdlopez@utp.edu.co
2 Electrical Engineer, M.Sc. Universidad Tecnológica de Pereira, Colombia. Ph.D., Universidad Nacional de Colombia. Affiliation: Associated professor at Universidad Tecnológica de Pereira, Colombia. E-mail: saperez@utp.edu.co
3 Electrical Engineer, M.Sc. Universidad Tecnológica de Pereira, Colombia. Affiliation: Researcher at ICE3, Universidad Tecnológica de Pereira, Colombia. E-mail: luferodriguez@utp.edu.co
How to cite: Lopez, K., Pérez, Sandra., & Rodríguez, Luis. (2016). Optimal under voltage load shedding based on voltage stability index. Ingeniería e Investigación, 36(2), 43-50. DOI: 10.15446/ing.investig.v36n2.53773.
ABSTRACT
This paper presents a methodology for under voltage load shedding using a metaheuristic optimization technique and a stability criterion. Two strategies are proposed to find the minimal size and location of load to shed for the recovery of normal operation conditions. The first one is based on a classical criterion for the under voltage load shedding, identifying the load to disconnect by considering bus voltage level; the second includes a simplified voltage stability index SVSI, which identifies critical buses in the system. The proposed methodology is implemented in an IEEE 14 bus test system, considering a heavy loading condition with and without contingency to validate its efficiency.
Keywords: Load shedding, voltage stability, particle swarm optimization.
RESUMEN
En este artículo se presenta una metodología para realizar el deslastre de carga por baja tensión utilizando una técnica de optimización metaheuristica y criterios de estabilidad. Se proponen dos estrategias para encontrar tanto la cantidad mínima de carga a deslastrar como su localización en el sistema, para recuperar las condiciones normales de operación. El primero está basado en el criterio clásico del deslastre de carga por baja tensión, donde se identifica la carga a desconectar considerando los niveles de tensión en las barras del sistema; el segundo incluye el índice simplificado de estabilidad de tensión SVSI, el cual identifica las barras críticas en el sistema. La propuesta se valida en el sistema de prueba IEEE de 14 barras cuando es sometido a varias perturbaciones.
Palabras clave: Deslastre de carga, estabilidad de tensión, optimización por enjambre de partículas.
Received: May 2nd 2016 Accepted: July 24th 2016
Introduction
As power generation and load demand grow in an ever-increasing tendency, it has been widely reported that power systems are currently being run closer to the operation limits because of the lack of expansion of transmission networks as the loads grow, due mainly to environmental and economic constraints. This situation has conduced to more sensitive power systems, which are prone to voltage instabilities or collapses. This effect has been observed and reported in several power systems worldwide (IEA, 2005; Kundur, 1994). For those power systems, which reach the stability limits, strategies for guaranteeing the generation-demand balance are required to avoid collapses, minimizing non-supplied energy and optimizing energy efficiency. Alternatives during an impending voltage collapse include Under Voltage Load Shedding (UVLS) schemes, which are applied when the operation of control and compensation devices, such as FACTS (Nguyen and Wagh, 2009; Greene, Dobson and Alvarado, 1997), turbine governors, automatic voltage regulators (Lerm and Silva, 2004), among others, are inefficient to reach a stable operating state after a disturbance or a contingency. UVLS is based on the possibility of disconnecting some loads (or percentages of load) after a severe disturbance, in order to relocate the operating point far from the critical voltage value (Kessel and Glavitsch, 1986) (Quoe et al., 1994). The immediate problem related to UVLS is the development of a strategy to define the amount of load to shed and its location, in order to save the system from a complete blackout.
According to the literature review, several schemes for the determination of load to shed by UVLS have been proposed, based on classical strategies that shed a constant percentage of load when the voltage is out of range. These can be inadequate for a particular or complex system (Laghari, Mokhlis, Bakar and Mohamad, 2013). These classical methods include homogeneous load shedding, centralized and decentralized load shedding (Pahwa, Scoglio, Das and Schulz, 2013; Mollah, Bahadornejad, Nair and Ancell, 2012; Niar, et al., 1999; Klaric, Kuzle and Tomisa, 2005). Mathematical techniques such as linear programming (LP), nonlinear programming and the interior point method were for this purpose; however, these algorithms require approximations of the power system model to reduce the calculation time (Shen and Laughton, 1970). Metaheuristic computational techniques and their application in electric power systems are well known and have been used as an optimization tool in different applications, including fault recognition, oscillation control, planning, design and operation, among others. One of these techniques is Particle Swarm Optimization (PSO) (Zomaya and Olariu, 2006; Kennedy and Eberhart, 1995), which were applied to improve load shedding automation. In Amraee, Ranjbar, Mozafari and Sadati (2007), an optimal load-shedding algorithm was developed for ULVS using two heuristic methods such as PSO and Genetic Algorithm. A new method based on sequential use of LP and PSO were used to minimize the load shedding in contingency conditions in Tarafdar and Galvani (2011).
Methods for UVLS only consider bus voltage magnitude to define the location and amount of load to shed. However, even if voltages reach a safe operating value, it is well known that bus voltage magnitude is not an adequate indicator of the security of power system operating conditions, especially in modern power systems (Mozina, 2007). Therefore, these UVLS strategies do not guarantee that the operating point after shedding is adequate in terms of voltage stability. A paper related with this is presented in Kanimozhi et al. (2014), where the minimization of the total load shed and the sum of a "New Voltage Stability Index (NVSI)" were considered as objectives to restore the power flow solvability. The same index was also integrated in a load shedding scheme (Sonar & Mehta, 2015), based on swarm intelligence-based optimization techniques.
In this paper, a methodology for UVLS is proposed, where UVLS is modeled as an optimization problem, solved using PSO. The objective function of the optimization problem includes a voltage stability criterion to guide the evolution process of the algorithm towards the determination of the amounts of load to shed and the improvement of the power system voltage stability. This finally leads to a reduction of the non-supplied energy and costs associated to load disconnection.
The structure of the paper is organized as follows. Section II presents the theoretical background related with voltage stability criteria and PSO algorithm. In Section III the methodology is exposed. Based on it, the simulation results are shown in Section IV, where the methodology is tested on an IEEE 14 bus system subject to several disturbances Finally, in Section V, the main conclusions of our tests and future work are presented.
Theoretical Background
Voltage stability indices
Voltage stability indices are mathematical tools to determine the proximity of a power system to an impeding voltage collapse. These are usually formulated to indicate proximity to voltage collapse when its value is close to one, and secure operating points when its value is close to zero. In order to determine an indicator of risk of voltage instability on load buses, one index proposed in literature is Simplified Voltage Stability Index (SVSI) (Pérez, Rodriguez and Olivar, 2014). This index is based on the concept of relative electrical distance (RED), which is used to select the nearest generator to a specific load bus and also the association of electrical variables to improve its performance.
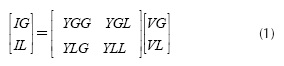
For a given system, the relation between the complex current (I) and voltage vectors (V) at the generator buses (G) and load buses (L) is represented by the admittance matrix, as is given in Equation (1):
Rearranging (1), (2) is obtained:
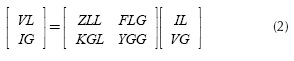
where 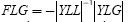 is a complex matrix that gives the relation between load and source bus voltages. The REDs (i.e. the relative locations of load buses with respect to the generator buses) are obtained from the FLG matrix and given in Equation (3) (Yesuratnam and Thukaram, 2007):
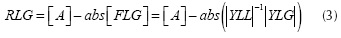
where [A] is the matrix with size (n-g)x g, n is the total number of buses of the network, and g is the number of generator buses. All of the elements of matrix [A] are equal to unity. The information given by the matrix RLG can be used instead of path algorithms to obtain the electrical distances between load and generator buses (Pérez et al., 2014).
Once the nearest generator to a specified load bus is found with the RLG matrix, the voltage drop on the Thevenin impedance ΔVi is estimated using Equation (4):
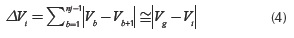
where Vg and Vt are the voltage phasors at the nearest generator and the analyzed load bus, respectively.
Due to simplifications in the development of this index, the inclusion of a correction factor is necessary to avoid loss of sensitivity to the critical point of the system. This factor, denoted as β, is calculated according to Equation (5):
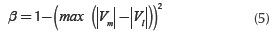
The correction factor is associated with the highest differences of voltage magnitudes between two buses (m and l), which can be obtained directly from PMU measurements in the analyzed power system under speciic operating conditions. Considering the previous, SVSI is given in Equation (6):
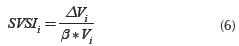
To consider a power system as voltage unstable, the proposed index SVSI must be close to unity (at the maximum loadability point) if and only if the voltage drop in the Thevenin impedance ΔV is equal to the voltage at the load bus, according to the formulation based on the maximum power transfer theory (Perez et al.,2014).
Particle Swarm Optimization
Similar to other stochastic searching techniques, PSO is initialized by generating a population of random solutions, which is called a swarm. Each individual is referred as a particle and represents a candidate solution to the optimization problem. A particle in PSO, like any living object, has a memory that retains the best experience, which is gained during the exploration of the solution area. In this technique, a velocity vector is associated to each candidate solution. The velocity vector is adjusted during every iteration of the algorithm according to the corresponding particle experience and to the experiences of the swarm. Accordingly, in the PSO algorithm, the best experiences of the group are always shared with all particles, and hence it is expected that the particles move toward better solution areas (Kennedy and Eberhart, 1995).
The main features of PSO algorithm are the following:
a. In PSO the particles exchange information. This modiied its direction in function of the previous experience of the neighborhood particles.
b. PSO stores its experience or history of each agent. The particle decides a new direction based on the best position for which it went previously.
c. Usually, it has a rapid convergence to good solutions.
d. The population of the algorithm starts randomly and evolves iteration after iteration.
e. The search always pursues the best possible solution, based solely on the values of the objective function.
f. It is a stochastic technique referred in phase (initialization and transformation),
g. PSO does not create new particles during execution, they are always the same initial particles modiied throughout the process.
The movement of a particle into a swarm according to the best experience of the group is illustrated in the Figure 1.
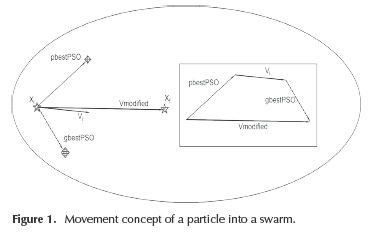
In an n-dimensional search space, the particle position and velocity can be represented as vectors xi = (xi 1, xi2... xn) and vi= = (vil, vi2... vin) respectively. The best previous experience of a i-th particle is saved as pbestPSO =(pbesti1,pbesti 2... pbestn) and the best previous experience of a group is defined as gbestPSOg.
The particle position and velocity are modified in each iteration through Equations (7-8):
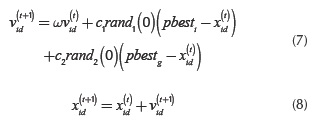
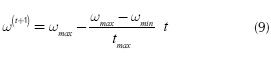
In Equations (7-8), i=1,2,3,...,m is the particle index and t is the iterations number, the constants c1 and c2 are weights that control cognitive and social components; ω is the inertia factor in each iteration, its value decreases according to Equation (9):
Formulation of load shedding optimization problem
The best load shedding location and the minimum load shedding amount during severe contingencies are solved in this paper as an optimization problem. The objective function contains a sensitivity factor to guide the optimization problem, and the problem is subject to constraints associated to power flow restrictions and element capabilities.
Objective functions
To obtain the load percentage corresponding to each busbar according with its voltage collapse sensitivity, two schemes for load shedding are developed. These schemes are a function of the load to be shed at each bus, denoted as ΔP., and include a different sensitivity criterion for the objective function. The first one is related to the ULVS classical criterion based on the voltage level in the busbar, and the second one includes the simpliied voltage stability index SVSI, which identifies critical buses in the system. The purpose is to determine the optimal quantities of active power to shed ( ΔP are decision variables for this problem), according to the established sensitivity criterion. These schemes are explained below.
Scheme 1: Under voltage load shedding using voltage level in each bus
Bus voltage level has a straightforward relation to buses with considerable changes in its operational state after a disturbance. This is the main concept applied for classical load shedding schemes. The objective function in this case is deined by Equation (10):
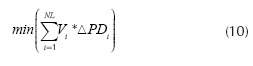
where ΔPDi. corresponds to load shed, i, Vi is the voltage level in the bus i and NL is the total PQ busbar of the system. In this scheme, the lower voltage level of a busbar is the most susceptible of shedding.
Scheme 2. Under voltage load shedding using simplified voltage stability index (SVSI).
This stability index is included in the load shedding scheme in order to guide the algorithm in the load shedding distribution between the buses of the system, according to its contribution to voltage collapse. Therefore, the buses with higher value of SVSI will be better candidates for shedding.
The objective function to perform load shedding using SVSI is defined in Equation (11):
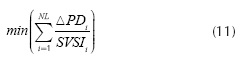
where ΔPDi corresponds to load shed, SVSIi to the voltage stability indicator of bus i, and NL the total PQ busbar of the system.
Constraints of the problem
The load shedding algorithm is formulated in terms of both active and reactive power parameters (P and Q, respectively). Therefore, it is necessary to consider power flow constraints Equations (12 -13).
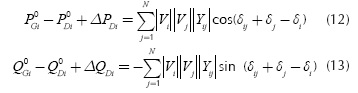
Where the subscripts "G" and "D" are related to generation and consumption at bus i, respectively. Superscript "0" indicates initial state.
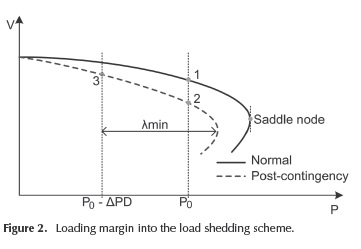
In order to ensure a sufficient distance to voltage collapse, a loading margin λmin is established according to Equations (14-15):
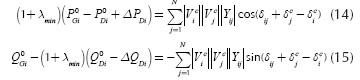
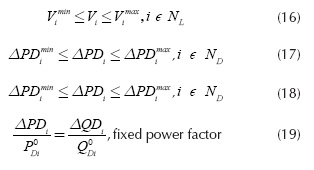
where the superscript "c" is related to the post-contingency state. The loading margin is explained in Figure 2. There, the power system behavior is shown before (blue line) and after a contingency (green line). When a contingency occurs (for instance, a line fault in the system), the point operation defined by point {1} moves to point {2}, which is very close to the critical point (nose curve). To enhance power system security, load shedding must guarantee a loading margin λmin, which is the distance between the new operational point after UVLS is applied {3} and the collapse point. Other model constraints are associated to the voltage levels boundaries for both initial and stressed conditions, load shedding limits and ixed power factor, presented in Equations (16)-(19).
Methodology
According to previous information, both load shedding schemes proposed are initialized if the voltage level at any bus of the system is under voltage threshold predefined by the user (in this paper it was established at 0.9 p.u). The ULVS scheme is carried out following the flow chart shown in Figure 3.
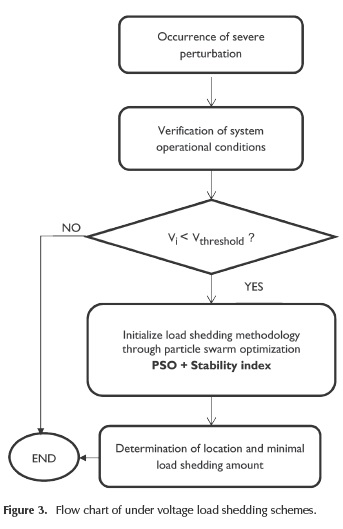
Operational conditions are determined after power flow calculations. If any bus voltage is less than a defined threshold Vthreshold, the optimization process is executed to calculate the minimum amount of load to shed and its location. The required voltage stability indices are also calculated for the formulation of the objective function of the optimization problem.
Considerations related to PSO algorithm
A vector of N components represents each particle for PSO algorithm, where N is the number of available loads to be shed: [ΔP1 ΔP2 ... ΔPi ... ΔPN]. The initial population is generated randomly, assigning a random number between zero and the 40 % of the total active power connected to the bus to each component of the particles.
If a particle reaches an infeasible solution, i.e., when one of the components is lower than zero or greater than the maximum active power shedding limit, a penalty factor is added to the objective function. Finally, as stopping criterion, each PSO execution is stopped when a fixed number of iterations is reached.
Results and discussion
Test description
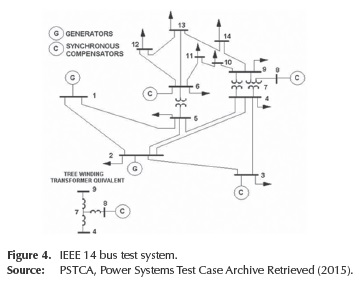
The methodology previously presented is tested using the IEEE 14 bus test system (PSTCA, 2015), and PSAT as simulation tool. The test system is shown in Figure 4.
In order to test the effectiveness of the proposed methodology, this paper presents a study for the following operating conditions:
- Heavy loading at bus 14 without contingency
- Heavy loading with contingency (single line outage 3-2)
For each case, load shedding is triggered if voltage at any bus is lower than 0,9 p.u. The optimization problem sheds load until all buses have a voltage not lower than 0,95 p.u. The maximum amount of load to shed at each bus is 40 % of the connected load at the bus at the moment when load shedding is triggered.
PSO parameters
PSO parameters for this application were obtained through exhaustive testing, choosing a set that led to the best results. These are summarized in Table 1.
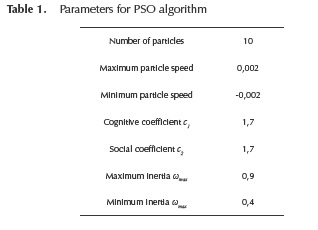
For each loading factor, PSO algorithm was executed 20 times. Each execution is stopped after the algorithm has reached 100 iterations. A penalty factor α = 1010 is added to the objective function when an infeasible solution is reached. Each PSO execution is completed in two minutes.
Heavy loading at bus 14 without contingency
In this case, the loading at bus 14 is increased gradually until 4,3 times its nominal load. In this condition, the level voltage at that bus corresponds to 0,9 pu and, therefore, the load shedding schemes are executed. Figure 5 shows the minimum load shedding amount for each loading margin (from 0,01 to 0,1 p.u).
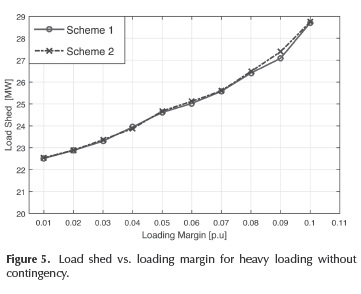
According to Figure 5, if a higher loading margin is required, a greater load amount must be disconnected. In Figure 6, voltage magnitude at each bus considering a load margin of 0,1 is shown. Once load shedding procedures are applied, all voltage magnitudes are above the specified threshold of 0,95 p.u.
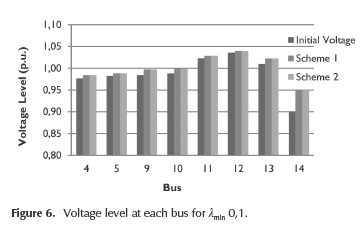
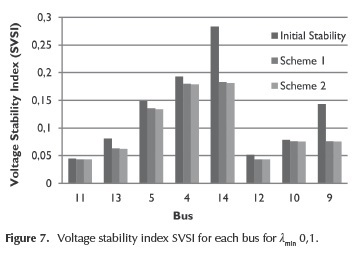
In order to verify the power system stability after the execution of the proposed methodologies, a voltage stability analysis using SVSI is performed. The results obtained are shown in Figure 7. It is clear that the proposed solution by scheme 2 leads to a better operating state, in terms of voltage stability.
Heavy loading with contingency (single line outage 3-2)
In order to show the effectiveness of the proposed schemes on severe disturbances, a test was performed. The line 3-2 was disconnected and the power system loading is increased to 1,5 times its nominal value.
The minimum load shedding amount for each loading margin according to the proposed schemes is shown in Figure 8.
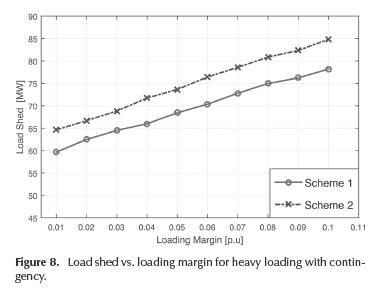
In this case, scheme 1 sheds less amount of load compared to scheme 2. However, both schemes follow the same tendency. Figure 9 shows the load shed corresponding to each bus for a λmin 0,1.
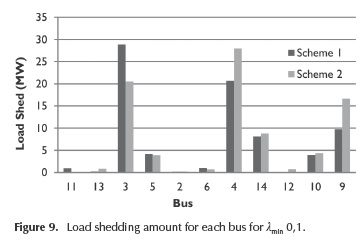
According to Figure 9, either scheme assigns an amount of load for shedding to each busbar in the system considering the index used. The voltage levels before and after the implementation of load shedding schemes are shown in Figure 10.
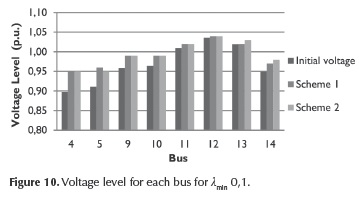
The results show that voltage levels at all buses of the power system are improved after shedding, over the expected voltage level of 0,95 p.u. With the final purpose of analyzing the voltage stability before and after the implementation of load shedding schemes, a voltage stability study is performed using SVSI and the results are shown in Figure 11.
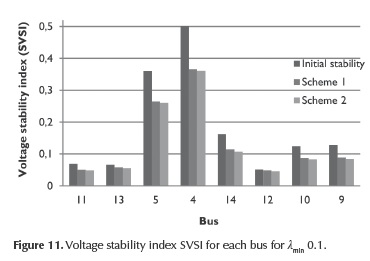
According to Figures 10 and 11, even if the voltage level is the same after the implementation of both load shedding schemes, there are differences in the results of voltage stability levels according to SVSI index (even if both schemes present comparable results, they are not equal and, in effect, scheme 2 improves more the voltage stability than scheme 1). The previous information allows to conclude that load shedding considering the voltage level may not always be an effective criterion, because this does not generally guarantee the major voltage-stable condition of the system after its execution (lower index, more stable operating condition).
Conclusions
This paper approaches aspects related to load shedding in power systems, as an emergency strategy for avoiding voltage collapse. Due to the necessity to determine the minimal amount of load to shed, two methodologies for optimal under voltage load shedding considering particle swarm optimization are proposed; one of these including stability criteria in order to guide the optimization process to a solution where shed load is minimal and voltage stability is also improved.
According to the results obtained, both schemes of under voltage load shedding are efficient to increase the voltage level in every busbar of a system after its execution. However, after a voltage stability analysis of the results of each scheme, it is possible to conclude that load shedding considering the voltage level is no warranty of an adequate voltage stability condition. Then, the relevance of including scheme voltage stability index as SVSI into load shedding is demonstrated, as this consideration leads to a better solution in terms of voltage stability. As this methodology establishes a criterion for load shedding based on voltage stability indices, further work is focused on an online implementation, applying machine-learning techniques to reduce the computational effort associated to PSO calculations.
References
Amraee, T., Ranjbar, A.M., Mozafari, B., & Sadati, N. (2007). An enhanced under-voltage load shedding scheme to provide voltage stability. Electr. Pow. Syst. Res. 77. 1038- 1046. DOI: 10.1016/j.epsr.2006.09.005. [ Links ]
Greene, S., Dobson, I., & Alvarado, F. L. (1997). Sensitivity of the loading margin to voltage collapse with respect to arbitrary parameters. IEEE Transactions on Power Systems, Vol. 12, No. 1, 262 - 272. DOI: 10.1109/59.574947. [ Links ]
IEA, International Energy Agency. (2005). Learning from the blackouts. Transmission System Security Electricity Markets. [ Links ]
Kanimozhi, R., Selvi, K., & Balaji, K.M. (2014). Multi-objective approach for load shedding based on voltage stability index consideration. Alexandria Engineering Journal. Vol. 53, No. 4, 817-825. [ Links ]
Kennedy, J., & Eberhart, R. (1995) Particle Swarm Optimization. Proceedings of IEEE International Conference on Neural Networks, Vol. 4, Perth, Australia. 1942-1948. DOI: 10.1109/icnn.1995.488968. [ Links ]
Kessel, P., & Glavitsch, H. (1986). Estimating the voltage stability of a power system. IEEE Trans. Power Deliv. Vol. 1, No. 3, 346-354. DOI: 10.1109/TPWRD.1986.4308013. [ Links ]
Klaric, M., Kuzle, I., & Tomisa, T. (2005). Simulation of undervoltage load shedding to prevent voltage collapse. IEEE Power Tech. St. Petersburg,1-6. DOI: 10.1109/ptc.2005.4524395. [ Links ]
Kundur, P. (1994). Power System Stability and Control. Toronto, McGraw-Hill Inc. 623 - 626. [ Links ]
Laghari, J. A., Mokhlis, H., Bakar, A.H.A., & Mohamad, H. (2013). Application of computational intelligence techniques for load shedding in power systems: a review. Energy Convers. Manage, No. 75, 130-140. DOI: 10.1016/j.enconman.2013.06.010. [ Links ]
Lerm A., & Silva, A. S. (2004). Avoiding hopf bifurcations in power systems via set-points tuning. IEEE Transactions on Power Systems, Vol. 19, No. 2, 1076-1084. DOI: 10.1109/TPWRS.2004.825827. [ Links ]
Mollah, K., Bahadornejad, M., Nair N.-K.C., & Ancell, G. (2012). Automatic under-voltage load shedding: a systematic review. IEEE Power and Energy Society General Meeting. July 22-26, 2012, pp. 1-7. DOI: 10.1109/pesgm.2012.6345547. [ Links ]
Mozina, C. J. Undervoltage load shedding. (2007). 60th Annual Conf on Protective Realy Engimeers. 16-34. DOI: 10.1109/CPRE.2007.359889. [ Links ]
Nguyen, T.T., & Wagh, S. R. (2009). Model Predictive Control of FACTS Devices for Power System Transient Stability. Transmission & Distribution Conference & Exposition: Asia and Pacific, Seoul.1- 4. DOI: 10.1109/td-asia.2009.5356944. [ Links ]
Niar, S., Abbas, A., Chifong, Y., Seabrook, J., Pereira, L., Kreipe, M., Mavis, S., & Green, T. (1999). Undervoltage load shedding guidelines. Western System Coordinating Council. [ Links ]
Pahwa, S., Scoglio, C., Das, S., & Schulz. Load-shedding strategies for preventing cascading failures in power grid. Electric Power Components and System. Vol. 41, No.9, 879-895. [ Links ]
Pérez, S., Rodríguez, L.F., & Olivar, G. (2014). A Simplified Voltage Stability Index (SVSI). Electrical Power & Energy Systems. Vol. 63, 2014, 806 - 813. DOI: 10.1016/j.ijepes.2014.06.044. [ Links ]
PSTCA, Power Systems Test Case Archive Retrieved (2015). http://www.ee.washington.edu/research/pstca/. [ Links ]
Quoe, T., Fandino, N., Hadjsaid, N., Sabonnadiere, J.C., & VU, H. (1994). Emergency load shedding to avoid rises of voltage instability using indicators. IEEE Trans. Power Syst. Vol. 9, No.1, 341-351. DOI: 10.1109/59.317592. [ Links ]
Shen, C.M., & Laughton, M.A. (1970). Power system load scheduling with security constraints using dual linear programming. Proceedings of IEEE, Vol. 117, 2117-2127. [ Links ]
Sonar, V. V., & Mehta, H. D. (2015). Load Shedding Optimization in Power System Using Swarm Intelligence-Based Optimization Techniques. Optimization. International Journal of Advance Research in Engineering, Science & Technology (IJAREST). Vol. 2, No. 5. [ Links ]
Tarafdar, M., & Galvani, S. (2011). Minimization of load shedding by sequential use of linear programming and particle swarm optimization. Turk J Elec Eng & Comp Sci. Vol.19, No.4, 551- 562. [ Links ]
Yesuratnam, G., & Thukaram, D. (2007.) Congestion management in open access based on relative electrical distances using voltage stability criteria. Electric Power System Res. Vol. 77, 1608-18. DOI: 10.1016/j.epsr.2006.11.007. [ Links ]
Zomaya, Y., and Olariu, S. (2006). Handbook of Bioinspired Algorithms and Applications. Taylor & Francis Group. [ Links ]

