Services on Demand
Journal
Article
 English (pdf)
 Article in xml format
 Article references
 Send this article by e-mail
Indicators
-
 Cited by SciELO
 -
 Access statistics
Related links
-
 Cited by Google
 -
 Similars in
SciELO
Similars in
SciELO -
 Similars in Google
Share

 Permalink
Ingeniería e Investigación
Print version ISSN 0120-5609
Ing. Investig. vol.36 no.2 Bogotá May/Aug. 2016
https://doi.org/10.15446/ing.investig.v36n2.56426
DOI: http://dx.doi.org/10.15446/ing.investig.v36n2.56426
Probability of correct reconstruction in compressive spectral imaging
Probabilidad de reconstrucción exitosa en el sensado compreso de imágenes espectrales
Samuel E. Pinilla1, Héctor M. Vargas2, and H. Arguello3
1 System Engineer, Masters in Math, Universidad Industrial de Santander, Colombia. Affiliation: Department of Computer Science, Universidad Industrial de Santander, Bucaramanga, Colombia. E-mail: samuel.pinilla@correo.uis.edu.co.
2 Electronic Engineer, Masters in System Engineering, Universidad Industrial de Santander, Colombia. Affiliation: Department of Computer Science, Universidad Industrial de Santander, Bucaramanga, Colombia. E-mail: hector.vargas@correo.uis.edu.co.
3 Electrical Engineer, Masters in Electrical Power, Universidad Industrial de Santander. Ph.D in Electrical and Computer Engineering, University of Delaware, USA. Affiliation: Department of Computer Science, Universidad Industrial de Santander, Bucaramanga, Colombia. E-mail: henarfu@uis.edu.co.
How to cite: Pinilla, E., Vargas, M., & Arguello, H. (2016). Probability of correct reconstruction in compressive spectral imaging. Ingeniería e Investigación, 36(2), 68 - 77. DOI: 10.15446/ing.investig.v36n2.56426.
ABSTRACT
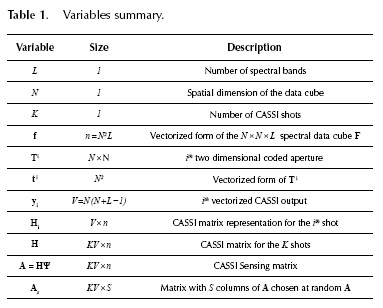
Coded Aperture Snapshot Spectral Imaging (CASSI) systems capture the 3-dimensional (3D) spatio-spectral information of a scene using a set of 2-dimensional (2D) random coded Focal Plane Array (FPA) measurements. A compressed sensing reconstruction algorithm is then used to recover the underlying spatio-spectral 3D data cube. The quality of the reconstructed spectral images depends exclusively on the CASSI sensing matrix, which is determined by the statistical structure of the coded apertures. The Restricted Isometry Property (RIP) of the CASSI sensing matrix is used to determine the probability of correct image reconstruction and provides guidelines for the minimum number of FPA measurement shots needed for image reconstruction. Further, the RIP can be used to determine the optimal structure of the coded projections in CASSI. This article describes the CASSI optical architecture and develops the RIP for the sensing matrix in this system. Simulations show the higher quality of spectral image reconstructions when the RIP property is satisfied. Simulations also illustrate the higher performance of the optimal structured projections in CASSI.
Keywords: Restricted Isometry Property, RIP, CASSI, compressive sensing, spectral imaging, coded aperture.
RESUMEN
El sistema de adquisición de imágenes espectrales de única captura basado en apertura codificada (CASSI), capta información tridimensional (3D) espacio-espectral de una escena, usando un conjunto de medidas bidimensionales (2D) proyectadas en un FPA (Focal Plane Array). Para recuperar el cubo de datos a partir de las proyecciones en el FPA, se usa un algoritmo de reconstrucción basado en la teoría de muestreo compresivo. En CASSI la calidad de la reconstrucción de imágenes espectrales depende exclusivamente de la matriz de sensado, que es determinada por la estructura estadística del código de apertura. La propiedad restringida isométrica (RIP) de la matriz de sensado CASSI es usada para determinar la probabilidad de una correcta reconstrucción de la imagen. Este artículo describe la arquitectura óptima CASSI y desarrolla la RIP para las matrices de muestreo, para la captura de la información del cubo de datos. En efecto, la RIP provee la guía para determinar el mínimo número de capturas FPA necesarias para la reconstrucción de una imagen. Más adelante, la RIP es usada para encontrar la estructura óptima de las proyecciones de los códigos de apertura de CASSI. Las simulaciones muestran alta calidad de la reconstrucción obtenida de las imágenes espectrales cuando se satisface la condición impuesta por la RIP. También muestran el más alto rendimiento obtenido de las estructuras óptimas de las proyecciones CASSI.
Palabras clave: Propiedad Isométrica Restrictiva, RIP, CASSI, muestreo compresivo, imágenes hiperespectrales, códigos de apertura.
Received: April 23rd 2016 Accepted: July 18th 2016
Introduction
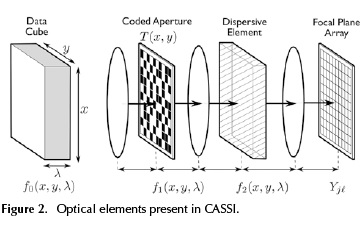
Imaging spectroscopy requires sensing a large amount of spatial information across a multitude of wavelengths. The sensed signals are titled multispectral or hyperspectral images. Traditional imaging spectroscopy sensing techniques scan adjacent zones of the underlying spectral scene and merge the results to construct a spectral 3-Dimensional (3D) data cube. Push broom spectral imaging sensors, for instance, capture a spectral data cube with one FPA measurement per spatial line of the scene (Gehm et a/., 2008). Spectrometers based on optical band-pass filters spectrally scan the source data cube (Gupta, 2008). These sensing techniques obey the well-known Nyquist criterion, which imposes a severe limit on the number of samples needed. More specifically, these methods require scanning a number of zones linearly in proportion to the desired spatial or spectral resolution. As the desired resolution increases, the required number of samples grows considerably, such that the cost of sensing a hyperspectral image is extremely high. Recently, with a mathematical technique for reconstructing sparse signals, called Compressive Sensing (CS), one can use fewer samples much lesser then predicted by the Nyquist criterion. This new technique involves diverse mathematical areas such as numerical optimization, signal processing, random matrix analysis, and statistics. The enormous potential of CS has been recently applied in areas such as microscopy, holography, tomography and spectroscopy (Arce et a/., 2014; Brady et a/., 2009; Studer et al., 2012; Wagadarikar et a/., 2008; Yu and Wang, 2009). CS allows sensing a signal with a fewer number of samples than that required by the Nyquist criterion. Thus, CS has allowed overcoming a diverse number of physical sensing limits. This paper focuses on the application of CS in spectral imaging which is coined Compressive Spectral Imaging (CSI). CSI senses 2D coded random projections of the underlying scene, such that the number of required projections is far less than the linear scanning case. The Coded Aperture Snapshot Spectral Imaging (CASSI) system is an imaging architecture that effectively implements CSI. Thus, CASSI senses the 3D spectral information of a scene using 2D random projections. Figure 1 illustrates the CASSI optical architecture. The main components in CASSI are the coded aperture, the prism and the Focal Plane Array (FPA). The coded aperture patterns are the only varying elements in CASSI, the other optical elements remain fixed during the operation of the instrument.
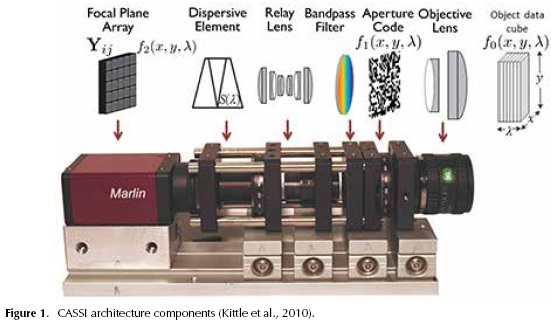
Figure 2 shows the main components of the CASSI architecture. In CASSI, the coding is applied to the image source density f0(x, y, λ,) by the coded aperture T(x, y), where (x, y) are the spatial coordinates. The resulting coded density f1(x,y, λ,) = T(x,y) f0(x,y, λ,) is spectrally dispersed by a dispersive element before it impinges in the focal plane array (FPA), resulting in the coded field

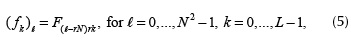
where T(x, y) is the transmission function representing the coded aperture, h(x - S(λ) - x, y' - y) is the optical impulse response of the system, and S(λ) is the dispersion induced by the prism. A linear dispersion by the prism is assumed. The compressive measurements across the FPA are obtained by the integration of the field f2(x,y,λ) over the detector spectral range. The discretized FPA measurements can be thus modeled as
where L is the number of spectral bands sensed, af = floor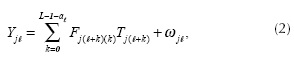
 is the intensity measured at the (j,
 ) position of the FPA with
  is the discretized data cube,
  is the discretized coded aperture with two-dimensional structure, and (ωjt is the noise system.
 The single-shot CASSI system has been extended to a multi-shot system architecture such that multi-frame coded measurements are acquired as separate FPA measurements, each with a distinct coded-aperture pattern (Kittle et a/., 2010).
Equation (2) can be written in matrix form as y = Hf+ω, where y is the measurements vector, H is the matrix that represents the coded apertures and prism effect and f is the vectorized spectral data cube. Given the compressive measurements y, the objective of CS is to recover the signal f. Compressive Sensing (CS) dictates that an n-long signal f can be recovered from m « n random projections y = H Ψ θ. Moreover, if it defines the m x n matrix A = Hψ as the sensing matrix, then the spectral data cube f = Ψθ is sparse in the base Ψ. The RIP in CASSI is thus fundamental to determine both the minimum number of shots needed for correct reconstruction and for the design and optimization of the coded aperture patterns (Wagadarikar, 2010). CS structured random matrices have been extensively analyzed for Toeplitz, random partial Fourier, and partial circulant matrices (Fornaiser, 2010). Recently a generalization of structurally random matrices has been developed (Do et a/., 2012). The RIP in CASSI was first considered in Wagadarikar (2010), where it is assumed that the RIP in CASSI is satisfied. The work in Wagadarikar (2010) then derives conditions on the coded apertures so that the RIP is better satisfied. These results, however, do not develop the explicit parameters for the bounds needed in the RIP, such as the probability of error, or the minimum number of FPA measurements. In this paper the RIP in CASSI is derived, the structure of the CASSI sensing matrix is formulated, and the RIP constants are expressed as a function of the structure of the random coded aperture patterns. A minimum number of random projections are needed so as to satisfy the RIP of the sensing matrix A (Candes and Tao, 2005). This paper establishes the theoretical probability of correct recovering in CSI. The results of this work can be used in the optimization of coded aperture patterns and to estimate a bound for the minimum number of shots needed for correct reconstruction.
CASSI Sensing Matrix
The goal in this section is to present the discrete model of the optical process in CASSI system in matrix form. Moreover, using this model allows carrying out the RIP analysis on the CASSI sensing matrix. The discretized output at the detector corresponding to the ith coded aperture 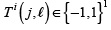 is given by
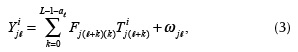
for i = 1,...,K, where  is the intensity at the
  position at the detector, whose dimensions are N x N+L -1, F represents an N x N x L spectral data cube and ωj is the white noise of the sensing system. In this work, the entries of the coded aperture are limited to
  . The varying terms in Equation (3), indexed by i are: first, the discrete coded apertures T1 or its vector representation t 1 whose entries are realizations of a Bernoulli random variable with parameter
  and second, the number of shots K. (See Appendix A).
The ith FPA measurement i can be written in matrix notation as
where  is a V-long vector representation of the measurement
  . in Equation (3), where
  represents the coded aperture and the dispersive element where n = N2L,
  is the vector representation of the data cube F, and ω is the noise of the system. More specifically, the entries of fk can be expressed as
where 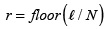 . The vectorization of the code aperture T i is defined as
where . Similarly, the vectorization of the output Y i is defined as
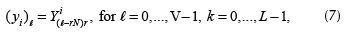
where . Using the above matrix representation, the output yt can be expressed as
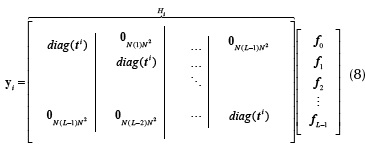
where diag(ti) is an N2x N2 diagonal matrix whose entries are the elements of the vectorized coded aperture ti,  zero-valued matrices, respectively.
The matrix Hi can be expressed as (Arguello and Arce, 2012)
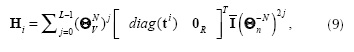
where 0R is a N2 x N(L- 1) zero-valued matrix, the structure of the Vx V permutation matrix Θv is
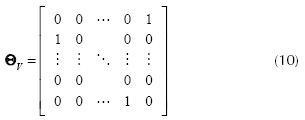
The n x n matrix Θn has the same structure of Θv in Equation (10) and  where I is an N2 x N2 identity matrix,
  are N- times the usual matricial product, and 0 is a N2 x N2(L - 1) zero valued matrix.
The ensemble of CASSI outputs  can be rewritten as
where the CASSI sensing matrix is A = HΨ, the matrix  , and θ is a sparse representation of f in the base Ψ. Notice that
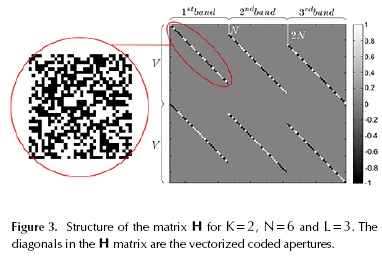
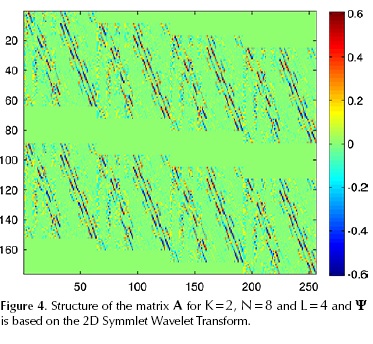
  where m = KV, and m ≤ n. Figure 3 and Figure 4 depict an example of the matrices H and A respectively for small values of N, L, and K. In practice, the dimensions of these matrices are much larger (Arguello and Arce, 2011). Figure 4 uses
  where Ψ2D is the 2D Symmlet Wavelet Transform.
Given the measurements y, the signal f is estimated by solving
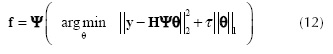
where τ is the regularization constant. Several algorithms have been developed to solve this l2 - l1} optimization. In this paper the Gradient Projection for Sparse Reconstruction (GPSR) algorithm is used (Figueiredo et al., 2007).
The RIP in CASSI
The sth restricted isometry property (RIP) δs =δs (A) of the matrix  is defined as the smallest δ such that
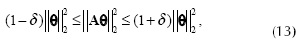
for all s-sparse vectors Θ. Notice that equivalently Equation(13) is given by
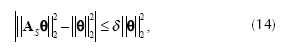
for all S ⊂ {1,...,n} , }S} = card (S) ≤ s and all Θ ∈  and As is a m x S matrix whose columns are equal to S columns of the matrix A. We then observe that, for Θ ∈
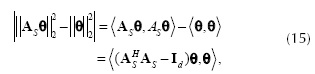
where ASH H is the conjugate transpose of As and Id ∈ℝSxS is the identity matrix. Since the matrix ASTAS-Id is Hermitian, we have from the Equation (15)
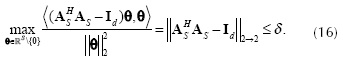
Thus, from the definition of the RIP in Equation (13) and Equation (16) we have that the constant δs is given by
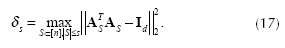
Defining the matrix ATT = AS TAS, Equation (17) can be rewritten as
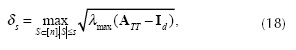
where λmax (·) denotes the largest eigenvalue (Fornaiser, 2010). A small value of δS in Equation (18) for a large value of S indicates that the RIP condition is satisfied. The RIP condition implies a stable recovery of the signal Θ from the projections AΘ using a l1 optimization algorithm (Fornaiser, 2010). Let the entries of Ψ be Ψj,k, then using the structure of the matrices Hi in Equation (9), the entries of AS can be written as
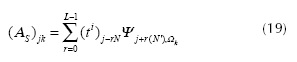
for j = 0,...,m-1 , k = 0,...,S -1, where i = f loor ( j /V ), N' = N2 - N , and Ωk ∈{0,...,n-1} . Using Equation (19), the entries of ATT are denoted as (ATT)jk which are expressed as
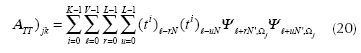
for j=0, ..., S-1 and j ? k. When j=k then (ATT)jk = K. Without loss of generality, we analyze the case when Ψ = diag (Ψ2D, ... , Ψ2D) and Ψ 2D is the 2D Symmlet Wavelet Transform. Given that Ψ is a block diagonal matrix, the sums over u and r in Equation (20) have only one nonzero element, then Equation (20) can be expressed as
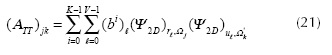
where 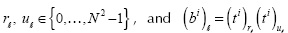 are realizations of a Bernoulli random variable with parameter p* = p2 + (1- p)2 . Notice that
 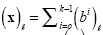 is a Binomial random variable. More specifically, (x)ℓ -- B (K, p*). Notice also that
 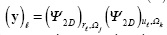 with Ωj and Ωk varying randomly, it can be considered a random variable with E ((y)ℓ) = 0. Then, Equation (21) can be rewritten as
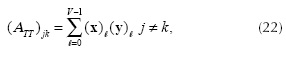
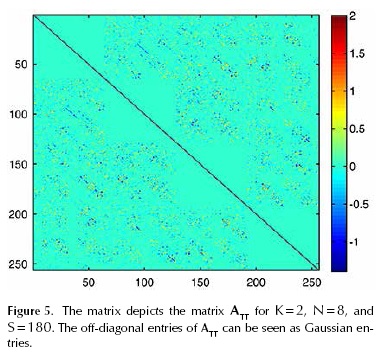
and (ATT )jk = K for j = k. Because (ATT)jk for j ? k is the sum of i.i.d zero mean random variables, and applying the central limit theorem when V → ∞ , then (ATT)jk → N (0,σ2) where σ2 = V Var ((x)ℓ (y)ℓ). A demonstration of the applicability of the central limit theorem in Equation (22) can be found in Do et al. (2012). Figure 5 depicts the matrix ATT for k = 2, N = 8, and S = 180. It can be seen in this figure that the matrix ATT is dense and its entries can be seen as a Gaussian random variable. Given that x and y in Equation (22) are independent random variables then Vxy = Var((x)ℓ (y)ℓ) can be estimated as
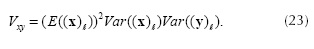
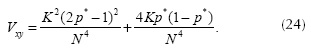
Since (x)ℓ is a Binomial random variable, then Var((x)ℓ)= 4Kp* (1- p*) and (E((x)))= K(2p* -1). Given the specific structure of Ψ2D, the variance Var ((y)ℓ)= 1/N4. The variance Vxy in Equation (23) can be rewritten as
Given that the entries of the matrices ATT are Gaussian, then it is possible to apply the concentration inequalities developed by Ledoux to calculate the distribution of λmax in Equation (17) (Candes and Tao, 2005; Ledoux, 2001). More specifically, for each fixed t > 0 the concentration inequality is given by
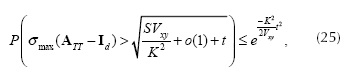
where σmax indicates the maximum singular value and o(1) is a small term tending to zero as K → ∞ which can be estimated as 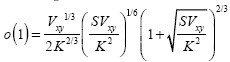 Using Equation (25) and following a similar approach as that of Candes in (Candes and Tao, 2005), the RIP in CASSI can be written as
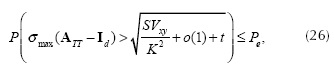
where 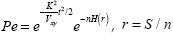 and
and 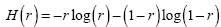 . Using Equation (26), the constant δs is found as
 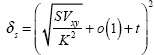 .
.
Simulations
In order to verify the RIP in CASSI in Equation (26), an algorithm is proposed based on Monte Carlo Uniform Sampling. Also, two spectral data cubes are used to simulate the CASSI real system reconstructions. All experiments have been carried out in Matlab 2010b on a 3GHz Intel Core i7 and 32GB memory desktop computer.
To estimate numerically the restricted isometry constant δs of order S from matrix A, Monte Carlo simulations are computed by sampling the sub-matrices (ATS AS- Id) from Equation (17).
An important parameter of the CASSI system is the transmittance of the coded apertures. Algorithm 1 was developed in order to determine the relationship between the transmittance of the coded apertures and the RIP constant δs. The objective of this section is to determine the transmittance that provides the best value of the constant δs.
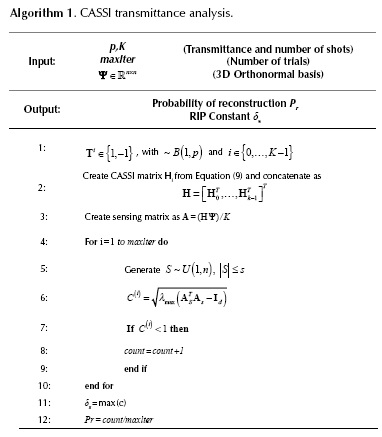
The steps 1-3 in Algorithm 1 are used to construct the CASSI sensing matrix with parameters p and K. The coded apertures Ti for i ∈{0,...,K -1} are N x N symmetric matrices whose entries {1,-1} follow a Bernoulli distribution with probability p. The CASSI Sensing matrix A is formed by multiplying the CASSI matrix H with the sparsity basis Ψ. Subsequently, an iterative method is implemented to find the maximum eigenvalue of the possible sub-matrices (AST As - Id).
The number of iterations in Algorithm 1 is defined as maxlter=n!/(n-s) !s!. Since the number of all possible combinations of the sub-matrices is very large, the constant RIP δs can be determined using Monte Carlo simulations. Therefore the index subspace S is sampled by using a uniform distribution (step 5) with size |S| ≤ s. The eigenvalues in all experiments are stored in the vector C. Finally, the probability of correct reconstruction is calculated from probability distribution of C by determining the number of eigenvalues smaller than 1. In this work, the parameters used in Algorithm 1 were N = 16, L = 8 , maxlter = 1 000 000 and Ψ = Ψ2D⊗ IL, where Ψ2D ∈ℝN2 x N2 is the 2D-Wavelet Symmlet 8 basis and ℝL2 x L2 is the identity matrix.
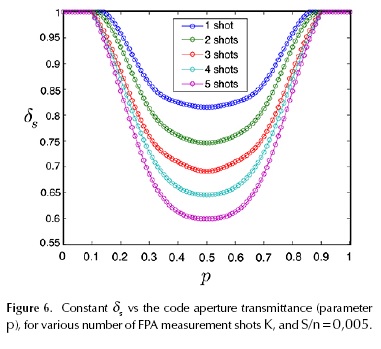
Figure 6 shows the variation of δs for different number of shots K, p, transmittances and S/n = 0,005. The constant δs is minimum for P {(t )ℓ = l} = p = 0,5, or equivalently when the transmittance of the code apertures is 50 %. Notice that a value of δs = 1 indicates that reconstruction is not possible.
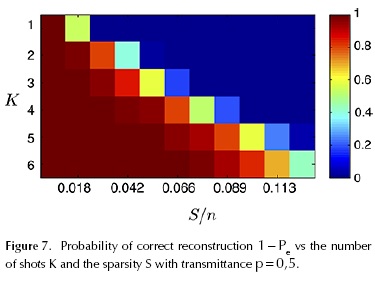
Similar performance is obtained for other values of S/n. The probability of reconstruction 1 -Pe (see Equation (26)) is also compared to the results provided by a set of Monte-Carlo simulations. The results are shown in Figure 7, where a high probability depends on small sparsity and a higher number of shots.
Experiments with real data
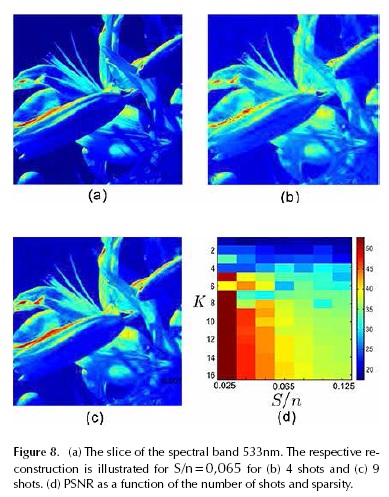
In this section, the performance of CASSI sensing matrix is evaluated in the reconstruction of three spectral images (Foster et al., 2006). An example of the first database of 533 nm is shown in Figure 8a. This is a natural scene with 256 x 256 pixels of spatial resolution and L = 33 spectral bands ranging from 400 nm to 720 nm. An example of the second spectral database at 533 nm is shown in Figure 9a. The second spectral image is a city scene with 256 x 256 pixels of spatial resolution and L = 33 spectral bands ranging from 400 nm to 720 nm. The third database is a color scene with 256 * 256 pixels of spatial resolution and L = 31 spectral bands ranging from 400 nm to 700 nm at 10 nm steps. In In Figure 10a, an example is shown where the spectral band selected is 500 nm. For all the databases, the reconstruction is compared for different sparsity values using Bernoulli distributed coded apertures in CASSI with transmittance 50 %.
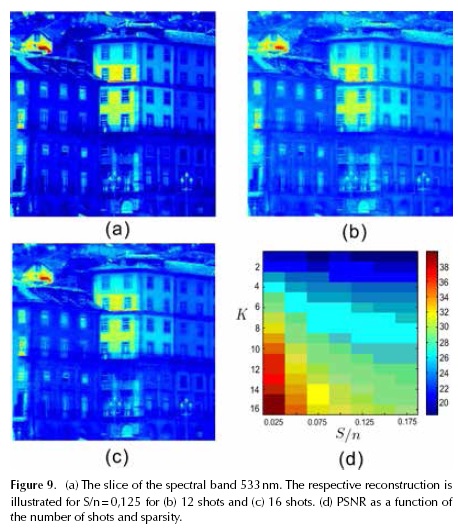
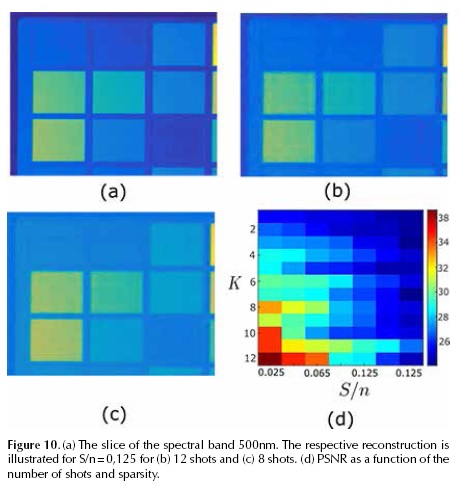
The reconstruction is realized using the GPSR algorithm (Figueiredo et al., 2007). The base representation Ψ = diag(Ψ2D,..., Ψ2D) where Ψ2D is the 2D-Wavelet Symmlet 8 basis. The data cube F was approximate for different values of the sparsity S/n by removing the n - S less significant coefficients in magnitude from the sparse representation Θ. The performance of matrices is analyzed under different sparsity levels. Figure 8d, Figure 9d and Figure10d indicate the performance (PSNR) analysis as a function of the sparsity and number of shots.
The results of 100 reconstructions experiments given K and S/n are condensed in Figure 8d and Figure 9d (with S/n = 0,065 in the first image and S/n = 0,125 in the second and third images), where the PSNR of the reconstruction images verifies that the performance (PSNR) increases as the sparsity and the number of shots K increases.
Minimum number of shots for reconstruction
While the Nyquist Shannon sampling theorem states that a certain minimum number of samples is required for sampling the spectral data cube, compressive sensing can reduce the number of measurements that need to be stored by the prior knowledge that spectral signal is sparse in a known basis and that sensing matrix satisfied the RIP. Figure 8d, Figure 9d and Figure 10d indicate the respective RIP constant 3 for correct reconstruction. The results indicate s clearly that there are a minimum number of shots for correct reconstruction as a function of the sparsity for a noiseless case. The reconstruction of the band depicted in Figure 8a is shown in Figure 8b and Figure 8c for 4 and 9 shots respectively. Figure 8b illustrates the effect of using a number of shots less than that established by the RIP where the PSNR was 25 dBs with sparsity S/n = 0,065. For Figure 8c the PSNR was 31 dBs with sparsity S/n = 0,065. Notice that the number of shots used in Figure 8c is higher than the minimum recommended in Figure 8d. The number of shots used in Figure 8d is similar than the minimum recommended in Figure10d. The artifacts in the reconstructed image in Figure 8b, Figure 9b and Figure10c, with low PSNR, are clearly noticeable. On the contrary, Figures 8c, 9c and 10b show high quality in the reconstructed image. For Figure 10b and 10c the reconstruction performance are 28 and 24 dBs respectively, for the given number of shots 12 and 8.
Conclusions
The structured CASSI sensing matrix has been formulated and its RIP has been demonstrated. Simulations verified the theoretical RIP CASSI bounds. For optimal reconstruction, the coded aperture patterns must be designed with p = 0,5 or equivalent with a transmittance of fifty percent. Given a sparsity condition for signal representation, the minimum number of shots for reconstruction is determined by the variance of the representation basis and the variance of the random structure of the code apertures. An algorithm based on Monte Carlo simulations was developed to determine the optimal transmittance of the coded apertures. The experiments indicate the influence of the sparsity level and the number of shots in the performance of the system.
References
Arce, G. R., Brady, D. J., Carin, L., Arguello, H., & Kittle, D. S. (2014). Compressive coded aperture spectral imaging: An introduction. Signa/ Processing Magazine, Vol 31. IEEE 105-115. IEEE. DOI: 10.1109/MSP.2013.2278763. [ Links ]
Arguello, H., & Arce, G. (2012). Spectrally Selective Compressive Imaging by Matrix System Analysis, Proc. Imaging and Applied Optics Congress. Monterey, California. DOI: 10.1364/COSI.2012.CM4B.5. [ Links ]
Arguello, H., & Arce, G. R. (2011). Code aperture optimization for spectrally agile compressive imaging. J. Opt. Soc. Am, Vol 28. A 2400-2413. DOI: 10.1364/josaa.28.002400. [ Links ]
Brady, D. J., Choi, K., Marks, D. L., Horisaki, R., & Lim, S. (2009). Compressive holography. Optics express, Vol 17. 13040-13049. Optical Society of America. DOI: 10.1364/OE.17.013040. [ Links ]
Candes, E., & Tao, T. (2005). Decoding by linear programming, Information Theory. IEEE Transaction, Vol 51. 4203-4215. [ Links ]
Correa-Pugliese, C. (2013). Lapped-windowed reconstructions in compressive spectral imaging. University of Delaware. [ Links ]
Diaz, N., Rueda, H., & Arguello, H. (2015). High-dynamic range compressive spectral imaging by grayscale coded aperture adaptive filtering. Ingeniería E Investigación, Vol 35(3). 53-60. DOI: 10.15446/ing.investig.v35n3.49868. [ Links ]
Do, T. T., Gan, L., Nguyen, N., & Tran, T. (2012). Fast an Efficient Compressive Sensing Using Structurally Random Matrices, Signal Processing. Vol 60. IEEE Transaction on 139-154. [ Links ]
Figueiredo, M., Nowak, R., & Wright, S. (2007). Gradient projection for sparse reconstruction: Application to compressed sensing and other inverse problems. IEEE J. of Selected Topics in Signal Processing, Vol 1. 586-597. DOI: 10.1109/jstsp.2007.910281. [ Links ]
Fornaiser, M. (2010). Theoretical Foundations and Numerical Methods for Sparse Recovery. (M. Fornaiser, Ed.) De Gruyter. DOI: 10.1515/97831 10226157. [ Links ]
Foster, D. H., Amano, K., Nascimento, S. M. C., & Foster, M. (2006). J. Frequency of metamerism in natural scenes, Journal of The Optical Society of America A-optics Image Science and Vision. Vol 23. 2359-2372. DOI: 10.1364/JOSAA.23.002359. [ Links ]
Gehm, M. E., Kim, M. S., Fernandez, C., & Brady, D. J. (2008). High-throughput, multiplexed pushbroom hyperspectral microscopy. Optics Express, Vol 16. DOI: 10.1364/OE.16.011032. [ Links ]
Gupta, N. (2008). Acousto-optic tunable filter based spectro-polarimetric imagers. DOI: 10.1 1 17/12.782800. [ Links ]
Kittle, D., Choi, K., Wagadarikar, A. A., & Brady, D. J. (2010). Multiframe Image Estimation for Coded Aperture Snapshot Spectral Imagers. Appl. Opt, Vol 49. 6824-6833. DOI: 10.1364/AO.49.006824. [ Links ]
Kittle, D., Choi, K., Wagadarikar, A., & Brady, D. J. (2010). Multiframe image estimation for coded aperture snapshot spectral imagers. Applied optics, Vol 49. 6824-6833. OSA. DOI: 10.1364/AO.49.006824. [ Links ]
Ledoux, M. (2001). The concentration of measure phenomenon. American Mathematical Society. [ Links ]
Studer, V., Bobin, J., Chahid, M., Mousavi, H. S., Candes, E., & Dahan, M. (2012). Compressive fluorescence microscopy for biological and hyperspectral imaging. Proceedings of the National Academy of Sciences, Vol 109. E1679-E1687. National Acad Sciences. DOI: 10.1073/pnas.1119511109. [ Links ]
Oiknine, Y., August, Y., & Stern, A. (2014). Reconstruction algorithms for compressive hyperspectral imaging systems with separable spatial and spectral operators. In SPIE Optical Engineering Applications (p. 921-703). [ Links ]
Wagadarikar, A. A. (2010). Compressive Spectra/ and Coherence Imaging. [ Links ]
Wagadarikar, A. A., John, R., Willett, R., & Brady, D. (2008). Single disperser design for coded aperture snapshot spectral imaging. Appl. Opt, Vol 47. B44-B51. DOI: 10.1364/AO.47.000B44. [ Links ]
Yu, H., & Wang, G. (2009). Compressed sensing based interior tomography. Physics in medicine and biology, Vol 54. 27-91. IOP Publishing. DOI: 10.1088/0031-9155/54/9/014. [ Links ]
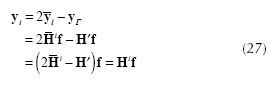
Let Γ be a coded aperture such that (Fjt) = 1 for all j,ℓ . Suppose that yΓ is the FPA measurement when the aperture Γ is used, H' be the CASSI matrix associated to the coded Γ and thus yr = H'f . Let y =  be the CASSI output when the coded aperture Ti (j,ℓ) ∈{0,1} is used. Define the FPA measurement yi as where it can be noticed that
  . Thus, the binary coded apertures can be implemented by subtracting the reference signal yΓ from boolean output 2
 . Notice that this type of coded aperture cannot be implemented directly. That means that the implementation of these coded apertures requires one additional FPA CASSI measurement and the noise in the emulated measurements y is 5 times higher than the noise in the original measurements 2.