


Services on Demand
Journal
Article
 English (pdf)
 Article in xml format
 Article references
 Send this article by e-mail
Indicators
-
 Cited by SciELO
 -
 Access statistics
Related links
-
 Cited by Google
 -
 Similars in
SciELO
Similars in
SciELO -
 Similars in Google
Share

 Permalink
Ingeniería e Investigación
Print version ISSN 0120-5609
Ing. Investig. vol.36 no.3 Bogotá Sep./Dec. 2016
https://doi.org/10.15446/ing.investig.v36n3.56091
DOI: http://dx.doi.org/10.15446/ing.investig.v36n3.56091
Impact of human resources on wine supply chain flexibility, quality, and economic performance
Impacto de los recursos humanos en la flexibilidad, calidad y desempeño económico de la cadena de suministro del vino
J. L. García-Alcaraz1, W. Adarme-Jaimes2, and J. Blanco-Fernández3
1 Industrial Engineering Sciences Ph.D, Technological Institute of Ciudad Juarez, México. Affiliation: Universidad Autónoma de Ciudad Juárez, Mexico. E-mail: jorge.garcia@uacj.mx
2 Industrial Engineer Ph.D, National University of Colombia - Campus Medellin, Colombia. Affiliation: National University of Colombia - Campus Bogota. Email: wadarme@unal.edu.co
3 Industrial Engineer Ph.D, University of Zaragoza, Spain. Affiliation: University of La Rioja, Spain. Email: julio.blanco@unirioja.es
How to cite: García-Alcaraz, J. L., Adarme-Jaimes, W., & Blanco-Fernández, J. (2016). Impact of human resources on wine supply chain flexibility, quality, and economic performance. Ingeniería e Investigation, 36(3), 74-81 DOI: 10.15446/ing.investig.v36n3.56091
ABSTRACT
This article assesses the impact of human resources skills on production quality, flexibility, and economic performance of La Rioja's wine supply chain. These four elements were integrated as latent variables composed of 15 observed variables and associated through six hypotheses. Data were gathered from 64 wineries located in La Rioja, Spain, and hypotheses were validated in a structural equation model using WarpPLS v.5 software. Results indicate that human resources skills have a positive direct impact on SC flexibility and quality, but not on economic performance; however, these variables are indirectly associated through SC quality and SC flexibility.
Keywords: Supply chain, flexibility, quality, economic performance, structural equation model, human resources.
RESUMEN
El objetivo de este artículo es analizar el impacto de las habilidades de los recursos humanos en la calidad obtenida en el proceso de producción, la flexibilidad y el desempeño económico de la cadena de suministro del vino en La Rioja (España). Estos elementos fueron analizados como variables latentes, en las que se integraron 15 variables observadas. Asimismo, seis hipótesis fueron planteadas para relacionar estas variables en un modelo de ecuaciones estructurales, y fueron probadas usando mínimos cuadrados parciales en el software WarpPLS v.5. Los datos fueron obtenidos de 64 empresas vitivinícolas ubicadas en La Rioja, España. Los resultados indicaron que las capacidades de los recursos humanos tienen un impacto directo y positivo en la flexibilidad y la calidad de la cadena de suministro, pero no en el desempeño económico de la misma; sin embargo, el efecto indirecto es obtenido a través de la calidad y la flexibilidad.
Palabras clave: Cadena de suministro, flexibilidad, calidad, desempeño económico, modelo de ecuaciones estructurales, recursos humanos.
Received: March 3rd 2016 Accepted: November 16th 2016
Introduction
A supply chain (SC) is defined as a set of integrated suppliers, producers, and distributors who join forces to succeed in producing a product or service, while ensuring flow of information, materials and financial resources among them (Brusset, 2016).
The food supply chain has been the focus of much attention due to quality control standards and care parameters required to ensure safe food consumption (Bruzzone et al., 2014). Moreover, since some food products are quickly perishable, delivery times are critical and require specialized cooling systems. In this sense, some authors have named these particular supply chains as cold supply chains (Shabani et al., 2012).
The wine SC is one of the most studied SC due to its fragility, since wine production, transport, and storage require specific humidity, temperature, and illumination conditions (Ahumada et al., 2012). In this sense, La Rioja's wine industry is one of the most important, as its SC has academic and industrial relevance. To contribute to the study of La Rioja's wine supply chain, this paper presents a structural equation model that integrates four latent variables: human resources, SC flexibility, production quality, and SC economic performance in La Rioja's wine industry. To ensure understanding of this article, we start by providing a brief description of La Rioja's wine industry.
Wine in La Rioja: Statistics
Wine is one of the main agricultural products in La Rioja. Denomination of Origin Rioja for wine is managed by the Regulatory Board (RB), a government agency responsible for controlling wine production quality and for disseminating relevant statistics on La Rioja's wine production. According to the 2013 RB annual report, the vineyard surface available for wine production in La Rioja reached 62 153 [ha], while sales increased up to 277 million liters (355 million bottles), including 250,7 million liters of red wine. Also, domestic market of Rioja wine that year accounted for 63,1 % of total wine sales, whereas 36,9 % of wine production is exported, mainly to the United States and the European Union.
Also, Rioja wine is mainly distributed through two channels: food and hospitality, the latter representing 77 % of domestic sales in oak barrels. Finally, in 2013 Rioja wine SC accounted for 225 grape growers, 37 wholesalers and 28 cooperatives. Such data demonstrate the economic impact of the wine industry in the Autonomous Community of La Rioja.
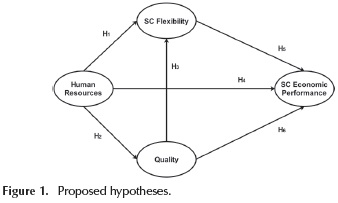
To guarantee high quality wine production, wineries must ensure a skilled labor workforce, capable of providing appropriate product features and SC flexibility, as these elements are key to meeting specific customer needs and generate profits. To measure effects among these elements in Rioja wine SC, we proposed a structural equation model that integrates and associates four latent variables: Human Resources, SC Flexibility, Quality, and SC Economic Performance. Since we assumed that human resources are the most important latent variable and affect all subsequent variables, we placed it on the top left corner of the model.
Human reources in supply chain
In many modern companies, human resources are the most valuable assets, as they provide necessary knowledge to transform raw materials into finished products. As a result of their impact on SC performance, human resources have paved the path for a special investigation line in the industrial sector (Alfalla-Luque et al., 2015), also followed by SC research (Gil et al., 2015).
Wine production requires enologists and wine production experts with customized approaches that can differentiate a brand and give it prestige. Therefore, education and skills from human resources play a key role in the economic success of wineries (Gultek et al., 2006), thereby giving reputation to an entire region that can be later exploited for touristic purposes (Byrd et al., 2016). Also, managerial commitment is fundamental for increasing SC performance, since managers set the example (Martínez-Jurado & Moyano-Fuentes, 2014) and must provide all necessary resources (Luthra et al., 2016).
Wine's supply chain flexibility
SC flexibility is defined as the ability to make production changes as response to new and changing customer needs, and it is often associated with uncertainty (Wallace & Choi, 2011). In this sense, SC flexibility must be supported through short and quick changeovers and setups and flexible work schedules, because distillation and fermentation systems function all day long and require continuous supervision. Employees must develop multitasking capabilities that enable the production process to adapt to demand uncertainty (Moon et al., 2012). Flexibility must be extended to suppliers as well, as in-full and on-time deliveries of quality raw materials (Kumar & Rahman, 2016) are also important.
Considering that SC flexibility depends on human resources' capabilities, we propose the first working hypothesis as follows:
H1. In a wine SC environment, Human Resources have a direct pos-itive impact on SC Flexibility.
Quality in the supply chain
Traditionally, customers measure product quality through in-full and on-time deliveries and according to the company's ability to comply with certain product characteristics (Willersinn et al., 2015). For this reason, wineries and any other food SC must strive to provide quality products and meet established standards (Trienekens et al., 2014). If a production lot does not meet those standards, the corporate image will be compromised, customers may reject the product, or governmental regulations may ban the production (Staricco & Ponte, 2015).
Product quality is obtained from every production task performed by skilled administrative and operational staff. Operators must be able to meet desired wine characteristics through their active involvement in the production process, while experienced managers ought to support this process (Badea et al., 2015; Shinbaum et al., 2016). Therefore, appropriate and sufficient human resources training supports production process quality (Gil et al., 2016). From such arguments, we can propose the second working hypothesis as follows:
H2. In a wine SC environment, Human Resources have a positive direct impact on Quality.
Flexible and agile companies can easily respond to customer needs by making complete and timely deliveries and increasing customer satisfaction. However, food companies that do not meet appropriate quality standards must not commercialize their products, as they may represent huge health risks (Aung & Chang, 2014) and can compromise their SCs (Gligor et al., 2015). Considering these arguments, the third working hypothesis states as follows:
H3. In a wine SC environment, SC Flexibility has a direct and positive impact on Quality.
Economic benefits in a supply chain
SC integration and alignment with corporate goals and investors are important for ensuring economic benefits (Elgazzar et al., 2012). However, financial performance can have additional sources. The most important of all may be intellectual capital, since human resources possess the necessary knowledge to add value to raw materials and transform them into desired products (Perez-Franco et al., 2016). From this perspective, wineries with highly trained staff can successfully assure their place in the market and increase intra-organizational integration by having a skilled workforce (Zhao et al., 2015). Considering such arguments, we propose the fourth working hypothesis as follows:
H4. In a wine SC environment, Human Resources have a direct positive impact on Economic Performance.
The second source of economic benefits is SC flexibility. In an era of rapidly changing trends, customers can unexpectedly change their minds, and companies must respond swiftly to such market fluctuations and uncertainty (Gligor et al., 2015). Flexibility can thus be reached by delivering products on time (Barad, 2012), changing production volume levels, making product modifications, or by implementing different layouts (Karakaya & Bakal, 2013). In such a globalized world, companies that cannot respond to customers in a rapid way may not obtain the expected benefits. Considering thus the impact of SC flexibility on economic performance, we propose the fifth working hypothesis as follows:
H5. In a wine SC environment, Flexibility has a positive direct effect on Economic Performance.
Well-known wineries are known for their quality wine, and such a prestige increases sales and thus maximizes profits (Sáenz-Navajas et al., 2016). Moreover, wine as a product for human consumption must meet the highest quality standards, otherwise it may be rejected or the company may be sanctioned (Staricco & Ponte, 2015). For this reason, we propose the sixth working hypothesis as follows.
H6. In a wine SC environment, production Quality has a positive direct effect on Economic Performance.
Figure 1 illustrates the relationships between latent variables, defined by the six hypotheses previously discussed.
Methodology
Stage 1: Survey development
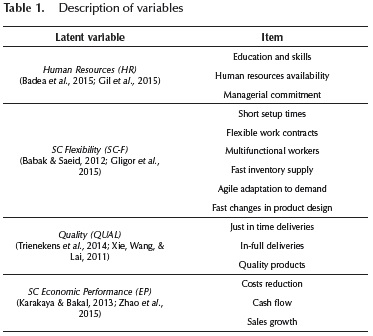
As a data collection instrument, we designed a two-section questionnaire based on the literature review. The first section assessed the four latent variables and their items as shown in Table I. The second section collected demographic information.
The questionnaire was answered using a five-point Likert scale, where the lowest value (1) indicated that an activity was never performed or a benefit was never gained. On the other hand, the highest value (5) indicated that an activity was always executed or a benefit was always obtained.
Stage 2: Survey application
To collect data, we stratified the sample by focusing on wineries belonging only to Rioja Denomination of Origin (225 wine growers). Then, we conducted face-to-face interviews with managers that responded to our emails or calls and scheduled an appointment.
Stage 3. Data capture and questionnaire validation
Data were captured and analyzed using statistical software SPSS 21®. Then, data were screened to detect missing values and outliers, which were replaced by the median value of items (Cenfetelli & Bassellier, 2009). Afterward, we tested internal consistency of each latent variable using the Cronbach's alpha and the composite reliability index, setting 0,7 as the minimum value (Nunnally & Bernstein, 1994).
Additional tests were run to increase reliability of data. On one hand, we measured discriminant validity using Average Variance Extracted (AVE), setting 0,5 as the minimum acceptable value; while for convergent validity we assessed AVEs and correlations among latent variables (Kline, 1998). To detect collinearity in latent variables, we used Variance Inflation Factors (VIFs), only accepting values below 3,3 (Kline, 1998; Kock, 2013). Finally, we computed R-squared and adjusted R-squared indices as parametric validity measures, whereas the Q-squared coefficient was used as nonparametric measure (Kock, 2013).
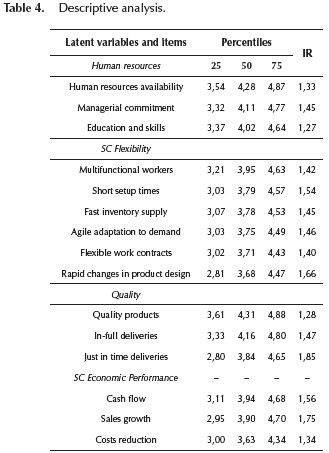
Stage 4. Descriptive Analysis
We estimated the median value of each item as measure of central tendency, and the interquartile range (IQR) as measure of data dispersion. High median values indicated that an activity was always executed or a benefit was always obtained, while low values indicated that an activity was not executed or a benefit was not gained. As for IQR, high values indicated little consensus among respondents as regards the median value of an item, while low values indicated high consensus (Tastle & Wierman, 2007).
Stage 5: Structural Equation Model
In order to prove the hypotheses stated in Figure 1, the model was evaluated using Structural Equation Modelling (SEM). SEM is considered a third-generation regression analysis technique, since it can associate latent variables in a relational and causal analysis (Avelar-Sosa et al., 2014). Moreover, it is widely used in SC research (Ketkar et al., 2012). In this study, the model was executed using WarpPls 5.0® software, based on Partial Least Squared (PLS) and widely recommended for non-normal data and small samples (Alcaraz et al., 2014).
Also, we computed five model fit and quality indices proposed by (Kock, 2013): Average Path Coefficient (APC), Average R-squared (ARS), Average Variance Inflation Factor (AVIF), Average Full Collinearity VIF (AFVIF) and Tenenhaus GoF (goodness of fit). We analyzed P-values of APC and ARS to determine the model's efficiency. In this case, we set 0,05 as the maximum acceptable value and sought to obtain statistical significance of parameters at a 95 % confidence level, thereby testing null hypotheses: APC ≠ 0 and ARS ≠ 0, versus alternative hypotheses: APC=0 and ARS=0. Finally, for AVIF and AFVIF, we looked for values below 3,3, whereas a value above 0,36 was desired in the Tenenhaus GoF.
To measure dependency between latent variables, we estimated three types of effects: (a) direct effects (arrows in Figure 1), (b) indirect effects (given through mediator variables), and (c) total effects (sum of direct and indirect effects). To determine statistical significance of such effects, we estimated their corresponding P-values, considering null hypothesis: βi = 0, versus alternative hypothesis: βi ≠ 0. Similarly, we reported the effects size (ES) for every dependent latent variable. ES is defined as the percentage of variance contained in a dependent latent variable and explained by independent latent variables (Hayes & Preacher, 2010; Preacher & Hayes, 2004).
Results
Sample description
We administered the survey from May to July 2014, thus obtaining 64 valid questionnaires, 46 of which were completed by male managers and 18 by female managers. Table 2 shows the relationship between participant's length of work experience and the companies' size, according to the number of employees. As can be observed, 87,5 % of respondents (56) belonged to small wineries employing less than 50 workers. Also, only five companies employ between 51-100 workers. Both categories account for 95,3 % of the sample, and only one company has more than 500 employees.
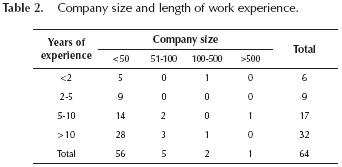
Also, 32 people reported more than 10 years of experience in their current position, thereby representing 50 % of the sample, while 17 participants reported 5-10 years of work experience. From both categories, we concluded that 76,56 % of the sample had more than five years of experience, and such results support reliability of gathered data.
Survey validation
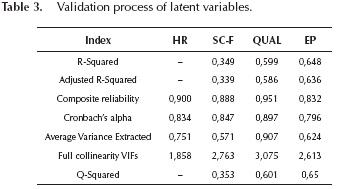
Table 3 illustrates results from the validation process, using indices described in the methodology section. R-Squared, Adjusted R-Squared and Q-Squared values confirmed parametric and nonparametric validity of all latent variables. Also the Cronbach's alpha and the composite reliability index showed values above 0,7, thus demonstrating that all latent variables had internal validity. Finally, AVE results confirmed convergent validity of data, since they were above 0,5, whereas VIFs reported no collinearity problems in latent variables, since all values obtained were below 3,3, the threshold.
Descriptive analysis
Table 4 presents results from the descriptive analysis of items, which are sorted in descending order according to median values. For latent variable Human Resources, results indicate that the most important element is their availability, while multifunctional workers are the most significant attribute of SC Flexibility. Also, participants consider product quality as the most important Quality element, whereas cash flow seems to be the most valuable feature of Economic Performance, although such flow is only ensured through sales growth.
Structural equation model: Direct effects
Results from the model evaluation are depicted in Figure 2. Every effect includes a /-value and its corresponding β-value for the statistical hypothesis test. Also, we included R2 value in every dependent latent variable.
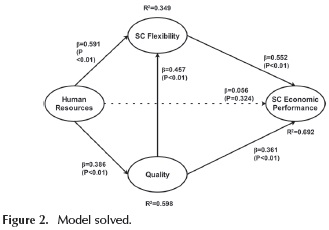
As regards model fit indices, we obtained the following values:
-
Average path coefficient (APC) = 0,401, P < 0,001
-
Average R-squared (ARS) = 0,547, P < 0,001
-
Average block VIF (AVIF) = 1,842, ideally < = 3,3
-
Average full collinearity VIF (AFVIF) = 2,577, ideally < = 3,3
-
Tenenhaus (GoF) = 0,599, large > = 0,36
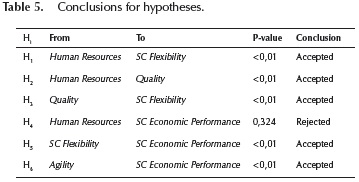
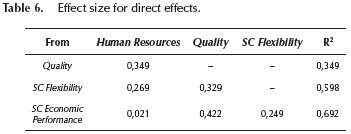
Table 5 presents conclusions drawn on the six hypotheses. As can be observed, the hypothesis associating Human Resources with SC Economic Performance was rejected, since the P-value was above 0,05 (P = 0,324). Also, Table 6 shows R2 decomposition for dependent latent variables, where it was found that Quality explained 42,2 % of the variability of SC Economic Performance, the highest R2 value.
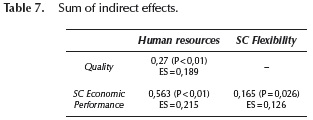
Structural equation model: Indirect effects
Table 7 presents indirect effects found between latent variables. Each effect shows a β-value, its P-value for statistical hypothesis testing, and the effect size. Note that all indirect effects were significant. Also, even though the direct effect from Human Resources on Economic Performance was rejected, the indirect effect was accepted, and it showed a bigger value. In this sense, Human Resources indirectly explained 21,5 % of the variability of Economic Performance, since ES = 0,215.
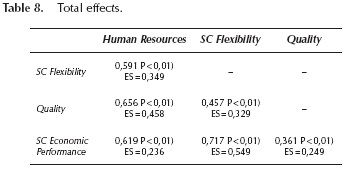
Structural equation model: Total effects
Table 8 shows total effects found for every relationship between latent variables. Observe that every total effect is statistically significant, since all P-values were below 0,05. Also, we found that SC Flexibility had the highest total effect on SC Economic Performance, since β = 0,717.
Conclusions and industrial implications
This study proposed six hypotheses to assess the impact of Human Resources on SC Flexibility, Quality, and SC Economic Performance in Rioja wine's SC. During the data validation process, hypothesis linking Human Resources and SC Economic Performance was rejected; however, the indirect effect in this relationship showed a statistically significant value, thereby demonstrating the importance of Human Resources for maximizing profits (Economic Performance).
Also, results from the model evaluation demonstrate that:
-
Managers must pay attention to human resources skills, especially in the case of enologists.
-
Wine Quality depends 59,8 % on Human Resources skills and abilities.
-
Human Resources are a source of SC Flexibility and Quality in wineries, which translate into SC Economic Performance.
-
SC Flexibility helps meet Quality product characteristics demanded by customers.
Finally, findings here reported have the following industrial implications for La Rioja's wine SC.
-
Managers must pay special attention to Human Resources' skill and abilities, since these elements are an essential source of wine Quality and SC Flexibility. Although we did not find a direct effect from Human Resources on SC Economic Performance, results did show an indirect effect. In other words, Human Resources must ensure SC Flexibility and Quality, which in turn stimulate SC Economic Performance.
-
Due to its economic impact, wine production in La Rioja should be a joint effort from wineries, universities and government. All of them must foster special training and educational programs, since Human Resources' skills and abilities are a source of profits and quality.
-
La Rioja wineries must strive to achieve SC Flexibility, since it is the most important variable when seeking to improve or maintain SC Economic Performance. However, ensuring SC flexibility means educating and training multifunctional workers, reducing setup times, and streamlining inventory supply. Likewise, it is important to implement special strategies for fast product design modifications.
Acknowledgment
We thank University of La Rioja for support provided to Dr. Jorge Luis García Alcaraz during his academic stay. Similarly, we are thankful to the National Council of Science and Technology (CONACYT) for its support granted in the development of thematic network: Optimization of Industrial Processes, under registration number 260320.
References
Ahumada, O., Villalobos, J. R., & Mason, A. N. (2012). Tactical planning of the production and distribution of fresh agricultural products under uncertainty. Agricultural Systems, 112, 17-26. DOI: 10.1016/j.agsy.2012.06.002. [ Links ]
Alcaraz, J. L. G., Maldonado, A. A., Iniesta, A. A., Robles, G. C., & Hernández, G. A. (2014). A systematic review/survey for JIT implementation: Mexican maquiladoras as case study. Computers in Industry, 65(4), 761-773. DOI: 10.1016/j.compind.2014.02.013. [ Links ]
Alfalla-Luque, R., Marin-Garcia, J. A., & Medina-Lopez, C. (2015). An analysis of the direct and mediated effects of employee commitment and supply chain integration on organisational performance. International Journal of Production Economics, 162, 242-257. DOI: 10.1016/j.ijpe.2014.07.004. [ Links ]
Aung, M. M., & Chang, Y. S. (2014). Traceability in a food supply chain: Safety and quality perspectives. Food control, 39, 172-184. DOI: 10.1016/j.foodcont.2013.1 1.007. [ Links ]
Avelar-Sosa, L., García-Alcaraz, J. L., Cedillo-Campos, M. G., & Adarme-Jaimes, W. (2014). Effects of regional infrastructure and offered services in the supply chains performance: Case Ciudad Juarez. Dyna, 81(186), 208-217. [ Links ]
Babak, J.N., & Saeid, I. (2012). Analyzing effective elements in agile supply chain. Management Science Letters, 2(1), 369-378. [ Links ]
Badea, A., Prostean, G., Hutanu, A., & Popa, S. (2015). Competency Training in Collaborative Supply Chain Using KSA Model. Procedia-Social and Behavioral Sciences, 191, 500- 505. DOI: 10.1016/j.sbspro.2015.04.352. [ Links ]
Barad, M. (2012). A methodology for deploying flexibility in supply chains. IFAC Proceedings Volumes, 45(6), 752-757. DOI: 10.3182/20120523-3-RO-2023.00319. [ Links ]
Brusset, X. (2016). Does supply chain visibility enhance agility? International Journal of Production Economics, 171, 46-59. DOI: 10.1016/j.ijpe.2015.10.005. [ Links ]
Bruzzone, A. G., Longo, F., Massei, M., Nicoletti, L., & Agresta, M. (2014). Safety and security in fresh good supply chain. International Journal of Food Engineering, 0(4), 545-556. DOI: 10.1515/ijfe-2014-0020. [ Links ]
Byrd, E. T., Canziani, B., Hsieh, Y. C. J., Debbage, K., & Sonmez, S. (2016). Wine tourism: Motivating visitors through core and supplementary services. Tourism Management, 52, 19-29. DOI: 10.1016/j.tourman.2015.06.009. [ Links ]
Cenfetelli, R. T., & Bassellier, G. (2009). Interpretation of formative measurement in information systems research. Mis Quarterly, 689-707. [ Links ]
Elgazzar, S. H., Tipi, N. S., Hubbard, N. J., & Leach, D. Z. (2012). Linking supply chain processes' performance to a company's financial strategic objectives. European Journal of Operational Research, 223(1), 276-289. DOI: 10.1016/j.ejor.2012.05.043. [ Links ]
Gil, A. J., Garcia-Alcaraz, J. L., & Mataveli, M. (2015). The training demand in organizational changes processes in the Spanish wine sector. European Journal of Training and Development, 39(4), 315-331. DOI : 10.1108/EJTD-09-2014-0067. [ Links ]
Gil, A. J., & Mataveli, M. (2016). Rewards for continuous training: a learning organisation perspective. Industrial and Commercial Training, 48(5), 257-264. DOI: 10.1108/ICT-1 1-2015-0076. [ Links ]
Gligor, D. M., Esmark, C. L., & Holcomb, M. C. (2015). Performance outcomes of supply chain agility: when should you be agile? Journal of Operations Management, 33, 71-82. DOI: 10.1016/j.jom.2014.10.008. [ Links ]
Gultek, M. M., Dodd, T. H., & Guydosh, R. M. (2006). Attitudes towards wine-service training and its influence on restaurant wine sales. International Journal of Hospitality Management, 25(3), 432-446. DOI: 10.1016/j.ijhm.2005.02.001. [ Links ]
Hayes, A. F., & Preacher, K. J. (2010). Quantifying and testing indirect effects in simple mediation models when the constituent paths are nonlinear. Multivariate behavioral research, 45(4), 627-660. DOI: 10.1080/00273171.2010.498290. [ Links ]
Karakaya, S., & Bakal, I. S. (2013). Joint quantity flexibility for multiple products in a decentralized supply chain. Computers & Industrial Engineering, 64(2), 696-707. DOI: 10.1016/j.cie.2012.12.004. [ Links ]
Ketkar, S., Kock, N., Parente, R., & Verville, J. (2012). The impact of individualism on buyer-supplier relationship norms, trust and market performance: An analysis of data from Brazil and the USA. International Business Review, 21(5), 782-793. DOI:10.1016/j.ibusrev.2011.09.003. [ Links ]
Kline, R. B. (2015). Principles and practice of structural equation modeling. Guilford publications. [ Links ]
Kock, N. (2013). Using WarpPLS in E-Collaboration Studies: What If I Have only One Group and One Condition? International Journal of e-Collaboration (IJeC), 9(3), 1-12. [ Links ]
Kumar, D., & Rahman, Z. (2016). Buyer supplier relationship and supply chain sustainability: empirical study of Indian automobile industry. Journal of Cleaner Production. DOI: 10.1016/j.jclepro.2016.04.007. [ Links ]
Luthra, S., Garg, D., & Haleem, A. (2016). The impacts of critical success factors for implementing green supply chain management towards sustainability: an empirical investigation of Indian automobile industry. Journal of Cleaner Production, 121, 142-158. DOI: 10.1016/j.jclepro.2016.01.095. [ Links ]
Martínez-Jurado, P. J., & Moyano-Fuentes, J. (2014). Lean management, supply chain management and sustainability: a literature review. Journal of Cleaner Production, 85, 134- 150. DOI: 10.1016/j.jclepro.2013.09.042. [ Links ]
Moon, K. K. L., Yi, C. Y., & Ngai, E. W. T. (2012). An instrument for measuring supply chain flexibility for the textile and clothing companies. European Journal of Operational Research, 222(2), 191-203. DOI: 10.1016/j.ejor.2012.04.027. [ Links ]
Nunnally, J. C. (81). Bernstein, IH (1994). Psychometric theory. New York: McGraw-Hill. [ Links ]
Perez-Franco, R., Phadnis, S., Caplice, C., & Sheffi, Y. (2016). Rethinking supply chain strategy as a conceptual system. DOI: 10.1016/j.ijpe.2016.09.012. [ Links ]
Preacher, K. J., & Hayes, A. F. (2004). SPSS and SAS procedures for estimating indirect effects in simple mediation models. Behavior research methods, instruments, & computers, 36(4), 717-731. [ Links ]
Sáenz-Navajas, M. P., Avizcuri, J. M., Echávarri, J. F., Ferreira, V., Fernández-Zurbano, P., & Valentin, D. (2016). Understanding quality judgements of red wines by experts: Effect of evaluation condition. Food Quality and Preference, 48, 216-227. DOI: 10.1016/j.foodqual.2015.10.001. [ Links ]
Shabani, A., Saen, R. F., & Torabipour, S. M. R. (2012). A new benchmarking approach in Cold Chain. Applied Mathematical Modelling, 36(1), 212-224. DOI: 10.1016/j.apm.2011.05.051. [ Links ]
Shinbaum, S., Crandall, P. G., & O'Bryan, C. A. (2016). Evaluating your obligations for employee training according to the Food Safety Modernization Act. Food Control, 60, 12-17. DOI: 10.1016/j.foodcont.2015.07.014. [ Links ]
Staricco, J. I., & Ponte, S. (2015). Quality regimes in agro-food industries: A regulation theory reading of Fair Trade wine in Argentina. Journal of Rural Studies, 38, 65-76. DOI: 10.1016/j.jrurstud.2015.02.002. [ Links ]
Tastle, W. J., & Wierman, M. J. (2007). Consensus and dissention: A measure of ordinal dispersion. International Journal of Approximate Reasoning, 45(3), 531-545. DOI: 10.1016/j.ijar.2006.06.024. [ Links ]
Trienekens, J. H., van der Vorst, J. G. A. J., & Verdouw, C. N. (2014). Global Food Supply Chains. In Encyclopedia of Agriculture and Food Systems, 2nd edition (pp. 499-517). Academic Press. [ Links ]
Wallace, S. W., & Choi, T. M. (2011). Flexibility, information structure, options, and market power in robust supply chains. International Journal of Production Economics, 134(2), 284-288. DOI: 10.1016/j.ijpe.2009.11.002. [ Links ]
Willersinn, C., Mack, G., Mouron, P., Keiser, A., & Siegrist, M. (2015). Quantity and quality of food losses along the Swiss potato supply chain: Stepwise investigation and the influence of quality standards on losses. Waste Management, 46, 120-132. DOI: 10.1016/j.wasman.2015.08.033. [ Links ]
Xie, G., Wang, S., & Lai, K. K. (2011). Quality improvement in competing supply chains. International Journal of Production Economics, 134(1), 262-270. DOI: 10.1016/j.ijpe.2011.07.007. [ Links ]
Zhao, G., Feng, T., & Wang, D. (2015). Is more supply chain integration always beneficial to financial performance? Industrial Marketing Management, 45, 162-172. DOI: 10.1016/j.indmarman.2015.02.015. [ Links ]

