


Serviços Personalizados
Journal
Artigo
 Inglês (pdf)
 Artigo em XML
 Referências do artigo
 Enviar este artigo por email
Indicadores
-
 Citado por SciELO
 -
 Acessos
Links relacionados
-
 Citado por Google
 -
 Similares em
SciELO
Similares em
SciELO -
 Similares em Google
Compartilhar

 Permalink
Ingeniería e Investigación
versão impressa ISSN 0120-5609
Ing. Investig. vol.36 no.3 Bogotá set./dez. 2016
https://doi.org/10.15446/ing.investig.v36n3.56198
DOI: http://dx.doi.org/10.15446/ing.investig.v36n3.56198
Identification of natural fractures using resistive image logs, fractal dimension and support vector machines
Identificación de fracturas naturales utilizando registro de imágenes resistivas, dimensión fractal y máquinas de soporte vectorial
Jorge A. Leal1, Luis H. Ochoa2, and Jerson A. Garcia3
1 Geologist Engineer Universidad de Oriente, Venezuela. MSc. Geology, Universidad Nacional de Colombia, Colombia. E-mail: jalealf@unal.edu.co
2 Civil Engineer, MSc. Geophysics, MSc. Geomatics, Universidad Nacional de Colombia, Colombia. Associated Professor at Sciences Faculty, Geosciences Department, Universidad Nacional de Colombia (Colombia). E-mail: lhochoag@unal.edu.co
3 Geologist, Specialization in Statistics, Universidad Industrial de Santander, Colombia. MSc. in petroleum engineering E-mail: jer-son.garcia@ecopetrol.com.co
How to cite: Leal, J., Ochoa, L., & Garcia, J. (2016). Identification of Natural fractures using resistive image logs, fractal dimension and support vector machines. Ingeniería e Investigación, 36(3), 125-132. DOI: 10.15446/ing.investig.v36n3.56198
ABSTRACT
The purpose of this research is to apply a new approach to identify natural fractures in wells in a hydrocarbon reservoir using resistive image logs, fractal dimension and support vector machines (SVMs). The stratigraphic sequence investigated by each well is composed of Cretaceous calcareous rocks from the Catatumbo Basin, Colombia. The box counting method was applied to image logs in order to generate a curve representing variations of fractal dimension in these images throughout each well. The arithmetic mean of fractal dimension showed values ranging from 1,70 to 1,72 at the mineralized fracture intervals, and from 1,72 to 1,76 at the open fracture intervals. Morphological classification between open and mineralized natural fractures is performed using core-logs integration in a pilot well. Fractal dimension of images along with gamma rays and resistivity logs were employed as the input dataset of a SVM model identifying intervals with natural open fractures automatically, shortly after logs acquisition and previous to its interpretation by specialists. Although final results were affected by borehole conditions and logs quality, the SVM model showed accuracy between 72,3 % and 82,2 % in 5 wells evaluated in the studied field.
Keywords: Fractal dimension, resistive image logs, box counting method, natural fractures, hydrocarbon reservoir, Catatumbo basin, support vector machines (svms).
RESUMEN
El propósito de esta investigación es aplicar un nuevo enfoque para identificar fracturas naturales en pozos de un yacimiento de hidrocarburo utilizando registros de imágenes resistivas, dimensión fractal y máquinas de soporte vectorial (MSV). La secuencia estratigráfica alcanzada por cada pozo está compuesta por rocas calcáreas cretácicas de la Cuenca del Catatumbo, Colombia. El método del conteo de cajas se aplicó a registros de imágenes, generando una curva que representa variaciones de dimensión fractal en las imágenes a lo largo de cada pozo. La media aritmética de dimensión fractal mostró valores desde 1,70 a 1,72 en intervalos con fracturas mineralizadas y desde 1,72 a 1,76 en intervalos con fracturas abiertas. La clasificación morfológica entre fracturas naturales abiertas y mineralizadas es realizada utilizando integración núcleo-registro de un pozo piloto. La dimensión fractal de las imágenes junto con registros de rayos gamma y resistividad son empleados como datos de entrada a un modelo de MSV identificando intervalos con fracturas naturales abiertas automáticamente, poco después de adquirir los registros y previo a su interpretación por especialistas. Aunque los resultados finales están afectados por condiciones del hoyo y calidad de registros, el modelo de MSV mostró exactitud entre 72,3 % y 82,2 % en 5 pozos evaluados del campo estudiado.
Palabras clave: Dimensión fractal, registros de imágenes resistivas, método del conteo de cajas, fracturas naturales, yacimiento de hidrocarburos, cuenca del Catatumbo, máquinas de soporte vectorial.
Received: June 30th 2016 Accepted: November 28th 2016
Introduction
The wells investigated during this study are located in an oil field in the municipality of Tibú, Northeast Region of Norte de Santander Department, Republic of Colombia; the oil field examined during this study, which cannot be named due to confidentiality reasons, is approximately 2888 acres in size. In oil reservoirs of the region, identification of natural fractures is important, particularly, during drilling and production activities. The knowledge of natural fracture zones prevent drilling fluid losses improve packers setting for pressure tests, and optimize selection of intervals for oil production. This area is within the Catatumbo Basin, where several sections of the Cretaceous formations have shown excellent properties as reservoirs containing natural fractures, wherein resistive image logs have been useful to describe them.
In addition to conventional techniques for borehole logs interpretation, several authors (Vivas, 1992; Turcotte, 1997) have proposed using fractal geometry descriptions for their characterization. Moreover, natural discontinuities such as faults and fracture systems have also been described using fractal analysis in outcrops and core samples extracted from the subsurface (Moreno & Garcia, 2006; Watanabe & Takahashi, 1993). The hypothesis proposed in this research is that fractal analysis of resistive image logs in naturally fractured reservoirs enables the characterization of natural fracture systems within wells using these logs. By applying box counting method, the fractal dimension is obtained on resistive image logs; thereafter, a support vector machine model is performed to identify intervals with natural open fractures. The SVMs are developed using training and classification stages. During the training stage fractal dimensioning, gamma rays, average resistivity of image tool pads, and density of open fractures were selected from image logs in a pilot well. During the classification stage it was only necessary to perform the fractal dimensioning, gamma rays and average pads resistivity analyses in order to have an indicator flag along image logs at the intervals with natural open fractures. The entire dataset is composed of resistive image logs, gamma rays and average pads resistivity of image tool from 6 vertical wells (PC-6, PC-7, PC-8, PC-9, PC-10 and PC-11) and core photographs of the well PC-7.
Geological framework
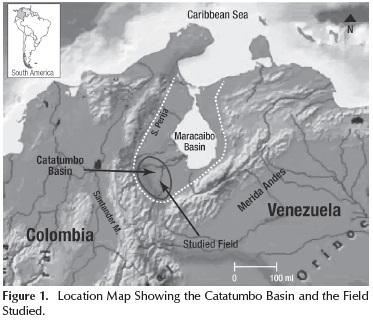
The Catatumbo Basin in Colombia is the southwestern extension of the prolific Maracaibo Basin in Venezuela; it is limited by the Serrania of Perija and Santander Massif on the west-southwest and the Merida Andes to southeast (Figure 1). To date, eleven oil and gas fields have been discovered, where oil reservoirs from the Cretaceous to the Cenozoic are trapped in faulted anticlines. The Cretaceous rocks are marine sandstones, shales and limestones which were deposited in shallow sea environments that extended across northern Venezuela and continued south through Colombia. Cenozoic rocks are fluvial-deltaic shales and sandstones that were deposited in a foreland basin. Traps are wrench controlled and faulted anticlines resulted from strike-slip convergence. Oil was sourced from the Upper Cretaceous La Luna Formation and the Lower Cretaceous Uribante Group; oil generation began in the Late Eocene and continues through today (Barrero et al., 2007).
At the studied field, two shallow structural traps have been identified, referred to as North and South Anticlines. These anticlines have a trend from north to south, dipping towards the north, showing an asymmetrical structure, presenting high dips with vertical or inverted beds in the western limb, and dips from 12 to 17 degrees towards the eastern limb. The North Anticline can be considered as the shallowest field in the entire basin, mainly composed of calcareous deposits with high fracture density. The wells examined during this study were all located in the Northern Anticline and were drilled from the upper part of Aguardiente Formation through to the lower section of the La Luna Formation.
Fractures in hydrocarbon reservoirs
From a reservoir perspective, fractures are planar discontinuities in rocks due to mechanical deformations or physical diagenesis (Nelson, 2001). Open fractures are important because they form channels through which water and hydrocarbons can flow. This increases system permeability and allows different lithologies in various locations around the world to act as reservoirs. The fractured systems have measurable properties useful for their characterization, for instance, density and orientation; properties that can be determined in boreholes without casing, using image logs. Fractures and fracture systems occur in nature in a wide range of scales, from microns in a thin section to mesoscopic fractures comprising systems that run thousands of kilometers at the edge of a tectonic plate, showing complex patterns and shapes; these combinations of features make them potentially interesting for fractal analysis (Roy, Perfect, Dunne, & Mackay, 2007). The quality of a fractured reservoir will depend on the fracture porosity and permeability, where the morphology of fracture planes will be controlling these factors. This morphology can be observed in core, outcrop, or it can be inferred from some logs, such as resistive image logs. The four basic types of natural fracture plane morphologies are open, deformed, mineralized and vuggy fractures (Nelson, 2001). The most relevant to this research are open and mineralized fractures, because they are the common types in reservoirs of the area. Open fractures, as the name implies, possess no deformational or diagenetic material filling the width between the walls of the fracture and are potential conduits for fluid flow. The permeability of open fractures is a function of the initial fracture width, the in situ effective stress component normal to the fracture plane, fracture roughness, and the contact area on the fracture walls. Generally, open fractures greatly increase a reservoir's permeability parallel to fracture planes. Mineralized fractures are those that have been filled by secondary or diagenetic mineralization. Quite often this secondary cementing material is quartz, carbonate, or both. While the presence, width, and intensity of natural fracture systems can be predicted with some degree, mineral filling and the completeness of filling cannot (Nelson, 2001).
Borehole logs
Borehole logs are recordings of measurements of physical properties of subsurface rocks, which are plotted versus depth for analysis. Most of these measurements are based on electrical (resistivity logs), nuclear (gamma ray logs) and acoustic principles. Gamma ray logs measure natural radioactivity in rocks and may be used to differentiate lithologies, make well correlations and petrophysical evaluations. Sandstones that are free of clay and limestones have low concentrations of radioactive minerals and show low measures of gamma rays; as the clay content increases, the response of gamma rays likewise increases due to concentration of radioactive elements into clays. However, clean sandstones (with low clay content) could also produce high gamma rays response, if the sandstone contains minerals such as feldspar, mica or uranium-rich water (Asquith & Krygowski, 2004).
Resistivity logs represent rocks' ability to allow the flow of electric current, expressed in ohms per meter (Ω m). The resistivity has a wide range of values and therefore is generally plotted in logarithmic scale. Resistivity logs are essential in formation evaluation, because hydrocarbons do not conduct electricity and formation waters do; consequently, there is a great difference between the resistivity of rocks saturated with hydrocarbon and rocks saturated with water. Clays and other minerals, such as pyrite, are electrical conductors too, and they can reduce resistivity of rocks. The resistive image logs are acquired in wells without casing, providing a two dimensional image of the borehole walls. Image logs provide strike and dip of geological planes, allow characterization of sedimentary structures, thin layers evaluation, electrofacies analysis and identification of fractures. The resistive image tool employed for this research is a wireline log type and has eight opposite pads with 20 or 24 electrodes at the end of each pad. The resistivity acquired by electrodes is then processed and transformed into micro-electrical pseudo images of the borehole walls. The tool has 0,2 inches of vertical resolution and 70 % of coverage in wells of 8,5 inches of diameter. Resistive image and gamma rays logs were acquired at the same run in each well.
Fractals and fractal dimension
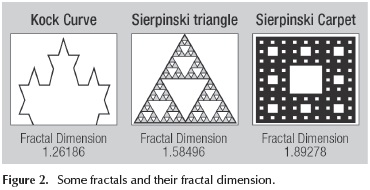
In 1975 Benoit Mandelbrot named fractal (from latin fractus - irregular), the set of forms normally generated by process of repetition characterized for having details in any observed scale (self-similarity), infinite length and fractional dimension; a brief explanation says that a dimension is fractal when the object occupies a space expressed by a fractional or decimal number (Mandelbrot, 1983). Box counting method is widely used for characterizing fracture networks as fractals and estimating their fractal dimension "D". If the analysis yields from a power law distribution given by the expression "N αr-D ", where "N" is the number of boxes containing one or more fractures, "r" is the box size and "α" represents proportionality, then the fracture network is considered to be fractal (Roy, Perfect, Dunne, & Mackay, 2007). Figure 2 shows some common fractals and their fractal dimension.
In order to apply the box counting method, the studied figure must to be inserted in a box of side "r", then this box should be divided into four boxes with side "1/r" and the number of boxes covering any part of the figure "N (r)" must be counted; afterward, resulted boxes are divided into four boxes again and the number of boxes "N (r)" containing any part of the figure must be re-counted. This procedure is repeated, also counting the number of boxes with some part of the figure in order to plot "Log (1 / r)" versus "Log (N(r))", being "Xj = Log(1/rJ)" and "Yj = Log(1/Nj)". Finally, the slope "m" of the regression is the fractal dimension obtained by the Equation (1).
SVMs & Kernel methods
The SVMs are a group of supervised learning algorithms related to classification and regression problems. When a sample is given to train, it can be separated into classes and train a support vector machine model to predict the classes within a new sample. A support vector machine represents the points of a sample in space, separating classes within these points in the widest possible spaces. When new samples are projected in this model, they can be classified to any class in function of proximity of the points. The model of SVM applied in this research is based on its coefficient "C" and the kernel method selected. The coefficient "C" regulates accuracy of the model; this coefficient can lead the model trains properly (generalization), or else, it can reach a point of overfitting. A proper generalization refers the model's ability to classify accurately several samples different than the ones employed during training stage; moreover, overfitting occurs when the model can only classify correctly the sample used during training stage.
Kernel methods project a dataset in a space of specific characteristics and uses algorithms related to linear algebra, geometry and statistics to identify linear patterns in the dataset. Any solution using kernel methods comprises two phases. The first phase consists of a module that performs a mapping of the projected data; the second phase contains an algorithm designed to detect linear patterns in the space where this data is projected (Taylor & Cristianini, 2004). The kind of kernel applied in this research was a polynomial type [K(x,y) = (< x,y >+1)E] ; where "E" is a parameter representing the polynomial degree and must be defined by user; "K" represents the kernel function depending on variables "x" and "y". A good way to select a proper polynomial degree is starting with a linear model (E = 1); later, this value is gradually increased to reduce absolute error of the model, improving its generalization (Witten & Franck , 2005).
Processing of resistive image logs
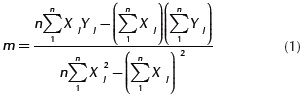
Resistive image processing follows a standard sequence, beginning with data quality control of magnetometer and accelerometer measurements, which provide information about accurate position of all elements of the tool in space; and therefore, orientation of all handpicked geological features. Afterwards, corrections of velocity and acceleration that the tool had at the moment of data acquisition are performed. Finally, dynamic and static normalizations of resistivity data are processed; resistivity measures are dynamically normalized every foot in order to get a clear view of rock details, and statically normalized in the entire logged interval optimizing tool operation under extreme resistivity zones (Figure 3). A color code is applied to interpret resistive image logs, where light colors represent high resistivity and dark colors indicate low resistivity values. The geological events most commonly observed in image logs are well-defined planes which can be associated with bed boundaries, sedimentary structures, faults and fractures; these features are observed as sinusoids on image logs corresponding to the traces of planar events in the borehole wall. Sinusoids are generated unwrapping in two dimensions the cylindrical surface of the borehole, which cut these planar events neither perpendicular nor parallel to the tool axis.
The image tool takes resistivity measurements in eight pads every 0,2 inches of depth simultaneously. The average resistivity log is generated from the arithmetic mean of resistivity measurements for the eight pads in a specific depth, applying the expression 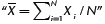 ;where "
 " represents the average resistivity log, "N" the number of resistivity measurements of each pad of the tool and "∑Xi" is the sum of resistivity measurements of each pad in a specific depth.
Box counting applied to image logs
The application Fractal Image was designed by L. Ochoa in 2013; it is based on the box counting method and Equation 1 in order to calculate fractal dimension of resistive image logs. Fractal Image uses as input a bit mapped picture (BMP) of 512 pixels wide by 15378 pixels long. This application generates a fractal dimension curve along the resistive image (fractal dimension log). The sampling rate must be set by the user. The conversion of pixels to depth of images with vertical scale 1:5 is 512 pixels, which is equal to 2,17 feet. The application transforms resistive images from dynamic normalization into binary (black and white), using a red, green and blue (RGB) of 21447 as a cutoff; any pixel above this RGB will be transformed into black and all pixels below this RGB will become white. Figure 4 shows fractal dimension for Sierpinski carpet of 1,88599 using the application, while the theoretical value for this figure is 1,89278, indicating an accuracy of 99,6409 %.
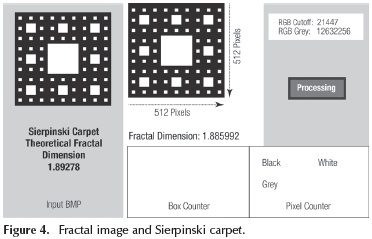
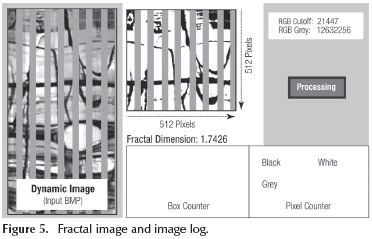
Figure 5 shows an example of an image log on natural open fractures interval with fractal dimension of 1,7426. The gray colors on the image logs represent gaps without data between tool pads, which is constant along the entire log (RGB = 12 632 256), this gray color is removed and the box counting method is only applied to white and black pixels of dynamic image.
Core photographs and image logs integration
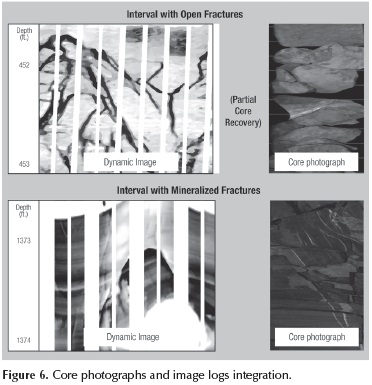
Core photographs and image logs integration was performed in the pilot well in order to distinguish morphological patterns of fracture planes in resistive images. Fractures manually selected as conductive may be related to empty spaces filled with conductive drilling fluid or precipitation of electrical conductor minerals like pyrite (FeS2). Moreover, fractures interpreted as resistive may be associated with calcite (CaCO3) mineralized fractures or empty spaces filled with oil; petrographic studies of core samples in the area have shown that calcite is the most common mineral sealant of fractures. Figure 6 depicts comparison between core photographs and resistive images at the intervals with open and mineralized natural fractures after depth shift corrections.
SVM model used to identify open fractures
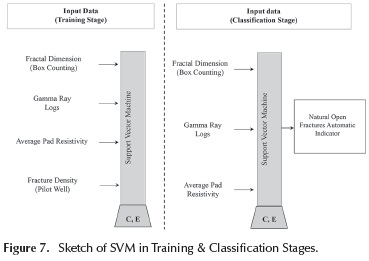
The data set used during the training stage of the SVM was taken from an interval within well PC-7. For this interval its fractal dimension, gamma ray, average pad resistivity and fracture density of conductive/open fractures obtained from manual selection of these geological events by a specialist were used. The fracture density represents the number of manually selected fractures per foot along image logs. Drilling induced fractures are typically presented like two vertical lines separated 180° from one another, and/or an echelon geometrical pattern in image logs; such patterns were not considered during manual selection nor for fracture density computation, assuring that model only recognizes natural fracture during classification stage. The well PC-7 was selected because it has the highest logged section of all geological formations of the area. The remaining wells have the most data only in one of the three logged formations and they would induce a bias pattern if some of them were used during training stage. For classification stage only the fractal dimension, gamma ray and average pad resistivity logs are required, and then the model automatically generates an indicator of natural open fractures for any well of the field with image log (Figure 7).
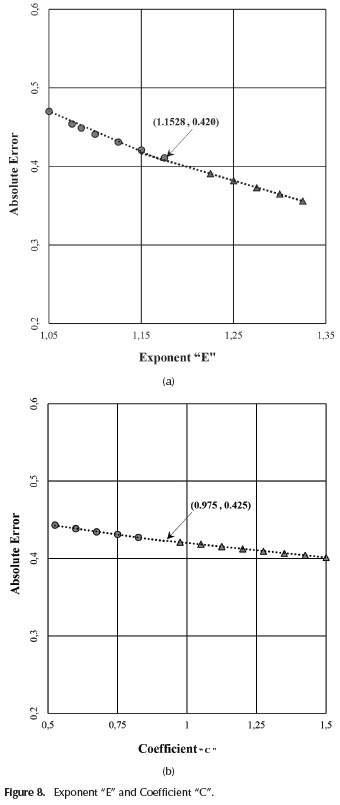
The exponent "E" of the polykernel method was graphically determined as shown in Figure 8a. The cross plot "E" versus "absolute error" indicates an appropriate value for "E" of 1,1528. For selection of coefficient "C", exponent "E" remains constant to 1,1528 and coefficient "C" is gradually increased every 0,025 units beginning from zero. Figure 8b shows the cross plot "C" versus "absolute error" with patterns interception at the point (0,975, 0,425), indicating an appropriate value of "C" equal to 0,975. The coefficient "C" along with the polikernel exponent "E" are the foundation of the SVM of this research.
Results
Core photographs and image logs integration in the pilot well show conductive fractures are natural open fractures, where conductive drilling fluid is housed in fracture void spaces resulting in black sinusoids on image logs; this fact is assumed for the rest of the wells without core data.
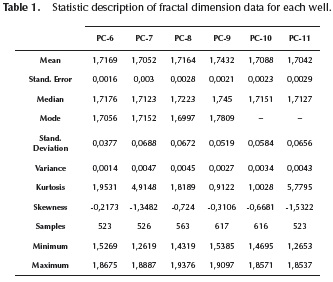
Once the Fractal Image application was employed to resistive images, the fractal dimension logs were generated, obtaining a maximum value of 1,94 in the well PC-8, and a minimum value of 1,26 for the well PC-7. Table 1 shows a statistic description of fractal dimension for each well.
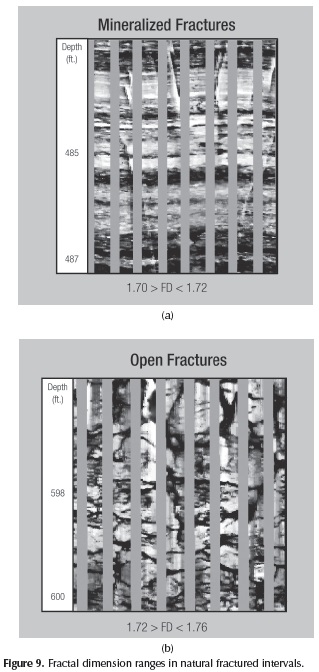
The relationship between fractal dimension and natural fractures in borehole images is explained through the arithmetic mean of fractal dimension at the fractured intervals (Figure 9). The arithmetic mean for mineralized fractures is between 1,70 and 1,72, while values for open fractures are from 1,72 to 1,76 in 6 tested wells. Fractal dimension ranges will change depending on the RGB cutoff applied to transform the resistive images into binary and coverage of the image tool in the well.
The SVM model results were evaluated using confusion matrices for each well where it was applied. The confusion matrix shows, in tabular form, the results of classification or prediction experiments performed by a model, where a two-class classification model has two possible scenarios. First, given a set of independent variables (sample), the classification model correctly determines the class that should be assigned to those variables. Second, the classification model incorrectly assigns the variables to certain class. In the case of a two-class classification model, the confusion matrix in Table 2 is presented, where classes are represented by "There are fractures" and "There are no fractures". True positive "TP" and true negative "TN" terms are correct classifications; "TP" is when the model shows open fractures and they really exist in the image logs; "TN" occurs when the model does not show open fractures and these actually do not exist in the image logs. Contrarily, false negative "FN" is a mistake labeling a sample as "There are no fractures" when they exist; false positive "FP" is also a mistake when a sample is classified as "There are fractures" when they do not exist.
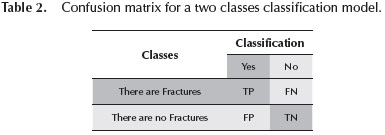
The way to quantify percentage of accuracy and error is performed using the Equations (2) and (3) respectively:
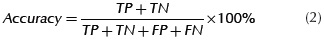
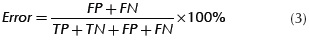
Table 3 shows the confusion matrix results for the wells in the studied field where automatic identification model was applied; the well PC-11 has the highest accuracy with 82,2 %, while the lowest one is for the well PC-9 with 72,3 %.
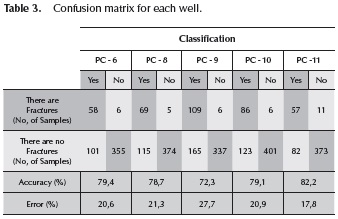
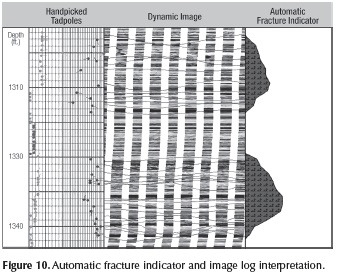
The automatic fracture indicator shows "FP" at the intervals with bad hole conditions and where image tool pads did not have effective contact with borehole walls. Figure 10 compares model results (Track 4) with handpicked image logs; purple tadpoles represent open fractures (Track 2).
This SVM model was additionally applied to other areas in the Catatumbo Basin showing an accuracy of about 55,4 % in three wells of neighboring fields (Leal, Ochoa, & Garcia, 2014).
Conclusions
The fractal dimension of resistive image logs can be employed to identify natural fractures in wells of naturally fractured reservoirs of the studied field; furthermore, SVM models can be applied to detect intervals with open fractures automatically in resistive image logs, before long processes of interpretation. The fractal dimension ranges obtained in this investigation are not absolute and will be changing depending on the kind of tool used for image acquisition and parameters applied to transform the image into binary. This SVM model can be applied in wells of other fields in the Catatumbo Basin, but a new exponent "E" of polynomial kernel and coefficient "C" must be determined to improve the accuracy.
This methodology provides an alternative path to characterize natural fractures from image logs and may have applications not only in oil industry, but also in other studies related to naturally fractured rock systems.
Acknowledgments
The authors appreciate the support of Laboratorio de Sistemas Inteligentes de la Universidad Nacional de Colombia - Sede Bogota. Additionally, authors acknowledge to ECOPETROL for permission to use their data; as well as all those who have read this document before be published.
References
Asquith, G., & Krygowski , D. (2004). Basic Well Log Analysis. (II ed., Vol. 16). Tulsa, Oklahoma, United States of America: The American Association of Petroleum Geologists. [ Links ]
Barrero, D., Pardo, A., Vargas, C., & Martinez, J. (2007). Colombian Sedimentary Basins. Bogota, D.C., Colombia: Agencia Nacional de Hidrocarburos - ANH. [ Links ]
Leal, J., Ochoa, L., & Garcia, J. (2014). Fractal Dimension and Image Logs, a New Approach to Enhance the Characterization of Naturally Fractured Reservoirs and Its Application in Catatumbo Basin-Colombia. AAPC's Annual Convention & Exhibition (p. 90-189). Houston: The American Association of Petroleum Geologists. [ Links ]
Mandelbrot, B. (1983). The Fractal Geometry of Nature. New York, New York, United States of America: W. H. Freeman and Company. [ Links ]
Moreno, G., & Garcia, O. (2006). Quantitative Characterization of Fracture Patterns with Circular Windows and Fractal Analysis. Geologia Colombiana (31), 73-74. [ Links ]
Nelson, R. (2001). Geologic Analysis of Naturally Fractured Reservoirs (II ed.). Houston, Texas, United States of America: Gulf Professional Publishing. [ Links ]
Roy, A., Perfect, E., Dunne, W., & Mackay, L. (2007). Fractal Characterization of Fracture Networks: An Improved Box-Counting Technique. Journal of Geophysical Research, 112, 1-2. DOI: 10.1029/2006JB004582. [ Links ]
Taylor, J., & Cristianini, N. (2004). Kernel Methods for Pattern Analysis. Cambridge, United Kingdom: Cambridge University Press. DOI: 10.1017/CBO9780511809682. [ Links ]
Turcotte, D. (1997). Fractal and Chaos in Geology and Geophysics. Cambridge, United Kingdom: Cambridge University Press. DOI: 10.1017/CBO9781139174695. [ Links ]
Vivas, M. (1992). Techniques for Inter Well Description by Applying Geostatistic and Fractal Geometry Methods to Well Logs and Core Data. Ph.D. Thesis, XVI-XVII. Norman, Oklahoma, United States of America: The University of Oklahoma. [ Links ]
Watanabe, K., & Takahashi, H. (1993). Fractal Characterization of Subsurface Fracture Network for Geothermal Energy Extraction System. In S. University (Ed.), Eighteenth Workshop on Geothermal reservoir Engineering (pp. 119-120.). Stanford: Stanford University. [ Links ]
Witten, I., & Franck, E. (2005). Data Mining Practical Machine Learning Tool and techniques (II ed.). San Francisco, California, United States of America: Morgan Kaufmann Publisher. [ Links ]

