


Services on Demand
Journal
Article
 English (pdf)
 Article in xml format
 Article references
 Send this article by e-mail
Indicators
-
 Cited by SciELO
 -
 Access statistics
Related links
-
 Cited by Google
 -
 Similars in
SciELO
Similars in
SciELO -
 Similars in Google
Share

 Permalink
Ingeniería e Investigación
Print version ISSN 0120-5609
Ing. Investig. vol.37 no.1 Bogotá Jan./Apr. 2017
https://doi.org/10.15446/ing.investig.v37n1.62270
DOI: http://dx.doi.org/10.15446/ing.investig.v37n1.62270
Development of a system dynamics model based on Six Sigma methodology
Desarrollo de un modelo de dinámica de sistemas basado en la metodología Seis Sigma
J. J. Cardiel-Ortega1, R. Baeza-Serrato2, and R. A. Lizarraga-Morales3
1 Industrial Engineer, MSc. CIATEC, Mexico. Affiliation: Professor. Universidad de Guanajuato, Sede Yuriria, Mexico. E-mail: cardiel.jovani@ugto.mx
2 Industrial Engineer, PhD. CIATEC, Mexico. Affiliation: Research Professor, Universidad de Guanajuato, Sede Yuriria, Mexico. E-mail: r.baeza@ugto.mx
3 Electrical Engineer, PhD. Universidad de Guanajuato, Mexico. Affiliation: Research Professor, Universidad de Guanajuato, Sede Yuriria, Mexico. E-mail: ra.lizarragamorales@ugto.mxs
How to cite: Cardiel-Ortega, J., Baeza-Serrato, R., and R. Lizarraga-Morales, A (2017). Development of a system dynamics model based on Six Sig-ma methodology. Ingeniería e Investigación, 37(1), 80-90. DOI: 10.15446/ing.investig.v37n1.62270.
Received: January 28th 2017 Accepted: March 1st 2017
ABSTRACT
A dynamic model to analyze the complexity associated with the manufacturing systems and to improve the performance of the process through the Six Sigma philosophy is proposed. The research focuses on the implementation of the system dynamics tool to comply with each of the phases of the DMAIC methodology. In the first phase, define, the problem is articulated, collecting data, selecting the variables, and representing them in a mental map that helps build the dynamic hypothesis. In the second phase, measure, model is formulated, equations are developed, and Forrester diagram is developed to carry out the simulation. In the third phase, analyze, the simulation results are studied. For the fourth phase, improving, the model is validated through a sensitivity analysis. Finally, in control phase, operation policies are proposed. This paper presents the development of a dynamic model of the system of knitted textile production knitted developed; the implementation was done in a textile company in southern Guanajuato. The results show an improvement in the process performance by increasing the level of sigma allowing the validation of the proposed approach.
Keywords: Six Sigma, DMAIC, system dynamics, knitting.
RESUMEN
Se propone un modelo dinámico para analizar la complejidad asociada a los sistemas de producción y mejorar el desempeño de los procesos a través de la filosofía Seis Sigma. La investigación se enfoca en la implementación de la herramienta de dinámica de sistemas para dar cumplimiento a cada una de las fases de la metodología DMAIC. En la primera fase, definir, se articula el problema, recolectando los datos, seleccionando las variables y representándolas en un mapa mental que ayuda a construir la hipótesis dinámica. En la segunda fase, medir, se formula el modelo, se desarrollan las ecuaciones y se elabora el diagrama de Forrester para llevar a cabo la simulación. En la tercer fase, analizar, se estudian los resultados obtenidos de la simulación. Para la cuarta fase, mejorar, se valida el modelo a través de un análisis de sensibilidad. Finalmente en la fase de control, se proponen políticas de operación. En este trabajo se desarrolló un modelo dinámico del sistema de producción textil de tejido de punto; la implementación se realizó en una empresa textil del sur de Guanajuato. Los resultados muestran un aumento en el desempeño del proceso incrementando el nivel de sigma, lo que valida el enfoque propuesto.
Palabras clave: Seis sigma, DMAIC, dinámica de sistemas, tejido de punto.
Introduction
Today, manufacturing companies need tools that will enable amply support the decisions made in their processes (Peña, 2003). Industrial systems, and specifically manufacturing subsystems, are characterized by complex systems where the everyday required decisions to run a system manufacturing operations, involve the need to understand and manage the dynamic behavior associated with it (Campuzano, Martínez & Ros, 2010). Continuous improvement involves ongoing efforts to improve products/ services proactively; hence, these activities involve learning (Juran, 1969), and learning is the process through which knowledge is created. Gitlow & Breyfogle say that in continuous improvement projects, team members work together to generate ideas for improvement, test their ideas, and implement solutions (as cited in Kovach & Fredendall, 2014).
A tool to achieve continuous improvement is Six Sigma, first introduced in Motorola in 1987, with a strategy of continuous business improvement that seeks to enhance the performance of the process of an organization and reduce variation (Gutiérrez & De la Vara, 2006). At the same time, Six Sigma is an organized and systematic method for strategic process upgrading and new product and service development that relies on statistical and the scientific methods to make dramatic reductions in customer defined defect rates (Linderman, Schroeder, Zaheer & Choo, 2003).
Six Sigma uses the DMAIC methodology for dramatic improvement. The DMAIC methodology consists of five steps: Define, Measure, Analyze, Improve, and Control. The objective is to establish a baseline to define opportunities for improvement, measure process effectiveness to quantify the magnitude of the problems, analyze data to investigate the root causes of the problems, apply necessary experimental techniques to improve the process, and monitor techniques to sustain the process effectiveness and improvement (Gupta, 2004).
A production system, like most real-life systems, consists of dependent events and variation. Regarding that things do not happen in isolation, a systems approach is needed when deciding how to best leverage high-performance. This is the single most important message from some of the great thinkers of the 20th century, which include W. Edwards Deming, Jay Forrester, Peter Senge and Eli Goldratt (Nordstrom, Gawad & Nowarski, 2006).
It is relevant the integration of the DMAIC methodology with a tool based systemic thinking. Senge (2005) defined systems thinking as a way of seeing wholes. It is a framework for seeing interrelationships rather than things, for seeing patterns of change rather than "static snapshots" and seeing the major interrelationships underlying a problem leads to new insight into what might be done.
System Dynamics, as a fundamental tool for decision-making, was created by Jay Forrester in the fifties, and implemented in various disciplines. It is a method for analyzing policies and solving complex problems using computer simulation models. The models capture the causal interlinks within the system and project them as a structure of feedback loops (Mikati, 2010). Much of the art of system dynamics modeling is about discovering and representing the feedback processes, which, along with stock and flow structures, time delays, and nonlinearities, determine the dynamics of a system. In fact, the most complex behaviors usually arise from the interactions (feedbacks) among the components of the system, not from the complexity of the components themselves (Sterman, 2000).
The present paper is organized as follows: in the first section, the literature review is presented; in the second section, the development of the methodology with the proposed approach isdisplayed; the results are shown in the penultimate section, and, finally the conclusions.
Literature review
In the literature, applications of systems dynamics that model the manufacturing processes are developed for decision making, control and establishing operating policies, aspects that in the model proposed in this research are treated. Arango & Romero (2014) develop a system dynamics model that allows characterizing the system and evaluating policies to improve productivity of a Colombian gold mining process. The simulation of different scenarios allows to observe that sustainable investment policies increase the productivity of the system. Baeza & Vázquez (2014) propose the use of the system dynamics approach to develop a method of transition from a multiple regression predictive model to a simpler nonlinear regression explanatory model, which increases the level of prediction of the model. Research demonstrates the causality between the variables analyzed and the validation of the model was developed in a textile company. Mikati (2010) used system dynamics simulation to investigate lead times in a manufacturing environment where one of the processing units is a bottleneck. It is shown that there is an optimal batch size that results in a minimum lead time and that inventory level at optimum matches the desired inventory.
Following investigations implement the DMAIC methodology in order to significantly improve processes. Gijo & Scaria (2014) presented the successful implementation of Six Sigma DMAIC methodology along with Beta correction technique in an automotive part manufacturing company, the implementation of Six Sigma approach resulted in a reduction of process capability related problems. Additionally, there was a significant financial impact on the profitability of the company. Felizzola & Luna (2014) proposed a methodology for the implementation of an integrated approach, commonly called Lean Six Sigma, which is adapted to the needs and characteristics of SMEs. Validation was performed in a furniture manufacturing company, where they made significant improvements in quality. Ocampo & Pavón (2012) performed a comparative analysis of the DMAIC methodology and the steps taken to develop a simulation model and propose a five-step methodology that incorporates both tools to analyze different scenarios. Chan et al. (2014) used the DMAIC methodology and PACE prioritization matrix (Priority, Action, Consider, and Eliminate) to improve and robust a mathematical model of productivity, they raise that productivity is one of the most important criteria in automated lines.
The following authors raise the importance of using system dynamics in Six Sigma projects, these papers are a basis of the proposed approach presented in this research. Newton (2003) suggests that system dynamics is an appropriate Six Sigma tool when the problematic behavior being addressed by the Six Sigma project may be arising from feedback structure. In his paper, he proposes several strategic and tactical roles for Six Sigma projects. Also, suggests that the focus of the analysis phase (DMAIC) is to find the "root causes" that create the undesirable variation. However, sometimes cause-effect is not one-way, but circular. Van & Pretorius (2014) suggest that causality can be studied using Six Sigma tools, but not always allow the user to study and understand the feedback from other factors such, as soft human issues, in the improvement process system, typically referred to as "feedback causality". System dynamics may improve this understanding. The purpose of the authors is to share results from research into the sustainability of quality improvement programs, and the development of an appropriate system dynamics model. Yuniarto & Elhag (2008) propose a new quality framework that is robust in dealing with dynamic circumstances. They use the DMAIC methodology where they incorporate system dynamics in the analysis and improvement phases. This does not only identify the key process variables that cause failures but also is helpful to understand root cause's behavior of why failures occur. In the Improve phase initiates the identification of redesign and any improvement actions by discovering influence factors relationships based on causes of failure that determine the critical to quality behavior.
In the aforementioned papers, the importance of improved the performance of manufacturing systems through the DMAIC methodology is demonstrated. The authors use the methodology of system dynamics as a tool for decision making and provide operation policies. However, these researches implemented the described methodologies individually, or in some works, they incorporate system dynamics only in the phase of analysis and improvement.
The purpose of this research is to present the proposal of a system dynamics approach to comply with each of the five phases of the DMACI methodology.
Methodology
In this section, the methodology is developed. Additionally, the model system of textile production knitted is presented to validate the proposed approach. The diagram of Figure 1 shows in detail each of the steps for applying the five phases of the approach.
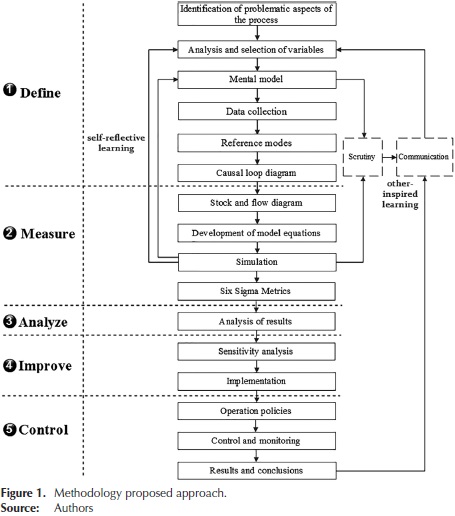
Phase 1 Define
In the first phase, the problem is defined and the situations to be improved are localized. Therefore, it is required to know the general process flow of the system (Ocampo & Pavón, 2012). Complete system definition includes identification of internal and interface functions, expected performance at all system levels, system restraints, and failure definitions (Pyzdek, 2003). The steps in order to comply with this phase are presented below.
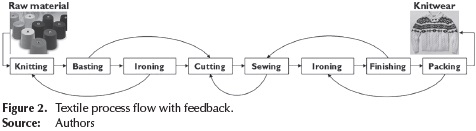
Identification of problematic aspects of the process: From the observation, the need to control the levels of production in each department of the textile process was detected, in order to comply in a timely manner with customer orders. The level of production was considered as a quality characteristic. Through the DMAIC methodology, it is possible to improve the performance of the process but at the same time, it is necessary to analyze the manufacturing system holistically because the flow of material and information is conceived in a linear way and the feedback processes are not considered. In the textile production system, there are seven departments through which the knitted garments are transformed. See Figure 2.
Analysis and selection of variables: In the selection of variables for the model, the analysis was performed considering management, operational staff, and system modeling experts.
The state variables are the reservoirs or the areas where the material (clothing) accumulates through the process. The flow variables are those that determine the rate of entry and exit of material from the reservoirs and the variation through the time. Finally, the auxiliary variables represent the intermediate steps for the determination of the flow variables from the level variables. For the model, 9 state variables, 10 variables flow and 28 different types of auxiliary variables were included.
Representation of mental map: At this stage, Richmond (2005) defined thinking as consisting of two activities: constructing mental models, and then simulating them in order to draw conclusions and make decisions. A mental model is a "selective abstraction" of reality that you create and then carry around in your head. To create the mental map the current situation was analyzed, the way it works in the company, and the movement of material through the process. Qualitative elements such as the experience, attitude, and fatigue of the operators were identified in the human resource factor. Besides, quantitative elements such as production rates by area, shifts, delays, hours worked, defects rate, and capacity were considered. Including the two elements allows delving into the existing problem. The analysis of the operations in each department allowed identifying the processes of feedback, the flows, and accumulations of material. Similarly, how Management made the decisions and how it influences every area of the process was analyzed.
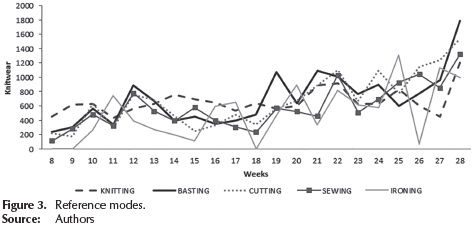
Data collection and reference modes: Reference modes are a set of graphs and other descriptive data showing the development of the problem over time. Data on the number of garments produced 21 weeks of the year 2012 in the main areas of textile production process were collected. Information about the past behavior of the system is shown in Figure 3.
Development causal loop diagram: The causal diagram of the production system is shown in Figure 4, which leads to the initial dynamic hypothesis. The auxiliary efficiency and supervisor variables are of great importance within the model since they intervene in each of the stages in the process. The auxiliary variables of experience, attitude and productivity affect positively the efficiency variable. Such result is due to the greater the level of these variables, the efficiency of the work shifts increases. The supervisor variable acts positively on the flow variables or production rates. The Supervisor determines the production levels and compares them with the desired goal. The greater the discrepancy, the corrective action to be implemented will be bigger, i.e. using external factories or making use of extra time.
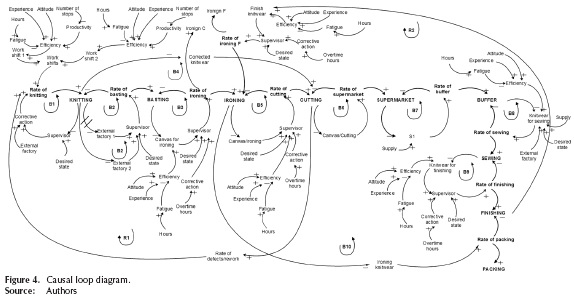
The diagram shows the relationship and feedback between the model variables, as well as the structure and causes of the problem. Within this diagram, it is possible to see the interaction between the process areas. One can see that the production system should not be viewed only in a linear way, because it is located in a dynamic environment where the variables indicate the influence they have on the others.
Phase 2 Measure
The general objective of this second phase is to better understand and quantify the magnitude of the problem, with metrics to conduct the evaluation are established, it is understood in more detail the process and the baseline is established. Here are the steps to meet this stage (Gutiérrez & De la Vara, 2006).
Stock and Flow Diagram: Once developed the causal diagram, (stock and flow diagram -also called Forrester diagram) is developed. The dynamic model of the textile production system is shown in Figure 5. In the model stocks (rectangular icons) are all areas of the process including the supermarket and the buffer time, which has the process. The auxiliary variables are the elements that currently influence the system and are represented by circular icons. Rates of material in and out of the reservoirs are identified by the linear arrows icon with a valve.
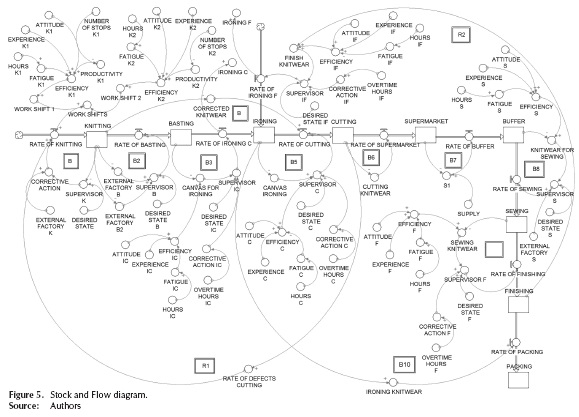
As it is shown in the diagram, the production flow begins in the knitting department where the yarn fibers are transformed into canvases. With a higher level of efficiency in each work shift, the flow variable (production rate) is positively affected by generating a significant amount of canvases flowing to the reservoir or state variable. In the reservoir, the production corresponding to this department accumulates. The values in the reservoir are controlled through balancing loops to achieve a desired production goal. This same behavior occurs in the other stages of the process where production levels vary due to the operating conditions of each area. In this way, the flow of material begins with the canvases until a garment for sale to the customer is ready.
Development of model equations: The state variables or stocks and flows are based on a hydraulic metaphor of flow of water into and out of the reservoir. The mathematical representation of each reservoir is through integral equations. The state variables accumulate or integrate their flows.
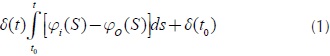
Where:
δ =Stock
φ=Inflow
φo=Outflow
Equivalently, the net rate of change of any stock, its derivative, is the inflow less the outflow, defining the differential Equation (2).
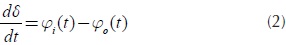
In the case of system model textile production, the reservoirs are the nine areas involved in the process, flows are production rates of each reservoir, and rates of change of the flow variables dictate the rhythm in the accumulation of state variables. The auxiliary variables are constant values or set functions.
Simulation: The skill that the simulation must take into account the variability and interdependencies, trying many alternative solutions quickly and easily, as well as testing without disrupting existing processes makes the simulation one of the most important tools for analysis and improving systems and therefore, a perfect ally for DMAIC (Ocampo & Pavón, 2012). Forrester diagram allows understanding the behavior of the process through the simulation model.
This makes it possible to focus the improvement efforts on key features that primarily affect the process. In this case, the variable is to improve the capacity of each department of the production process and measured through the Six Sigma metric. Ten balancing loops (B1-B10) were included. Each reservoir has one where the desired production goal is set, compared with the current state of the reservoir and proceeds to take corrective action to achieve the goal. The reinforcing loop "R1" is characterized by feedback exists between the areas of knitting and cutting due to the rate of defects. The loop "R2" is reinforcing because in the last stage of the process, the apparel article back to the ironing department, therefore, adds to the existing accumulation. In the knitting department, there is an accumulation of canvases that have been manufactured in the rectilinear machines. The supervisor identifies the current state of the accumulation and compares it with a desired state of production, if a difference exists, is resorted to apply corrective action, which is to increase the capacity through external factory.
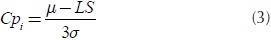
Six Sigma Metrics: Six Sigma methods and tools used to improve performance are: costs, increased revenue, customer satisfaction, increased capacity, reduced complexity, reduced cycle time and minimization of defects, and errors. In statistical terms for processes, it generates less than 3,4 defects per million opportunities (Gygi, Decarlo & Williams, 2005). One of the approaches Six Sigma are quantitative metrics used to measure process performance, product quality and project objectives established (Zu, Fredendall & Douglas, 2008). To assess the ability or capacity of a process is to know the extent of natural variation of this quality for a given feature, which allows to know to what extent this characteristic is satisfactory (meets specifications). It is a quality characteristic of a product or output variable of a process (Gutiérrez & De la Vara, 2006). In this research, this was evaluated as output variable production level, considering that variable a critical feature of the quality of the manufacturing process. To measure the ability of the process in the system of textile production, capacity indicator Cpi shown in Equation (3) was used. A bigger indicator variable is better, because a greater value than a minimum is desired (desired production goal).
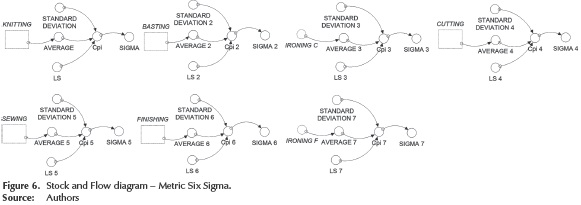
In each of the departments of the process of knitting, the metric Six Sigma was used; it was included in the Forrester diagram as shown in Figure 6, to subsequently perform the simulations and thereby assess the ability of each Department.
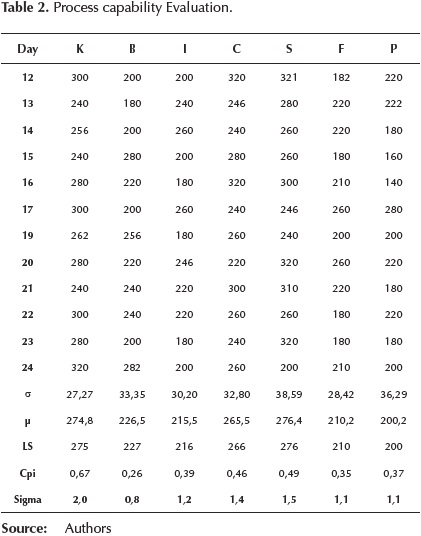
Capacity Evaluation: The proposed dynamic model was validated in a textile company dedicated to the manufacture of clothing, located in the southern state of Guanajuato, Mexico. Production levels were evaluated for each department; in the period from 12 to 24 August 2013, the capacity evaluation is presented in Table 2, the data shown are the amount of knitwear. K (knitting), B (basting), I (iron), C (canvas), S (sewing), F (finishing) and P (packing).
Phase 3 Analyze
During the phase of analysis, the focus is on finding the root cause (Gupta, 2004). Analyze the data and the process for determining the root causes so it does not function as is desired (Newton, 2003).
Globally, the process has a 1,3 sigma level, indicating that the process has low capacity to meet the lower specification and requires modifications to achieve a satisfactory level. It is necessary to analyze the system through simulation in order to identify issues affecting process performance. With the simulation tool it is possible to anticipate the actions of improvement or change in the parameters necessary to increase capacity when required by management. By simulating the dynamic model, the behavior of output levels of each department was analyzed; in the case of knitting, it was considered lower specification 220 garments, with a standard deviation of 27,2. The behavior is shown in Figure 7. The line 1 represents the production levels for 12 runs, the line 2 represents the desired goal and line 3 is the level of sigma obtained in each run.
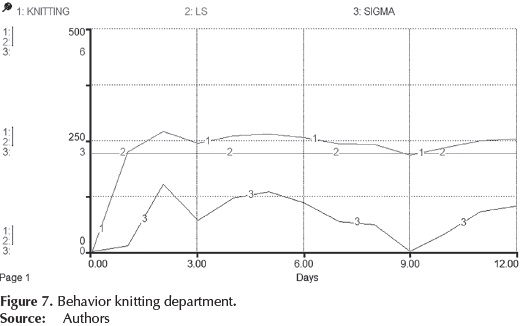
It can be observed that the knitting department achieves the desired production goal (lower specification) beginning in the first day and stays that until the end of the simulation. However, the level of Sigma is located about 1,0 in most of the run, the second run only in the capacity of the department has a better performance with a level of 1,78 sigma. It is necessary to establish appropriate operational policies and reduce variability in production levels.
Phase 4 Improve
This phase consists of the development and selection of optimal solutions for better results and higher performance (Gupta, 2004). After analyzing the behavior of the system and the variables that have the greatest influence on performance, it was conducted sensitivity analysis.
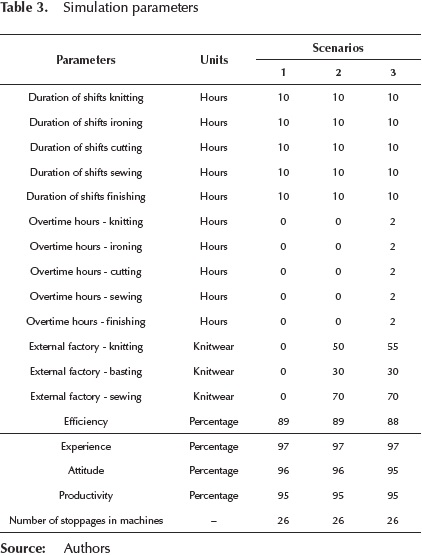
Sensitivity analysis: Through the sensitivity analysis the dynamic model is validated and scenarios are created to study the response of the model to them and to establish appropriate trading strategies in the production system. Three scenarios were created by modifying the values of model parameters to analyze and understand the behavior of production levels to these changes. (See Table 3).
In the case of textile production system, Demand is characterized by the spring-summer season (low demand) which covers the months from January to June. During this season, departments work only one shift. In the case of the autumn-winter season (high demand) comprising July to December, departments work two shifts and sometimes, they use external factories and overtime hours.
The scenarios were simulated in the Software Stella 12 days considered (runs) and as output variable the quantity of clothing. Sensitivity analysis allows management to establish which scenario produces considerable effects to achieve the desired goal of production and improved process performance.
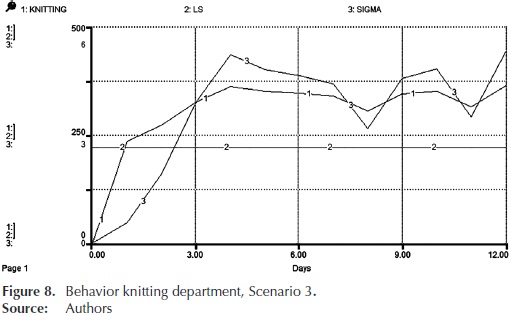
For scenario 1, it is considered the current capacity (resources available from the factory), in scenario 2, in addition to the current capacity external factories are used. In the case of knitted fabrics and sewing are areas that since the concept of synchronous manufacturing are considered restrictive resources capacity, so for this simulation parameters of external factory knitting, sewing and a second external factory basting added. Finally, on stage 3, the goal is to make runs with factory capacity, use external factories and add overtime hours in the majority of departments. After analyzing the results of the simulation of the three scenarios, scenario 3 improves the performance of the production process in the majority of departments.
In the graph of Figure 8, it is shown the behavior of knitting; where production levels (line 1) comply with the lower specification (line 2) significantly from the second day with an oscillatory behavior. In terms of evaluation parameters scenario 3, the average capacity of this department during simulation is 3,8 sigma (line 3), this indicates that the process is partially adequate and requires strict control. However, this scenario presented the best performance results throughout the process. Therefore, the decision was made to validate the parameters of this scenario.
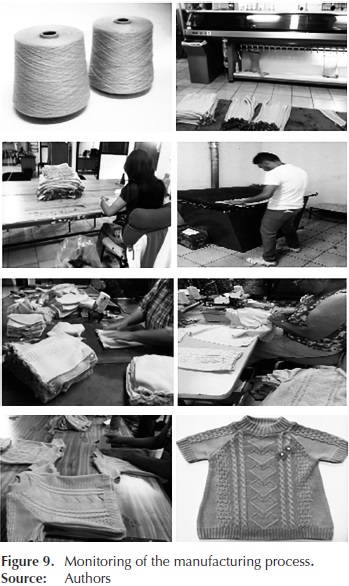
Validation: The proposed model is validated considering the values of the parameters of scenario 3. The implementation was carried out during the period of 2013-2015 with high demand. In Figure 9 is shown monitoring operations in the manufacturing process.
Results
In Table 4 the generated output levels from 10 to 22 August 2015 and the evaluation of the ability in terms of sigma index are presented.
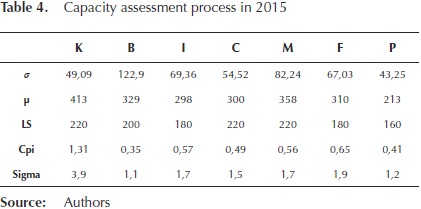
Table 5 presents a comparative in assessing the ability of the textile process. The departments that show a significant increase in the index sigma are the knitting department, ironing department, and finishing department. Globally, there is an increase in the capacity of the process, from an average of 238 to 317 garments per day. Therefore, an increase of 1,3 to 1,9 sigma was achieved, showing that the model helps to increase the level of the index sigma.
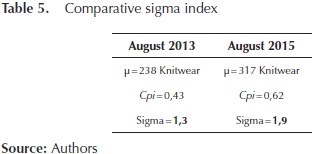
This represents a better performance contributing to meet production goals of each department and the customer delivery dates. The sigma index increased, however it is necessary work on strategies to further improve the process to a higher level, pass four to six sigma requires five years of hard work (Gutiérrez & De la Vara, 2006).
Phase 5 Control
In the final phase of the methodology, a system which maintains the performance improvements at the desired level is designed (Gutiérrez & De la Vara, 2006). It is required to establish policies to ensure that the process continues to operate efficiently in order to be increasing level performance.
Conclusions
The approach proposed in this research about the use of the tool system dynamics to comply with the phases of the DMAIC methodology, shows that it is possible to improve the performance of a manufacturing system and, in the same manner, using the dynamic model as a strategic planning tool for better decision making.
In the first phase was defined the problem, collecting data, selecting the model variables and through the mental map was elaborated a causal diagram to determine how the variables interact. In the second phase, the dynamic model of the production system was formulated with a holistic approach, consisting of ten balancing loops where the desired production levels are controlled, and two reinforcing loops where it is possible to accumulate certain amount of material. With the simulation of dynamic model was possible to identify the behavior of the process. The utilization of Six Sigma metrics allowed evaluating process performance. In the third phase, was carried out the analysis of the results on the behavior and performance of the process.
In order to comply the fourth phase, a sensitivity analysis which was validated model was carried out, three scenarios were created by choosing the highest performance to further validate the dynamic model in a textile company in southern Guanajuato. With the validation, it is verified that the model is useful for improving performance in the capacity of textile process and allows to obtain a learning process to establish operating policies in the last phase of the methodology. As future work, it is considered to develop a model of systems dynamics of the supply chain of the company, analyzed through the approach of Six Sigma methodology.
References
Baeza, R., & Vázquez, J. A. (2014). Transition from a predictive multiple linear regression model to an explanatory simple nonlinear regression model with higher level of prediction: A systems dynamics approach. Revista Facultad de Ingeniería Universidad de Antioquia, 71, 59-71. [ Links ]
Campuzano, F., Martínez, E., & Ros, L. (2010). Traditional and collaborative supply chains: Analysis of its influence on the demand variability management. Dyna, 85(1), 33-40. [ Links ]
Chan, T., Usubamatov, R., Amin, M. F., Kin, L., Keat, T., & Syahril, M. (2014). Parameters Investigation of Mathematical Model of Productivity for Automated Line with Availability by DMAIC Methodology. Journal of Applied Mathematics, 2014, 1-7. DOI: 10.1 155/2014/206717. [ Links ]
Delgado, C. A., Arango, S., & Romero, A. (2014). A system approach to analyze the productivity of a Colombian gold mining process. Revista Facultad de Ingeniería Universidad de Antioquia, (72), 173-185. [ Links ]
Felizzola, H., & Luna, C. (2014). Lean Six Sigma in small and medium enterprises: a methodological approsach. Ingeniare. Revista Chilena de Ingeniería, 22(2), 263-277. [ Links ]
Gijo, E. V., & Scaria, J. (2014). Process improvement through Six Sigma with Beta correction: a case study of manufacturing company. The International Journal of Advanced Manufacturing Technology, 71, 717-730. DOI: 10.1007/s00170-013-5483-y. [ Links ]
Gupta, P. (2004). Six Sigma Business Scorecard. USA: McGraw-Hill. [ Links ]
Gutiérrez, H., De la Vara, R. (2006). Control Estadístico de Calidad y Seis Sigma. México: McGraw-Hill. [ Links ]
Gygi, C., Decarlo, N., & Williams, B. (2005). Six Sigma For Dummies. USA: Wiley Publishing. [ Links ]
Juran, J. M. (1969). Managerial Breakthrough: A New Concept of the Manager's Job. USA: McGraw-Hill. [ Links ]
Kovach, J., & Fredendall, L. (2014). Managerial Impacts of Learning and Continuous Improvement Practices. The Journal for Quality and Participation, 37(2), 25-28. [ Links ]
Linderman, K., Schroeder, R., Zaheer, S., & Choo, A. (2003). Six Sigma: a goal-theoretic perspective. Journal of Operations Management, 21(2), 193-203. [ Links ]
Mikati, N. (2010). Dependence of lead time on batch size studied by a system dynamics model. International Journal of Production Research, 48(18), 5523-5532. DOI: 10.1080/00207540903164628. [ Links ]
Newton, P. (2003, July). System Dynamics in Six Sigma Practice. 21st System Dynamics Conference, New York, USA. [ Links ]
Nordstrom, F., Gawad, P. & Nowarski, A. (2006). La ciencia de la fabricación. Revista ABB, 1, 6-11. [ Links ]
Ocampo, J., & Pavón, A. (2012, July). Integrando la Metodología DMAIC de Seis Sigma con la Simulación de Eventos Discretos en Flexsim. Tenth LACCEI Latin American and Caribbean Conference for Engineering and Technology, Panama City, Panama. [ Links ]
Peña, G. (2003). Dinámica de Sistemas y Análisis Cualitativo Matemático en Modelos de Gestión de la Producción. (Ph.D. Thesis). Recuperado de http://fondosdigitales.us.es/tesis. Universidad de Sevilla, Spain. [ Links ]
Pyzdek, T. (2003). The Six Sigma Project Planner. USA: McGraw-Hill. [ Links ]
Richmond, B. (2005). Systems Thinking and the STELLA Software, in an Introduction to Systems Thinking. USA: Isee Systems. [ Links ]
Senge, P. (2005). La quinta disciplina: el arte y la práctica de la organización abierta aprendizaje. Argentina: Granica. [ Links ]
Sterman, J. (2000). Business Dynamics: Systems Thinking and Modeling for a Complex World. USA: McGraw-Hill. [ Links ]
Van, D. J., & Pretorius, L. (2014). A Systems Thinking Approach to the Sustainability of Quality Improvement Programmes. South African Journal of Industrial Engineering, 25, 71-84. DOI: 10.7166/25-1-696. [ Links ]
Yuniarto, H. A., & Elhag, T. MS. (2008, July). Enhancing Six Sigma with Systems Dynamic. World Congress on Engineering, London, UK. [ Links ]
Zu, X., Fredendall, L. D., & Douglas, T. J. (2008). The evolving theory of quality management: The role of Six Sigma. Journal of Operations Management, 26, 630-650. DOI: 10.1016/j.jom.2008.02.001 [ Links ]

