


Servicios Personalizados
Revista
Articulo
 Inglés (pdf)
 Articulo en XML
 Referencias del artículo
 Enviar articulo por email
Indicadores
-
 Citado por SciELO
 -
 Accesos
Links relacionados
-
 Citado por Google
 -
 Similares en
SciELO
Similares en
SciELO -
 Similares en Google
Compartir

 Permalink
Ingeniería e Investigación
versión impresa ISSN 0120-5609
Ing. Investig. vol.37 no.1 Bogotá ene./abr. 2017
https://doi.org/10.15446/ing.investig.v37n1.55444
DOI: http://dx.doi.org/10.15446/ing.investig.v37n1.55444
A Linear Criterion to sort Color Components in Images
Un criterio lineal para ordenar los componentes de color en imágenes
Leonardo Barriga-Rodríguez1, Hugo Jiménez-Hernández2, Alberto Soto-Cajiga3, Luciano Nava-Balanzar4, José-Joel González-Barbosa5, Alfonso Gómez-Espinosa6, and Carlos Pedraza-Ortega7
1 Ph. D in Mechatronic, CIDESI, México, Querétaro. Email: leobar94@gmail.com;
2 Ph. D. in Computer Vision, CIDESI, México, Querétaro. Email: hugojh@gmail.com;
3 Ph. D in Mechatronic,, CIDESI, México, Querétaro. Email: jsoto@cidesi.edu.mx;
4 Ph. D in Mechatronic,, CIDESI, México, Querétaro. Email: lnava@cidesi.edu.mx
5 Ph. D in Computer Vision, Instituto Politécnico Nacional, México, Querétaro, Email: jgonzalezba@ipn.mx
6 Ph. D in Engeniering, ITEMS-Queretaro, México, Querétaro, Email: agomeze@itesm.mx
7 Ph. D in Computer Vision, UAQ, México, Querétaro. Email: caryoko@yahoo.com
How to cite: Barriga-Rodríguez, L., Jiménez-Hernández, H., Soto-Cajiga, A., Nava-Balanzar, L., González-Barbosa, J., Gómez-Espinosa , A. and Pedraza-Ortega, C. (2017). A Linear Criterion to sort Color Components in Images. 37(1), 91-98. DOI: 10.15446/ing.investig.v37n1.55444
Received: January 28th, 2016 Accepted: January 23rd, 2016
ABSTRACT
The color and its representation play a basic role in Image Analysis process. Several methods can be beneficial whenever they have a correct representation of wave-length variations used to represent scenes with a camera. A wide variety of spaces and color representations is founded in specialized literature. Each one is useful in concrete circumstances and others may offer redundant color information (for instance, all RGB components are high correlated). This work deals with the task of identifying and sorting which component from several color representations offers the majority of information about the scene. This approach is based on analyzing linear dependences among each color component, by the implementation of a new sorting algorithm based on entropy. The proposal is tested in several outdoor/indoor scenes with different light conditions. Repeatability and stability are tested in order to guarantee its use in several image analysis applications. Finally, the results of this work have been used to enhance an external algorithm to compensate the camera random vibrations.
Keywords: Linear sorting criterion, color sorting, color analysis, camera vibrations.
RESUMEN
El color y su representación juegan un papel fundamental en el proceso de análisis de imagen. Varios métodos pueden ser beneficiosos siempre que tengan una representación correcta de las variaciones de longitud de onda usadas para representar la escena. Una amplia variedad de espacios y representaciones de color se basa en la literatura especializada. Cada uno de ellos es útil en circunstancias concretas y puede ofrecer información de color redundante (por ejemplo, todos los componentes RGB están altamente correlacionados). En este trabajo se identifica y clasifica cuál componente ofrece la mayor cantidad de información acerca de la escena, a partir de varias representaciones de color. Este enfoque se basa en el análisis de las dependencias lineales entre cada canal y la implementación de un nuevo algoritmo para clasificar los componentes en base a la entropía. La propuesta se pone a prueba en varias escenas al aire libre y en interiores con diferentes condiciones de luz. La repetitividad y la estabilidad son probadas para garantizar su uso en aplicaciones de análisis de imágenes. Finalmente, los resultados de este trabajo son usados para mejorar un algoritmo externo para la compensación de vibraciones.
Palabras Clave: Criterio de clasificación lineal, clasificación de color, análisis de color, vibración de cámaras.
Introduction
A camera is an array of photo-sensor, which codes certain wave-lengths as intensities. The wave-lengths intensities typically are encoded as color spaces, which are conformed by components. This coding has meaning relating to physical/theoretical foundation of coding. This coding results useful because it is helpful to formulate several criteria to segment and cluster the color space.
Color analysis consists in determining which wavelengths are useful to represent information attending the coding color space. Then, color space is defined as the combination of a basic wavelengths set used to express colors. The nature of wavelengths used as the basis and physical/theoretical constraints define the properties of the space, such as the number of colors that can be represented, or the operations that can be performed. Common color spaces include RGB (Süsstrunk, Buckley & Swen, 1999), CMYK (Gatter, 2005), HSL (Levkowitz & Herman, 1993), to mention a few. The application of each one can be found in several works (Vartak & Mankar, 2013; Ramanath, S., Yoo, & Drew, 2005; Bhattacharayya, 2011, and Yang, Liu, & Zhang, 2010). They use color space properties focusing in a particular task, exploiting characteristics that can be used for own purposes. The RGB color space represents a color standard used by several devices. Physically, they use sensors calibrated to respond to red, blue and green wavelengths, and several add an extra color to increase slightly wavelength sensitivity. By determining the quantity of information through entropy measurement, the importance of each orthogonal component used, constituted of several color components, can be detected.
In this work, an approach to identify which component provides more information, based on its contribution, in an orthogonal space constituted by several color components, is proposed. This component offers best information to dynamically select features for camera stabilization algorithm (Jiménez & Salas, 2011). The discrimination process quantifies the contribution of each color component from the main orthogonal components. Finally, the physical color component that represents the most significant projection of orthogonal space of several color components might represent the best physical component.
Space Color Foundations
Basic components used to represent tonalities conforms a basis of a color space. A color space is a notation to specify possible colors. Different bases are mixed as tuples to represent a specific tonality. Each component represents any value of a basic component. A color space S is denoted by a set of basic components C1...., Cn, where n is the number of components and it usually takes 3 or 4 values. Each C represents a possible value of particular component. Typically, each component is encoded in [0,1] or [-1,1] interval. Each component domain is continuous, but physically is implemented to fixed domain-resolution representations. A specific color is represented as a mixture of basic components. Ideally, basic components must be uncorrelated and independent. In practice, the amount of color-mixtures that conforms a scenario makes complicated this constraint. Commonly, color spaces can be classified in three main categorizations (Asmare, Asirvadam, & Iznita, 2009; Ebied, 2012; Palus, 1998 and Wei, Zhao, & Zhou, Dec. 2013): (A), which include the RGB color space, based upon the component colors theory and phenomenal color spaces. These color spaces are created based on the HSV properties (Palus, 1998).(B): This categorization includes the color spaces adopted from TV systems (YUV, YIQ), photo systems (Kodak Photo YCC) and printing systems (CMY(K)) (Gatter, 2005),. (C) are spaces proposed by the CIE and have some high importance properties like device-independency and perceptual linearity (CIE XYZ, Lab and Luv) (Palus, 1998).
The above categorization is based on physical foundations of color. However, according to the current technologies some extra spaces or coding color schemes are added (Kekre & Sonawane, 2014).
Finally, according to aforementioned paragraphs, and the aim of this work, it only takes a set of fixed color spaces and coding schemes to represent images. The spaces and coding schemes focused on this work include RGB, HSV, YCbCr and NTSC, mainly (Fairchild, 2013).
Dependence as a Measure of Information
The three following sections provide the foundation for color components as a sorting linear component problem, which represents the main contribution of this work. Given a set of n different information sources expressed as x1,...,xn, the dispersion of raw data can be represented as an orthogonal space. However, this space does not necessarily follows a physical interpretation and it does not need strictly n different components to be represented. This is since there are several redundant information sources. The orthogonal space is represented by un orthogonal components. At this point, color components are considered as a mixture of principal orthogonal components of this space as follows: 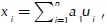 where each a1 is a weighted constant, related to the contribution of any orthogonal component to a specific information source. In general, the different information sources can be described by an orthogonal space generated as follows:
where xi denotes a particular information source, u. an orthogonal component and a. a number vector such that contains the weights that compose each information source. For all individual vector-products, ai[u1 ...ut]T would benefit those which contain the majority of information. Thus, the problem seems similar to Principal Component Approach PCA, (Lay, 2003 and Good, Kost, & Cherry, 2010). However, note that the aim of our problem consists of determining which physical component x is the most important, not to do a reduction of orthogonal space with the projection of most important information. It is necessary to define a criterion to sort physical components x.that contain the most suitable information.
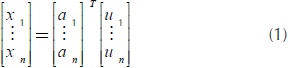
Let it be X the matrix compounded by different information sources with m samples. The X matrix can be rewritten as X = UΣVT. Diagonal values of Σ determine the rank of the matrix and the weighted importance of orthogonal components that conform X (Lay, 2003). Assuming that £ contains the eigen-values sorted from the highest to the lowest, singular value decomposition SVD (Lay, 2003) can be applied to determine a criterion to weight which physical information sources are more relevant. For notation, we denote the i - th eigen-value from Σ as σi. The amount of information is considered as a normalized contribution of each orthogonal component space un. This information measure has one inconvenient: it only measures orthogonal components; but it does not say explicitly how to verify the contribution in physical variables. This becomes difficult because each physical variable is composed of at least one or several orthogonal components, as demonstrated by figure 1. Please note that whenever the orthogonal components correspond in an ideal case with any source of information, it is easier to determine which information sources become with higher importance. However, when they are not aligned with the components, as usually happens, the calculation becomes complicated since the orthogonal components are constituted from a mixture of different information physical sources.
Weighting Linear Components
Once we have a way to separate orthogonal components, a weighting process is needed to establish an order relationship. The Σ matrix of eigen-values determines the importance of orthogonal structure constituted by all information sources. Consider at this point that in the rank(M) = n' with n'< n there are certain degrees of redundancy in x 1,...,x n information sources. However, it is not possible to separate orthogonal basis of raw data expressed in X; but it is possible to detect its effects and contributions on physical variables. In other words, if an x. component contributes with different information to the system, then the use of x.will affect the rank(X) in the number of independent components in U space.
Adding the xn+1 information source, which is dependent upon previous sources, does not affect the rank (X). When information in xn+1 is independent, we have σn+1 > 0, where σn+1 magnitude tell us the amount of new information in the system.
Sorting Components
Finally, using above weighting criterion an algorithm to sort linear component is proposed as follows. For n information sources it is desirable to add a new one from a candidate list of  Furthermore, it is desirable to add those with distinct information, such as is denoted by the max
  contribution under construct a matrix
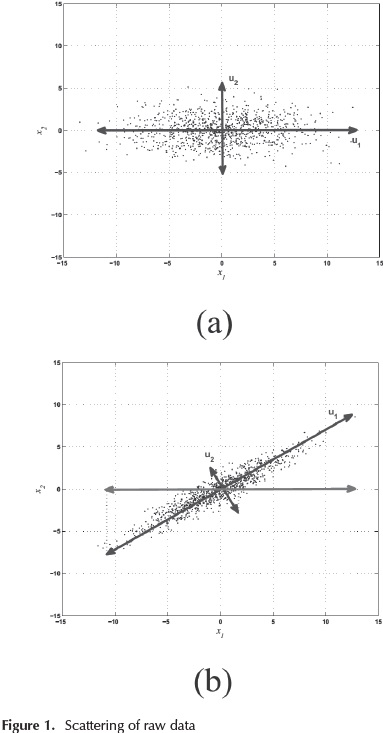
Then, in inverse order, a selection of those physical components that represents the lowest effect in orthogonal space can be iteratively applied. Also, a set of physical information sources  is represented in an Uspace with u1,...,u n orthogonal components. If the information sources are linearly redundant, some components are null. By selecting one physical information source xi, it can be possible to quantify the effect in the orthogonal space U and relate with the importance to constitute it. This is, if the information source x1 does not contribute to the rank of X, it does not change. In case it contributes, the change of last normalized eigen-value from reduced matrix to the original matrix represents the contribution of use (or not) the variable xi in the system. Wrapping up, a measure to quantify the difference of information in a given matrix X against its reduced form X* under discard the i - th physical component, in terms of its eigen-values, is expressed by:
which quantify how a particular component x. contributes with the linear system for a given matrix X and reduced matrix X* and σi and  eigen-values respectively. Observe that this expression represents the difference of current information that is included in the reduced matrix. This is, whenever Q(X,X*) is greater than 0 means that orthogonal space in reduced matrix is better scattered that original matrix X, i.e. discarded color component did not contribute with information to the image. Consequently, values lower than 0 means that X contains more information than reduced matrix means that discarded color component have important information. Then, the process of discarding xi components can be considered as the iterative process of discarding x.components from Xsuch that X* being a matrix without x. that maximizes max Q(X,X*).
The algorithm with a procedure to select and sort a set of information sources according to each datum's contribution to the orthogonal space is shown.
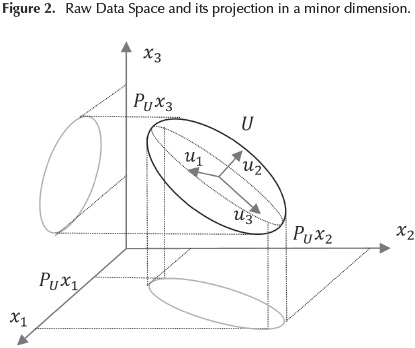
This is shown in Figure 2, where each component xi composed of several orthogonal components as a linear combination  is observed. To exclude any information source from orthogonal space a projection is made in the minor space n - 1. Those components with less effect in orthogonal space are discarded. Please note that this approach is appreciated as complement to the PCA approach, in which a set of variables is sorted according their contributions to an orthogonal space. These sorts generate a projection with most important orthogonal components, with the lack of physical significance to our problem.
Algorithm 1. Selection of components with lowest contribution in an orthogonal space.
Component Selection Algorithm
Inputs: A list of n information sources expressed as Outputs: A sorted list of  components.
- From n information sources, a matrix X is built as follows
 where each
  represents k measures from information source i - th. All information sources have the same number of samples.
 - Compute singular value decomposition of X = UΣVT.
- Build a matrix
 ü = {xi*,...,X*_1}, with the reduced matrices from X. The reduced matrix is a matrix
  such that one component xi has been deleted. Consider an empty list
- For all matrices, factorize each one into
 matrices.
 - Consider all
 eigen-value and determine which is the minimum physical variable affectation (see eqn (2)).
 - Select the i - th physical to be removed and updated

4. Repeat until there are no physical variables left to discard.
Sorting Color Components
The contribution of each component against to the others is measured due to a C* orthogonal space. This space is conformed to all information of each one pixel encoded in the different spaces. Therefore, a particular pixel I(xi) as vector ci is created with the form  or n different spaces. In this way, C* is created for all pixels belonging to the image as follows
  for each position
  Matrix C* represents pixel data which are helpful in knowing which ci physical components have more information.
Sorting Color Components and Meaning
Given a matrix C* that represents image evidence encoded in different color spaces, C* is expressed as  where each c represents a different component constituted from several forms to represent the color information. Assuming that, in an orthogonal space U truly defines different variables, it can be feasible to detect which physical components are the most important. Observe that the most important color component corresponds to the maximum orthogonal space projection. The analysis of eigen-values in C* shows that the information is only distributed in a few orthogonal components. This projection is dependent upon scene conditions and it might vary in different situations.
Algorithm 1 is applied to the matrix C*. Where matrix S denotes the sorted linear components from C*. In this case, we can select m primary components which correspond to those most suitable to be analyzed in sense they contain a projection from orthogonal space that concentrate the most important components. Note that the information in C is desirable to be centered and normalized in range.
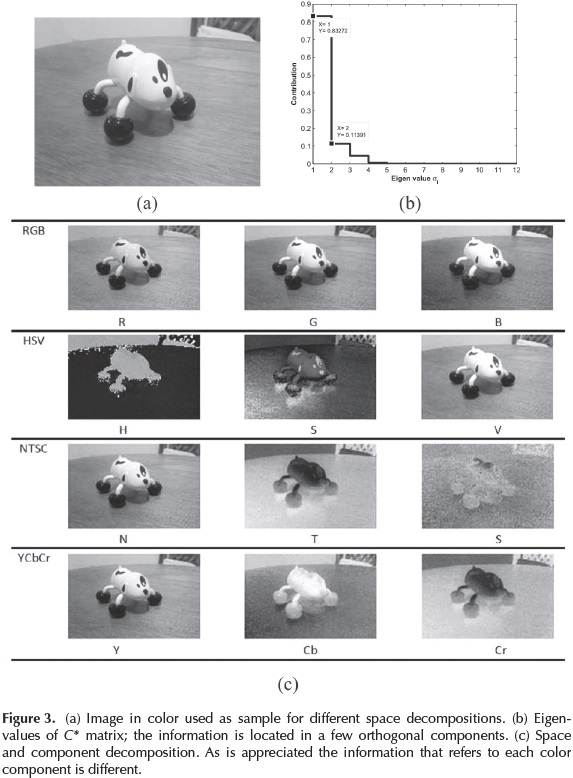
An example is shown in Figure 3. The channel decomposition in all different spaces is shown in figure 3(c). Several components of color are visually closely similar or maintain the same structure (as is found with all RGB components, V from HSV, Y from NTSC and Y from YCbCr). In the same way, Figure 3 (b) presents a graph of normalized eigen-values, that shows evidence that there is a compact representation with few orthogonal components.
Experimental Process
In this section, the new proposal is tested using images from database. The images are taken from outdoor and indoor scenes. All images are encoded in the following color spaces and schemes: RGB, HSV, YCbCr and NTSC, resulting in twelve color components (but not limited). Next, the experimental process to validate the proposal is constituted of three main stages:
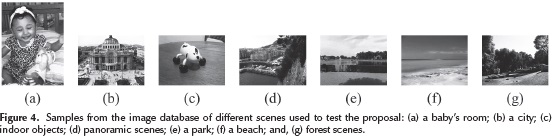
The validation process is performed with a set of several images of outdoor/indoor scenes. The algorithm is applied to the tested image database (see Figure 1). Then, a set of Gabor filters is used to detect different frequencies that conform the texture with the aim to visually show that selected component has more texture information rather other discarded (Kumar & Pang, 2002; Pakdel & Tajeripour, 2011 and Jing, Yang, Li, & Kang, 2014). Note that for all image used a Gaussian Filter is used to dismiss noise effects. Finally, the algorithm is used to improve the algorithm presented in (Jiménez & Salas, 2011) to stabilize outdoor camera.
Analysis of results and Discussion
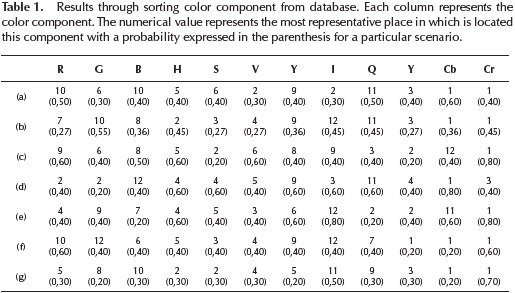
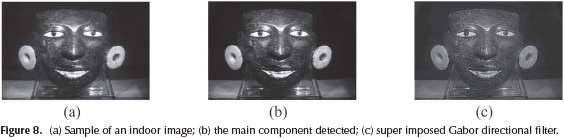
The most representative color component depends upon luminance factors surrounding the scene from which the picture was taken. The dominant component depends greatly upon the physical characteristics of colors in tested scenes (see Table 1). The main component selected corresponds to the most probable color component under apply the proposal in all images from database. These results, as is appreciated, are useful since they provide a criterion to automatically select which component (from a linear mixture) for a tested scenario is more reliable to be used. As complementary, the proposal described returns all components sorted according to the linear projection in its rank; which represents a sorting linear criterion applied to sort color components. So we need to note that the more representative components are selected according to the amount of information contained. Then, for small contribution components, it is necessary be cautiously since they are affected by noise effects. In these situations previous filtering process may affect the ordering, especially in noise images. With Gabor filters we notice that the best component selected represent the component in which is easier to appreciate borders and texture information, which make suitable the proposal to select a better image representation to extract features (as Harris, or SIFT to mention a few) (see Figure 8).
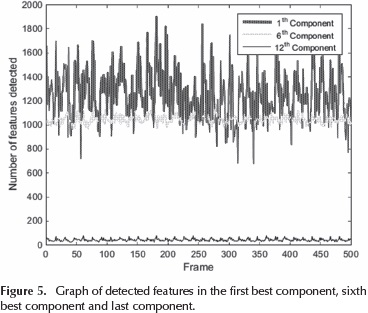
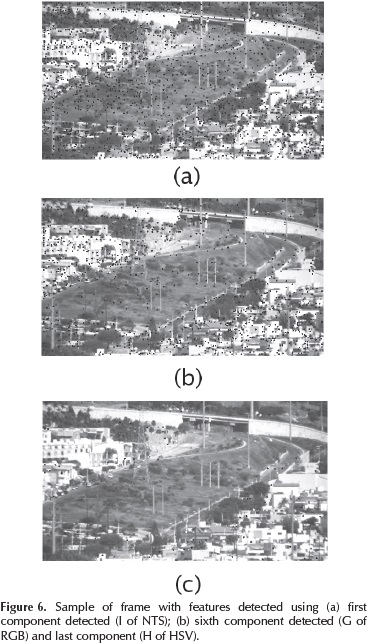
Finally shaking and vibration of outdoor cameras have been improving because the number of distinctive features is increasing, and consequently, the algorithm for camera stabilization (Jiménez & Salas, 2011). In Figure 5, we can appreciate the number of features detected frame by frame in the most important component detected, the sixth and last one. As is appreciated, the number of features corresponds to the place ordered by the algorithm. Graphically in Figure 6 a sample of features detected are shown.
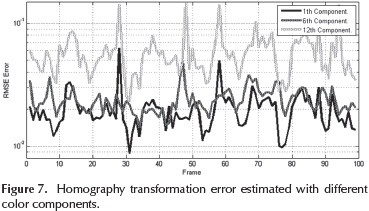
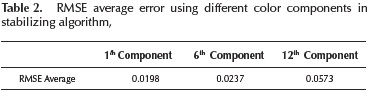
To conclude, we present RMSE error of fitting a homography transformation as is commented in (Jiménez & Salas, 2011), In Figure 7 is graphically appreciated the place of occupied component match with the error degree in the stabilization algorithm; for better appreciation, y axis is drawn in log scale. Quantitatively, the results of RMSE average error are shown in Table 2 (error is measured in pixels units). Both results confirm that the algorithm to sort color components effectively help to select those components which have more information.
Conclusion
In this paper, we present a criterion to evaluate the amount of information encoded in an image. This criterion consists in discovering which physical variable contains more information. The process consists of discovering an orthogonal space, and how it is conformed due to physical variables. This approach provides a good criterion for selecting the component with most significance. In particular, the paper focused on sort the color components of an image represented in several spaces. The computed order relation might vary due to the number of components used, and noise effects in raw data.
Acknowledgements
We thank all comments done by the reviewers. These comments have improved the paper. We thank CIDESITM and ASA-CONACYT founds (project 208466) which provide all resources needed to this research.
References
Asmare, M., Asirvadam, V., & Iznita, L. (2009). Color Space Selection for Color Image Enhancement Applications. (págs. 208-212). IEEE. doi:10.1109/ICSAP.2009.39. [ Links ]
Bhattacharayya, S. E. (2011). A Brief Survey of Color Image Preprocessing and Segmentation Techniques. (1), 120-129. DOI:10.13176/11.191. [ Links ]
Ebied, H. (2012). Kernel-PCA for face recognition in different color spaces. (págs. 201-206). Cairo: IEEE. DOI:10.1109/ICCES.2012.6408513. [ Links ]
Fairchild, M. D. (2013). Wiley. [ Links ]
Gatter, M. (2005). Laurence King Publishing. [ Links ]
Good, R., Kost, D., & Cherry, G. (2010). Introducing a Unified PCA Algorithm for Model Size Reduction. (2), 201-209. DOI:10.1109/TSM.2010.2041263. [ Links ]
Grest, D., Frahm, M., & Koch, R. (November, 2003). A Color Similarity Measure for Robust Shadow Removal in Real Time. En (págs. 253-260). München, Germany: Aka GmbH. [ Links ]
Grigorescu, S., Petkov, N., & Kruizinga, P. (2002). Comparison of texture features based on Gabor filters. (10), 1160-1167. DOI:10.1109/TIP.2002.804262. [ Links ]
Jimenez, H., & Salas, J. (2011). Una estrategia para la selección dinámica de características aplicada a la estabilización de secuencias de imágenes. (4), 351-363. DOI:10.13053/cys-14-4-1281. [ Links ]
Jing, J., Yang, P., Li, P., & Kang, X. (2014). Supervised defect detection on textile fabrics via optimal Gabor filter. 40-57. DOI:10.1177/1528083713490002. [ Links ]
Jipsen, P., & Rose, H. (1992). Springer-Verlag Berlin Heidelberg. doi:10.1007/BFb0090224. [ Links ]
Kekre, H., & Sonawane, K. (2014). Comparative study of color histogram based bins approach in RGB, XYZ, Kekre's LXY and L'X'Y' color spaces. , (págs. 364-369). DOI:10.1109/CSCITA.2014.6839288. [ Links ]
Kumar, A., & Pang, G. (2002). Defect detection in textured materials using Gabor filters. (2), 425-440. DOI:10.1109/28.993164. [ Links ]
Lay, D. C. (2003). (Vol. 3). Addison-Wesley Publishing Company. [ Links ]
Levkowitz, H., & Herman, G. (1993). GLHS: A Generalized Lightness, Hue, and Saturation Color Model. (4), 271-285. DOI:10.1006/cgip.1993.1019. [ Links ]
Mojsilovic, A., Hu, J., & Soljanin, E. (2002). Extraction of perceptually important colors and similarity measurement for image matching, retrieval and analysis. (11), 1238-1248. DOI:10.1109/TIP.2002.804260. [ Links ]
Ngau, C., Ang, L.-M., & Seng, K. P. (Aug. 2009). Comparison of Colour Spaces for Visual Saliency. , págs. 278-281. Hangzhou, Zhejiang: IEEE. DOI:10.1109/IHMSC.2009.193. [ Links ]
Pakdel, M., & Tajeripour, F. (2011). Texture Classification Using Optimal Gabor Filters. (págs. 208-213). IEEE. DOI:10.1109/ICCKE.2011.6413352. [ Links ]
Palus, H. (1998). Representations of colour images in different colour spaces. En (págs. 67-90). Springer US. DOI:10.1007/978-1-4615-5779-1_4. [ Links ]
Ramanath, R., S., W. E., Yoo, Y., & Drew, M. S. (2005). Color image processing pipeline. (1), 34-45. DOI:10.1109/MSP.2005.1407713. [ Links ]
Shi, Y., Ding, Y., Zhang, R., & Li, J. (Feb. 2009). Structure and Hue Similarity for Color Image Quality Assessment. (págs. 329-333). Macau: IEEE. doi:10.1109/ICECT.2009.1 16. [ Links ]
Süsstrunk, S., Buckley, R., & Swen, S. (1999). Standard RGB Color Spaces., págs. 127-134. Obtenido de http://infos-cience.epfl.ch/record/34089/files/SusstrunkBS99.pdf. [ Links ]
Vartak, A. P., & Mankar, V. (2013). Colour image segmentation: A survey. (2), 681-688. [ Links ]
Wei, X., Zhao, M., & Zhou, W. (Dec. 2013). Perception Estimation of Noising Distortion in Color Components. (págs. 880-883). Toronto, ON: IEEE. DOI:10.1109/IMSNA.2013.6743418. [ Links ]
Wyszecki, G., & Stiles, W. S. (2000). Wiley-Interscience; 2 edition. [ Links ]
Yang, J., Liu, C., & Zhang, L. (2010). Color Space Normalization: Enhancing the Discriminating Power of Color Spaces for Face Recognition. , 1454-1466. DOI:10.1016/j.patcog.2009.1 1.014. [ Links ]

