


 Inglés (pdf)
 Articulo en XML
 Referencias del artículo
 Enviar articulo por email
 Citado por SciELO
  Citado por Google
  Similares en
SciELO
Similares en
SciELO  Similares en Google
 Permalink
Introduction
Basil (Ocimum basilicum L.) is an aromatic plant belonging to the Lamiaceae family that is used in the food, pharmaceutical, cosmetics, ornamental and pesticide industries. This plant is cultivated in Mediterranean regions and tropical and subtropical areas of Asia, Africa and South America. In Colombia, basil crops of the both Genovese and F1 Nufar Hybrid varieties have been reported primarily for use in the food as well as in cosmetic industries.
Few studies are available concerning the cultivation of basil in tropical regions in terms of water management, the calculation of irrigation depths and the plant response to water stress. The lack of information about the crop coefficient (Kc) of these plants and the use of Kc values determined for non-tropical conditions have led to the use of inadequate water irrigation depths that unfavourably affect the efficiency of both water management and fertilizer, leading to environmental pollution problems.
Water management in basil cultivation has been assessed based on the known field capacity (FC) moisture content of the soil and water balance calculations. Barroso et al. (2004) found that a good biomass performance and acceptable behaviour of the water state of the plant were obtained when 75% of the evaporation-precipitation balance of the week prior to irrigation was used. However, Ekren et al. (2012) found that the best agronomic responses of the plant, such as height and dry weight, were obtained when 125 % of the field capacity of the soil was used, whereas the oil concentration in the leaves was higher when water stress was present (50% of the FC). For Khalid, (2006), subjecting basil plants to water stress reduced the dry matter crop but increased the concentration of the essential oil components. Bekhradi et al. (2015) found reductions of up to 40 % in dry mass in the Genovese basil crop when using water irrigation depths equivalent to 50% of the FC of the soil. However, agronomic characteristics, such as stem length, foliage area and dry matter, did not exhibit differences for different irrigation water depths (100%, 75% and 50% of the field capacity). This results show that the amount of water irrigation used when cultivating basil depends on the final use intended for the plants, which may be sold fresh, dry or for the extraction of oils.
The objective of this study was to determine the values of the crop coefficient (Kc) for the different phenological stages of basil (Ocimum basilicum L.) and to evaluate this Kc in a potter crop experiment measuring some agronomic variables of basil plant.
Materials and Methods
Experiment 1 Crop coefficient (Kc) determination
This study was performed between January and August of 2015, using commercial basil crops located in Juanchito, Candelaria, Valle del Cauca (Colombia), (N03 26.767' W076 27.551'). The soil taxonomic classification was Flueventic Haplustepts, whose main physicochemical characteristics are shown in Table 1.
Table 1 Physicochemical characterization of the soil with basil crops (Ocimum basilicum L.) in Candelaria, Valle del Cauca Colombia

*Osorio (2014) **Brogowski et al. (2014). O.M. = organic matter; CEC = Cation Exchange Capacity; ECEC = Effective Cation Exchange Capacity; BD = Bulk density.
Source: Authors
The plots were located in the warm climate conditions of the Cauca river valley (Colombia). The climatological conditions were recorded throughout the entire experiment with a portable meteorological station (Davis Vantage pro 2, Davis California, USA), which was installed and calibrated based on the manufacturer's recommendations. The minimum recorded temperature was 17,3 °C, and the maximum was 32,8 °C. These records were compared with those obtained in the nearest climatological station.
Three drainage lysimeters were designed using an aluminium plate with a volume of 0,125 m3. Two diameter holes of 0,08 m were located at depths of 0,10 and 0,15 m to allow the insertion of a time domain reflectometer (TDR) to measure the volumetric water content. A layer of gravel was placed at the bottom of the lysimeter to reduce soil loss; then, the different layers of soil were added to each lysimeter following its natural conditions. A drainage cone was installed at the lower part of each lysimeter and it was connected to a plastic hose; in turn, the plastic hose was connected to a covered container to store the drained water. The volume in the container was subsequently measured.
The lysimeters were installed randomly to cover the whole experimental area. The soil was taken to saturation humidity and allowed to drain for 48 hours to reach conditions close to the FC moisture content (37%). After draining for 24 hours, the TDR equipment was used to measure inside of each lysimeter to calibrate the FC moisture content to the values found in the laboratory. Once the FC moisture content was reached, basil plants with 10 days after germination were transplanted in both the field and the lysimeters. Measurements were taken with the previously calibrated TDR every day to determine the moisture state of the soil. A depletion coefficient of 10% was used based on previous determinations by trial and error.
The experimental plot measured 240 m2. Tilling work was previously performed, including clearing, ploughing and raking. Basil seeds of the Genovese variety were used. The seeds were germinated in a seedbed using the same soil as the substrate. The planting distances were 0,50 m between plants and 0,50 m between furrows. After, the plants were fertilized with an organo-mineral fertilizer at the beginning of transplanting; Monthly applications of 15-15-15 and urea were performed in 0,5 g doses per plant. The amount of each fertiliser was determined based on the soil analysis and the requirements of the crop. For the lysimeters, the fertilizers were diluted in the volume of water used for irrigation prior to application.
Fresh plants were collected from each treatment 73 days after transplant (dat), at beginning of flowering. The dry weight was determined by weighing the cultivated plants after resting them in an airflow oven at 65 °C for 24 hours. The percentage of the dry mass was determined for basil plants cut every 21 days based on the fresh weight and the dry weight of the biomass, which was correlated with water consumption. The water use efficiency (WUE)) was also calculated following the guidelines of Steduto et al. (2012).
A constant record was kept of the different water balance variables to subsequently calculate the water needs of the crop (ETc) in water deep (mm) using Equation (1). The ETc was determined for the crop phenological stages as follows: growth and development (0 - 25 days after transplantation, (dat), maturity (26 - 50 dat) and cultivation and senescence of the plant (51 - 71 dat).

where P is precipitation, R is the water contribution from irrigation, C is the water contribution to the root areas due to capillarity, which was assumed to be zero given that it was a small value in the dimensions of lysimeter compared to the other contributions, ES is the water loss due to runoff, which was also assumed to be zero given that the experiment was performed in a flat area (slope between 1% and 3%) and that the precipitation events that occurred did not lead to runoff in the lysimeter, D is the drained water depth and ΔΗ is the change in the soil moisture content.
The irrigation water depth was calculated based on the volumetric water content and the depth of the roots. After calibrating the TDR, the volumetric water content was measured daily to determine the moisture state of the soil (AH) by applying the necessary irrigation depths to retake the soil to field capacity when a depletion percentage of 10% was encountered. The application of the water depth in the lysimeters was performed manually using a test tube, whereas in the field, it was performed by keeping track of the time of irrigation and the volume of water released by the sprinklers. The drainage water depth was measured daily, and the precipitation was recorded using the portable meteorological station.
The portable climatological station installed near the crop was used to determine the reference evapotranspiration (ETo). This station provided hourly records of the variables used in the Penman-Monteith equation (Allen et al., 2006). The records were kept for a period of three months because this was the time required for the basil plants to reach the necessary maturity to be harvested.
The crop coefficient (Kc) was calculated using Equation (2) with time periods of 2 and 3 days.
The normality of the data was verified using the Kolmogorov-Smirnov test, the Friedman Test was used for verifying that the three lysimeters followed the same distribution. A correlation test was also conducted among the lysimeters using the Spearman test with a significance level of 95%. Finally, regressions were performed between crop coefficients (Kc) by crop stage and time, with a confidence level of 95%, and the confidence intervals were determined for the mean with the same confidence level.
Experiment 2 Crop coefficient evaluation
This experiment was developed between January and April of 2016, in a greenhouse located in Universidad del Valle, Cali, Colombia. The same soil of the experiment 1 was used in this experiment. The commercial basil seeds (variety Genovese) were sown at the beginning of January into peat. When the basil seedlings reach 10 cm in plant height, they were transferred to the experimental pots.
A completely randomized bifactorial design was established with four treatments: two treatments consisted in soil without fertilizer (C) and the other two in fertilized soils with NPK (F). The first treatments, one was maintained at FC based on the weight of the soil (CFC) and the other was calculating water needs with Kc found in experiment 1, which was just 72% of FC (CK).The second treatments were watered in the same way (FFC y FK). There were three replicates by treatment for a total of twelve experimental units. Each experimental unit was a pot (3 kg) and a basil plant.
Fresh plants were collected of each experimental unit and they were dried at 65 °C. The dry mass percentage was calculated from both, fresh and dry weight of leaves and steams. The plant height was measured since soil surface until the highest part of the plant. These variables were determined 76 dat.
Foliar nitrogen (N) was determined by Kjeldahl method, using sulfuric acid and catalysts of cupper and potassium sulphate in digestion and NaOH and boric acid with indicator in distillation.
Some soil variables were determined 76 dat: pH (1:1) and electrical conductivity (EC) (1:2 relation soil: water), following the recommendations of Soil Survey Staff (2014) and WUE Steduto et al. (2012).
The normal distribution of data was verified with the Shapiro Will test and variance homogeneity was determined with the Levene test. A variance analysis was done in order to determine statistical differences among treatments. The Tukey test was used as postanova test in order to compare the means of the treatments, at the confidence level of p< 0,05. The statistical software used was R.
Results and Discussion
The average daily precipitation recorded was between 0 mm and 4,95 mm, and the ETo was between 1,68 mm and 5,06 mm. Correlation analysis was calculated between data from the closer meteorological station to the experimental plots and registered data in the portable weather station (Pearson coefficient of 0,65). There were no differences between the lysimeters for the three crop stages (Figure 1).

Source: Authors
Figure 1 Evapotranspiration and precipitation recorded during the experiment period to determine the Kc for the basil crop (Ocimum basilicum L.) in Valle del Cauca (Colombia).
Experiment 1 Crop coefficient determination
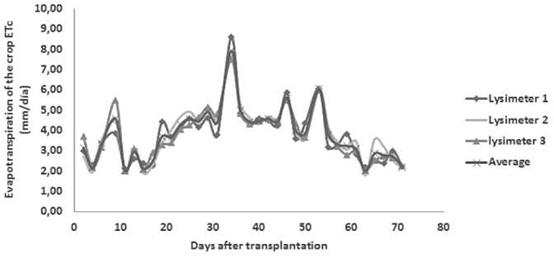
The three lysimeters exhibited similar results in terms of ETc (Figure 2). The data exhibited a normal distribution (p = 0,228), and no differences were found among the means (p = 0,962). The values oscillated between a maximum of 8,58 mm (exhibited at 34 dat in lysimeter 1) and a minimum of 1,78 mm (exhibited at 63 dat in lysimeter 3). The Spearman correlation coefficients among lysimeters (p < 0,01) were between 0,88 and 0,92.
Source: Authors
Figure 2 Variations of the water needs of the crop (ETc) during the growth period of basil (Ocimum basilicum L.) in the drainage lysimeters.
The highest water consumption for Genovese basil occurred towards the end of the growth and development stage and during the maturity stage. Generally, transpiration is low for the initial stages of crops because the foliage area is smaller; therefore, water loss is attributed in a higher proportion to evaporation from the ground than to plant transpiration (Allen et al., 2006). During the first stage (growth and development), precipitation and high temperatures were present that favoured the evaporation of water from the ground because the experiment was conducted at the end of the first rainy season of the year and at the start of the dry season, which is characteristic for tropical conditions in Colombia. As the plant grew, the water consumption increased due to the higher water demand needed to produce biomass and form flowers, thereby increasing transpiration.
Despite the high capacity of the moisture retention of the ground (microporosity above 35%), the stored water sheet was not sufficient to supply the demands of the plant; thus, it was necessary to apply irrigation with a frequency of two and three days. Towards the senescence stage, the ETc was reduced to values similar to those recorded at the initial stages. The average ETc recorded during the study period was 3,79 mm-day-1, and the total water consumption during the crop cycle was 269,38 mm (equivalent to 2693,80 m3-ha-1). These values were below the consumption recorded for other crops in the region, such as sugar cane (10300 m3-ha-1), corn (3600 m3-ha-1) and soy (3400 m3-ha-1) (Pérez et al., 2011), and even for purple basil crops in Turkey (12120 m3-ha-1) (Ekren et al., 2012) and saffron in Iran (6700 m3-ha-1) (Azizi-Zohan, et al., 2008).
The behaviour of the ETc and the ETo followed similar trends, although the ETo values were always higher than the ETc values (Figure 3a). The ETc values shown are the daily averages of the three lysimeters, whereas the ETo value is the value recorded at the same time by the meteorological station. The extreme ETo values were between 4,49 and 13,26 mm at 11 and 34 dat, respectively, whereas the extreme ETc values were between 2,01 and 7,91 mm at 63 and 34 dat, respectively. During the initial stage (0 - 25 dat), the ETo was between 40% and 60% higher than the ETc, whereas during the maturity stage, when the highest water demand occurred, the ETo was between 35% and 47% higher than the ETc. During the senescence stage, the ETo was between 47% and 67% higher than the ETc in the majority of the crops. During the initial stages, the ETo is higher than the ETc because the foliage area is smaller (Fronza and Folegatti 2003). When ETo is greater than the ETc during the initial stages is due to the high soil cover provided by the plant, which determine the percentage of increase between the two variables (Araya, et al., 2011). In this study, water was supplied using a test tube, and similar trends were obtained for ETc and ETo, with a regression coefficient of 0,75 (Figure 3b). The basil plants did not fully cover the soil, which favoured water evaporation and made transpiration higher, resulting in an ETc that was lower than the ETo.
Source: Authors
Figure 3 (a) Behaviour of the reference evapotranspiration (ETo) and water needs of the crop (ETc) during the experiment conducted with the basil crop (Ocimum basilicum L.) at Valle del Cauca, Colombia. (b) Linear regression found between ETo and ETc.
The values found for Kc in the three lysimeters were similar, with the second degree polynomial model exhibiting the best adjustment and regression coefficients between 0,6 and 0,7 being highly significant (p < 0,001) (Figure 4). The highest Kc values (0,66 - 0,68) were found during the maturity stage (46 - 50 dat), whereas the lowest values (0,33 - 0,31) were found during the senescence or leaf harvest stage (67 - 71 dat). The Kc values for the physiological stages of Genovese basil were between 0,42 and 0,59 (Table 2). The values achieved for each stage exhibited low variability and acceptable precision, as shown by the variation coefficients. When analysing by stages and conducting linear regression, the growth and development and senescence stages resulted in regression coefficients that were higher than 0,6, whereas linear behaviour was not obtained during the maturity stage. The Kc values reached a maximum value but did not stabilize for a sufficient period, as shown by the characteristic curve suggested by the FAO and described by Allen et al. (2006). Instead, the values fluctuated during the maturity stage between approximately 0,5 and 0,6 (Figure 5).
Source: Authors
Figure 4 Crop coefficient (Kc) values for the basil crop (Ocimum basilicum L.). (a) Lysimeter 1 (F = 20,30; p < 0,01). (b) Lysimeter 2 ( F = 27,03; p < 0,01). (c) Lysimeter 3 (F = 21,31; p < 0,01). (d) Aerage (F = 42.85; p < 0,01).
Table 2 Average values of the crop coefficient (Kc) for each phenological stage for Genovese basil (Ocimum basilicum L.) grown in Valle del Cauca Colombia

dat: days asfter transplantation; C.V. variation coefficient
Source: Authors

Source: Authors
Figure 5 Curve for the average crop coefficient value (Kc) for basil (Ocimum basilicum L.).
Similar Kc values have been reported for different crops, such as 0,65 for onion (López-Urrea et al., 2009), 0,22 - 1,05 for saffron (Azizi-Zohan et al., 2008), 0,55 - 1,09 for lettuce (Fernández-Pacheco et al., 2014), 0,52 - 1,09 for melon (Shukla et al., 2014), 0,82 for cauliflower and 0,70 for red kale (Sahin et al., 2009). Similarly, López-Urrea et al. (2012) found Kc values between 0,60 and 0,75 for Tempranillo vineyards; the lower values were attributed to the component of evaporation from the ground of the ETc after applying water (precipitation or irrigation), which can be high at the beginning of growth when the vegetable cover fraction is at a minimum. The low Kc values can also be attributed to the development of drought resistance mechanism by some plants, which translate into lower water consumption. Ojeda-Silvera et al., (2013) studied 20 varieties of basil and found that the Genovese variety was one of the varieties least resistant to water stress, especially during its early stages of growth, which directly affected cellular elongation and division.
During the growth and development stage of basil, the average water consumption was 2,98 mm day-1 (74,4 mm) and the average percentage of dry mass was 27,2% (Figure 6). The higher consumption of water occurred during its maturity stage with an approximate average value of 4,87 mm day-1 (121,8 mm in total), which was 38,9% higher than the consumption at the previous stage; in contrast, no changes in the dry matter percentages were detected (approximately 25%). Starting at this stage of higher water consumption, the basil plant began to develop, increasing its fresh and dry matter percentages. During the harvest stage and at the beginning of senescence, the water consumption was 3,16 mm day-1 (63,2 mm in total), a 48,1% reduction in water consumption compared to the previous phenological stage; in contrast, the dry matter percentage increased by 38,1% with respect to the maturity stage. According to Bekhradi et al. (2015), this lower water consumption allows for the concentration of oils and metabolites on the leaves, which are highly desired in the industry. Similar results were reported by Barroso et al. (2004), who found that replacing 100 °% of the water depth corresponding to the water evaporated the previous week allowed the soft basil to reduce its foliage water potential from -0,6 MPa in the maturity stage to -1,4 MPa in the senescence stage. This change translated to lower water consumption and a higher dry matter percentage (42,8%).

Source: Authors
Figure 6 Relationship between the water consumption and dry matter percentage for each phenological stage of basil (Ocimum basilicum L.): (1) Growth and development; (2) Maturity; (3) Harvest and senescence
The dry matter values during the harvest stage were 73 °% higher than the values reported by Bekhradi et al. (2015), who found that the dry matter percentage was 11,6% under temperate conditions when the soil was maintained at 100% of its FC. This difference may be due to the Mediterranean climatological conditions in which that study was conducted, which differed from the tropical conditions, and the moisture retention capacity of the soils, which were lower than the capacity corresponding to the soils used in this study.
Based on the obtained dry matter percentage and the water consumption of Genovese basil, a value was determined for the WUE equal to 11,00 kg-m-3 for the fresh mass and 5,04 kg-m-3 for the dry mass; these values are higher than the values reported for cereals (1,1 - 3,0 kg-m-3) (Steduto et al., 2012) and similar to the values recorded for crops such as the potato (4 - 11 and 1,3 - 2,8 kg-m-3 for fresh and dry mass, respectively) (Quiroz & Chijoy, 2012), tomato (1,3 - 3,5 kg-m-3 dry mass) (Battilani et al., 2012) and sugar beet (2,1 - 6,8 kg-m-3 dry mass) (Rinaldi & Horemans, 2012). For basil, Daneshnia et al. (2015) found efficiencies on the order of 2,33 kg-m-3 in crops associated with clover using irrigation water depths that provided 100% of the evaporated water. The values found in this study were higher than those of the majority of crops given that their calculation involved using the entire weight of the plant, including its roots. Additionally, the method of water application had a large influence on its efficiency of use (Erdem et al., 2006). Because water was applied volumetrically, the efficiency values regarding water use were high. Recent studies, such as the study by Ekren et al. (2012), showed that although the largest harvest yields for basil were obtained when the soil was maintained at 100% of its FC, the irrigation efficiency did not change when the irrigation depth was reduced to 75% of its FC.
Experiment 2 Crop coefficient evaluation
The results of dry mass percentage, plant height, foliar N, pH and EC are summarized in Table 3. The plants that were maintained in soil with moisture at FC got higher dry mass percentages that those watered with amount of water calculated from Kc, without differences among treatments (F = 2,97; p = 0,12). The dry mass percentage was higher in fertilized plants that in not fertilizer plants, although without differences among treatments. It is know that the application of nutrients such as N, phosphorus (P) and potassium (K) contribute to growing and development of plants. These results suggest Kc was adequate to calculate the amount of water in basil, because plants did not present water stress and neither affects the photosynthesis process, nor fresh mass production. According to the previous physical and chemical analysis, the used soil is considered high fertility, and this could be the reason why statistical differences in dry mass percentage among treatments were not found. In addition, the effect of fertilizer applications was not evident. Similar results were reported by Khalid (2006), who did not find differences in agronomic characteristics, such as dry weigh, between both soil moisture levels at 100 °% and 75 °% of FC. Moeini et al. (2006) recommended not subject the plants to water stress less than 75 °% of soil moisture at FC because among others variables, plant height and yield of basil could be negatively affected.
Table 3 Effect of amount of water applied and fertilization in agronomic and soil variables in basil (Ocimum basilicum L.)
| Variables | Treatments | ||||
|---|---|---|---|---|---|
| CFC | CK | FFC | FK | ||
| Plant | DM (%) Plant Height (cm) N foliar (%) | 35,73 ± 5,72ab 55,80 ± 5,10a 0,33 ± 0,07b | 25,07 ± 1,17b 53,50 ± 0,50a 0,14 ± 0,02b | 44,50 ± 1,22a 65,60 ± 6,72a 1,06 ± 0,15b | 38,72 ± 3,49ab 52,43 ± 6,53a 3,49 ± 0,40a |
| Soil | pH EC dSrrr | 6,32 ± 0,09ab 0,95 ± 0,26ab | 7,34 ± 0,08b 0,51 ± 0,02b | 6,07 ± 0,06ab 0,99 ± 0,33a | 7,11 ± 0,64ab 1,35 ± 0,07a |
DM= Dry matter; CFC = Field capacity without fertilizer; CK= crop coefficient without fertilizer; FFC= Field capacity with fertilizer FK= crop coefficient with fertilizer; EC= electrical conductivity
Source: Authors
The final plant heights were between 52,43 y 65,60 cm and differences among treatments were not found. Yepes et al. (2016) found similar results and they argued that plant height obtained in basil were independent of N fertilizer doses applied. Basil plants did no present loss of turgidity indicating that inhibition on its cell division was not presented (Ekren et al., 2012). The amount of applied water did not have any effect in the length of stems (F = 2.16; p = 0.17). Ekren et al. (2012) also did not found differences in plant heights in basil until the first harvest (73 dat) when they varied the among of applied water; however, from the second harvest, the effect of water stress was evident in this variable, where higher water stress, lower plant height.
The amount of applied water had a significant effect on the N concentration in basil leaves, where those that were watered taking account the Kc, showed higher N concentration. These results suggested that fertilizer application, especially N fertilizer, and the amount of applied water were determining factors in N concentration in leaves. If the amount of applied water is appropriate, the nutrient leaching from root zone does not occur and elements such as N could be assimilated by the plant, which would be reflected in biomass production. According to Singh (2002), the foliar N does not affect with the water regime, but in our work we found when the amount of applied water decreased, the N concentration in the leaves of basil increased and this result is related with essential oil concentration (Omidbalgi et al., 2003). Indeed, Jordan et al. (2017) reported that when the amount of water was reduced, the concentration of essential oils increased, but water stress affected the aromatic fraction and reduced its lifetime in storage. The chemical variability detected among individual plants that were subjected to the same watering level did not allow for a real assessment of the impact of water stress on the foliar N.
Both the amount of applied water and fertilization had a significant effect on pH and EC of soil. The treatments that were watered and maintained at moisture of FC acidified the soil. These results could be due to leaching of cations such as calcium or potassium from soil or its translocation to lower soil layers below root zone. The highest EC was achieved in soils which were fertilized and watered taking account of the Kc, possibly due to the contribution of salts by the fertilizers and lower amount of applied water that increased nutrient concentration in root zone.
The treatments maintained at soil moisture of FC achieved higher WUE than those which were at 72% FC (Figure 7). The water use efficiency in basil plants which were fertilized and watered to maintain at moisture of FC (FFC) were 25,2%, 39,9% y 55,5% above of CFC, CK y FK, respectively. These results can be explained by the high temperature achieved inside the greenhouse during the experiment that affected the biomass production. Water use efficiencies were found to be higher (between 3,3 and 7,5 kg-m-3) than the results of Ekren et al. (2012) who reported values between 2,46 and 3,34 kg-m-3. It is known that the green yield of the basil plants is moderately affected by the environmental conditions (Arabaci and Bayram, 2004).

Source: Authors
Figure 7 Effect of amount of water applied and fertilization in water use efficiency (WUE) in basil (Ocimum basilicum L.). CFC = Field capacity without fertilizer; CK = crop coefficient without fertilizer; FFC = Field capacity with fertilizer FK = crop coefficient with fertilizer
Despite not finding differences among treatments in variables such as dry mass percentage and plant height, it was possible to recognize there were differences in WUE, and Kc varies in function of environmental conditions, where the basil crop is established.
Conclusions
The crop coefficient (Kc) of basil were between 0,42 and 0,59 throughout the phonological stages and its water consumption were between 2,98 and 4,87 mm day-1. The water needs for basil crop were about 269,48 mm. However, in greenhouse conditions, water calculated with Kc did not obtained similar responses in dry mass with the amount of water at field capacity soil moisture. Bearing this in mind, it is necessary to determine Kc values in greenhouse conditions, and possibly these values could be higher than in field conditions due to higher ETc. It is valuable to know how much water can be reduced related (percentage of soil moisture of FC) without affecting agronomic variables of commercial importance, given the current environmental threats such as the low availability of water.

