


 Inglés (pdf)
 Articulo en XML
 Referencias del artículo
 Enviar articulo por email
 Citado por SciELO
  Citado por Google
  Similares en
SciELO
Similares en
SciELO  Similares en Google
 Permalink
Introduction
Among new alternatives implemented in order to reduce CO2 and NOx emissions produced by internal combustion engines (Rodríguez, Sierens, Verhelst, & Frontela, 2008), biomass becomes a renewable source of energy, that can partially replace the fossil fuels (Perdices, 2009) and reduce the emissions of those gases to the atmosphere (Montiel, 2003). Thermochemical transformation of biomass usually produces solid, liquid and gas fuels that besides the usage for energy production, can be a source of chemical products, heat and energy (Camps Michelena & Marcos Martín, 2008). Pyrolysis and gasification are the thermochemical processes most used at commercial level (Soto, Machado, & López, 2010). Lignocellulosic biomass is the organic substance most abundant on earth; the main sources of those are forest, crops and industrial residues (Abril & Navarro, 2012). This material is constituted by cellulose, hemicellulose and lignin (Abril & Navarro, 2012; Caballero, 1995). For the systematic characterization of biomass pyrolysis, the analysis of the individual components has been performed using several techniques such as thermogravimetrical analysis (TG), thermogravimetrical analysis coupled with gas chromatography (TG-GC), thermogravimetrical analysis coupled with Fourier transform infrared spectroscopy (TG-FTIR) (D. Chen, Liu, Zhang, Chen, & Li, 2015; Gani & Naruse, 2007; Yang, Yan, Chen, Lee, & Zheng, 2007). Usually, in further investigations, interactions between the components of the biomass and the effect of the addition of alkaline minerals (Lv et al., 2010), alkaline earths, and metallic salts is studied (Khelfa, Bensakhria, & Weber, 2013).
Pyrolysis behavior of biomass is dependent on biomass composition; therefore, each feedstock should be thermally characterized to set bio-oil production conditions (Wang, Guo, Wang, & Luo, 2011). Husk of African palm tree is one of the most abundant waste lignocellulosic biomass in countries such as Indonesia, Malaysia, and Colombia, as a result of the extraction of palm oil. Several strategies have been implemented to manage palm oil industry solid wastes and other, such as, gasification and pyrolysis are currently under research (Oseghale, Mohamed, & Chikere, 2017). In this work, the devolatilization kinetics of husk of African palm tree and its product distribution are studied. Simultaneous analysis using TG-MS technique was used. Experimental data were fitted to distributed activation energy model (DAEM). Results could be used to scale up pyrolysis reactors using husk of African palm.
Methodology
Materials
African palm husk (Elaeis guineensis) was obtained from a local biodiesel plant. Biomass was grinded (particle size < 200 mm) and stored in a desiccator prior to use.
Elemental analysis
For elemental analysis a Thermo Scientific FLASH 2000 CHNS/O Analyzer with a detection limit of 0,01% was used.
TG-MS analysis
Thermogravimetrical analysis was performed in a TA instruments TGA 2950 thermogravimetric analyzer. A Thermostar (Blazer) mass analyzer was coupled to the thermogravimetric balance to analyze the evolved gases. Linear heating rate programs were employed (10 and 100 K/min), and linear heating intercalated with isothermal processes (step transitions). Selected heating rates allowed visualizing any change of mechanism at fast heating, and stair-like heating program allowed capturing more information from TG and MS experiments. Helium (grade 5) was used as purge gas at a constant flow of 100 mL/min. To reduce the effects of heat and mass transfer (Albis, Ortiz, Suárez, & Piñeres, 2013), the weight of the samples were between 2 and 15 mg. The masses of the samples selected for the mass spectroscopy analysis were selected according to preliminary experimentation, where m/Z values between 1 and 120 were followed while the sample is heated at 10 K/min. From here, channels m/z above base line were selected.
Distributed activation energy model (DAEM)
DAEM model uses the assumption that a series of irreversible parallel first order reactions occurs, characterized for a continuous distribution of activation energy that can be represented by a distribution function Dj(E) (N. Chen et al., 2016; Cheng et al., 2015). This model describes the processes of pyrolysis, where the fraction of unreacted material as function of time is (Várhegyi, 2007):
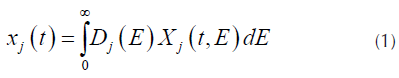
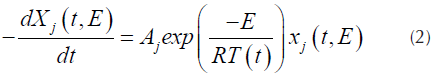
Where X j (t,E) is the solution of the first order kinetics equation that represents the specific activation energy (Açikalin, 2011), that is represented by Equation (2).
For each pseudo-component a kinetic equation represented by Equation (1) is assumed. The weight loss rate curve (DTG) is the pondered sum of the individual reaction rates (N. Chen, et al., 2016), which are calculated by Equation (3).
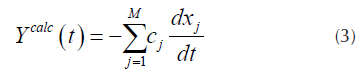
Where x
j
is the unreacted fraction of the material represented by the j-th kinetic equation, c
j
corresponds to the j-th reaction contribution of the measured quantity and M is the number of pseudo-components used for the fitting (Albis, et al., 2013). Each curve  of Equation (1), can be obtained from Equation (4) as follows.
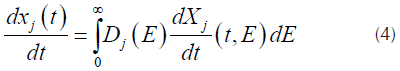
Where D j (E) is a distribution function for the activation energy of the pseucodomponent j. In order to use numerical integration techniques, the inferior integration limit of the right part of the equation has to be changed from E = 0 to E = -∞. Assuming the usual values for the pre exponential factors, obtaining values of E = 0 or E < 0 corresponds to events that occurs below ambient temperature, so, the change of the limit of the equation does not interfere in the value of the integral (Várhegyi, Szabó, & Antal, 2002). Assuming that a Gaussian distribution function, usually employed for this kind of processes (Cheng, et al., 2015; JankoviC, 2014), with an apparent media activation energy E 0j and an standard deviation σ j can be obtained.
Inducing a variable change proposed previously (Jankovic, 2014), the Gauss-Hermite quadrature and the re-scaling suggested by other authors, such as Donskoi & McElwain (2000),for improving the equation efficiency:
Where represents the ponderation values. In this case a re-scaling factor of 0,5 suggested in previous works was used. Also, in in Equation (6), the number of partitions of the Gauss - Hermite quadrature employed were 80 (Várhegyi, et al., 2002).
For the fitting of the curve, a nonlinear least square method was employed, where the experimental and calculated curves looks for minimize the equation:
Where N k represents the number of points for the curve evaluated and Np is the number of parameters of the model (Abdelouahed, Leveneur, Vernieres-Hassimi, Balland, & Taouk, 2017).
For the determination of the kinetic parameters of the decomposition of palm husk, distributed activation energy model (DAEM) was used. In this study, the pre-exponential factor of the Arhenius equation for each one of the reactions sets or pseudo-components is independent of the heating speed rate. Experimental data was fitted to the model employing between one and four pseudo-components. The fitting of the model was performed using Matlab® software, evaluating Equation (6) under the criteria of minimization of SE from Equation (7).
Results and discussion
Elemental analysis of the sample shows a percentage of nitrogen of 0,71 %, carbon of 43,09 %, hydrogen of 6,83 % and oxygen of 46,65 %. Biomass has higher contents of O and H and a lower C content than those reported for fossil fuels (Demirbas, 2004).
In Figures 1a and 1b, TG and DTG curves are showed for heating rates of 10 and 100 K/min. The curves shows a similar behavior found in previous studies (Idris et al., 2010; Yang et al., 2004), including a similar percentage of char at both heating rates. In Figure 1 a typical displacement to the right of the thermogram with the increase of the heating rates is exhibit (Várhegyi, 2007).
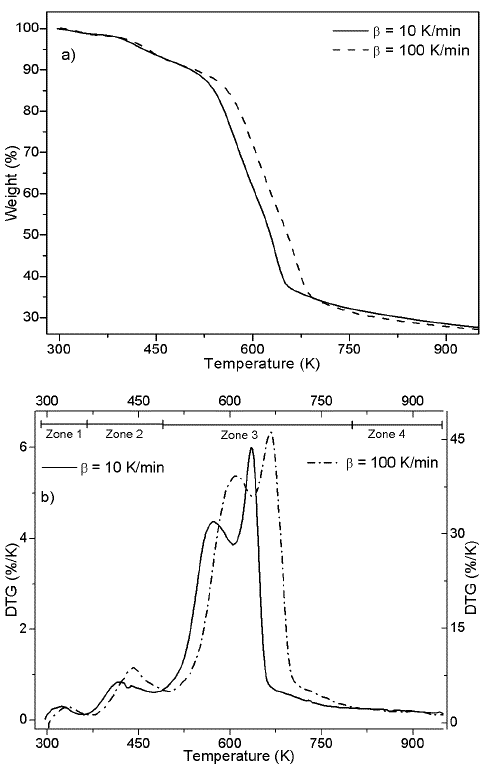
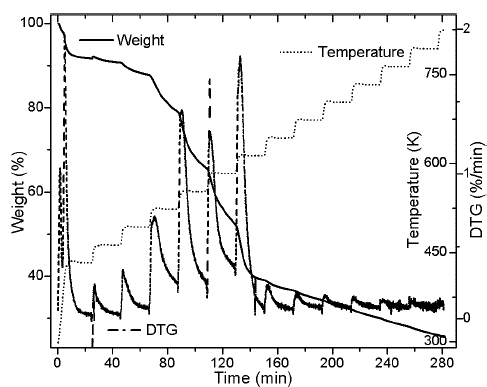
Thermogram shows a first event that is related with water release (zone 1) (Gottipati & Mishra, 2011), followed by a second event that corresponds to the first thermal decomposition (zone 2), then , the main pyrolytic event is reached with two peaks of similar height (zone 3), and finally, a slow rate decomposition zone (zone 4). Water loss at temperatures below 393 K corresponds to the humidity of the sample, weight loss in zone 2 of the Figure 1b is due to the decomposition of oils and volatile substances in the husk. In the main pyrolytic event, the first peak corresponds to hemicellulose decomposition and the second one represents the disintegration of cellulose. Zone 4 is related to the lignin thermal degradation, which is decomposed in a wide temperature range, and secondary reactions of the thermal decomposition of char residues. Figure 2 shows heating program, TG, and DTG thermograms for the palm husk using the stair function program. This program allows to gather information in case of parallel reactions, like described by DAEM model.
Source: Authors
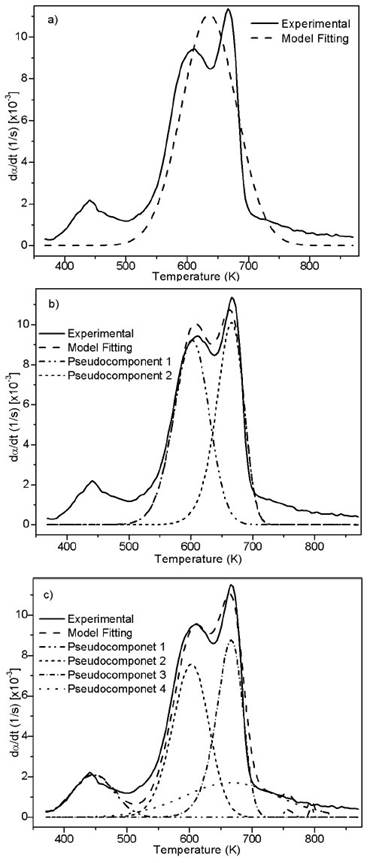
Figure 3 Experimental and fitting of DTG to the DAEM model with different reactions sets for African palm husk pyrolysis at 100K/min
Source: Authors
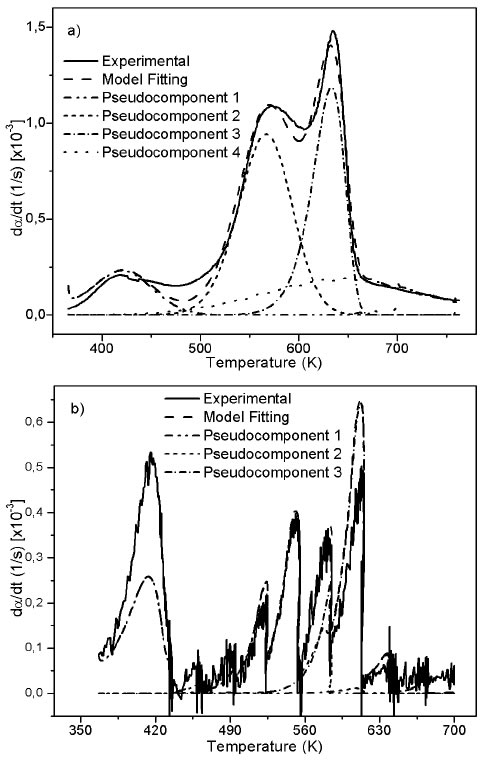
Figure 4 Experimental and fitting of DTG to the DAEM model with different reactions sets for African palm husk pyrolysis at 10 K/min and step heating program.
Kinetic analysis
The kinetic analysis of pyrolytic process was made between the temperatures that correspond to zone 2 and 3, which can be seen in the Figure 1b. Zone 2 was included because besides is not part of the main pyrolytic event, both zones are overlapped.
Figure 1b suggests the use of at least 3 pseudo-components due to the number of peaks. In figure 3, the DAEM model fitting is showed and compared with the experimental data for heat rate of 100 K/min. Considering that the pyrolysis of the biomass used can lead to the production of several chemical species (aromatic polycyclic hydrocarbons, phenolic compounds and oxygenated organic species, the reaction sets and pseudo-components who had the best fitting were selected. In Table 1, the fitting parameters are showed. Reduction of the standard error by increasing the number of pseudo-components is seen. Further analysis was performed using 4 pseudo-components. In Figure 4, results for the fitting of data at 10 K/min heating rate, and 4 pseudo-components for stair function program are presented. Fitting results are shown in Table 1. There is no variation of the parameters of the DAEM model, even for high heating rates.
Table 1 Fitting parameters of DAEM model with different number of pseudo-components for a heat rate of 100 K/min
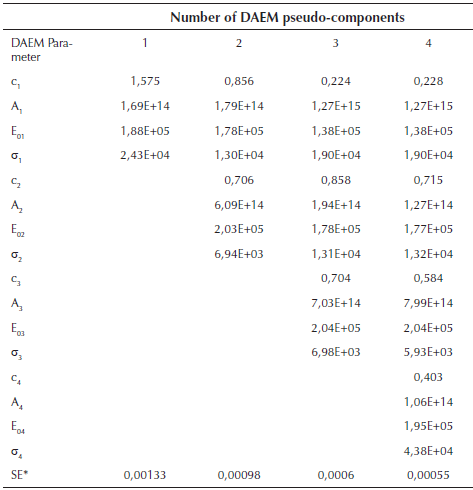
*SE Standard error of the model
Source: Authors
Values of the parameters of the DAEM model are in the range of previous studies for several biomass, using 3 pseudo-components related to lignin, cellulose and hemicellulose (Cai & Ji, 2007; Cai, Wu, & Liu, 2014; T. Chen, Zhang, & Wu, 2016). Fourth pseudo component is usually associated to oils decomposition. Activation energy for the palm husk is of the same order (Idris, et al., 2010; Yang, et al., 2004).
Mass spectrometry
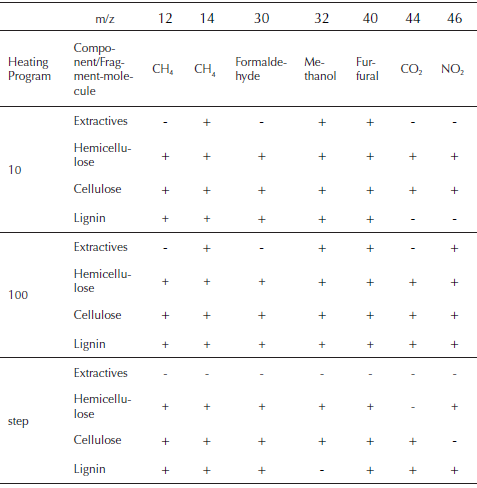
During the pyrolysis of the palm husk, formation of carbon dioxide (m/z = 44) is detected as result of the thermal decomposition of the cellulose, hemicellulose and lignin. This is one of the products with a complex profile for the pyrolysis of the palm husk. CO2 is produced also by lignin decarboxylation reactions at high temperature and secondary reactions that occurs in gaseous phase by weak aliphatic bond breaking (Meng, Zhou, Qin, Zhang, & Li, 2013). Methane production (m/z = 12 y 14) at low temperatures is the result of the decomposition of extractive materials and oil that remains in the husk and thermal degradation of hemicellulose and cellulose. Lignin decomposition and production of methane is sustained in all the temperature range, being increased at high temperatures (T. Chen, et al., 2016; Yao, Xu, & Liang, 2016). Relation m/z = 30 is related to the presence of formaldehyde, while m/z = 32 represents the presence of methanol (Malika, Jacques, Fatima, & Mohammed, 2016). Furfural is identified with the relation m/z = 40, while nitrogen compounds are expressed as NO2 (m/z = 46).
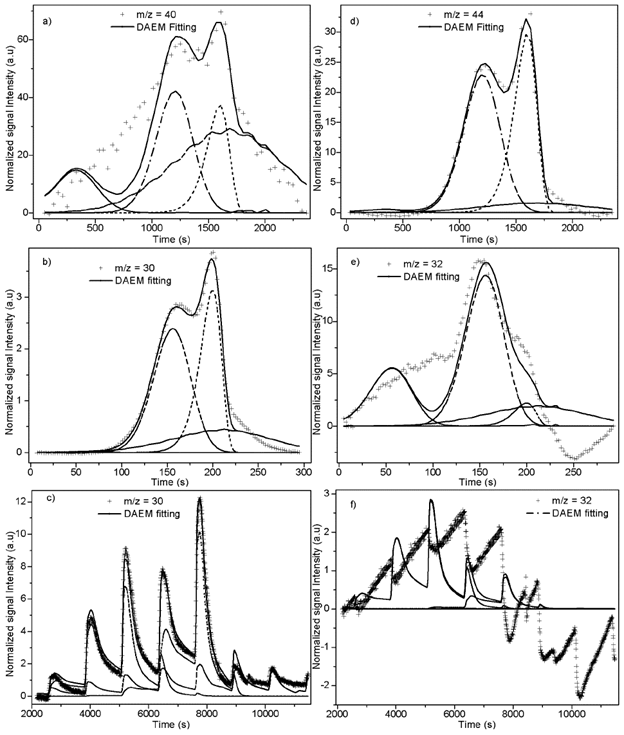
Fitting of DAEM model with 4 pseudo-components is showed in Figure 5 for some of the m/z ratios. In the supplementary material the fitting for all the m/z and heating rates is supplied. Fitting was made with media values of A j , E 0j y σj, for each pseudo-component of Table 2. Adjusted parameters were c j values with 4 pseudo-components for each m/z. Temperature range of the evolved species related with the m/z relations are in agreement with the temperatures of the main pyrolytic event showed in the DTG figures.
Fitting for the m/z = 40 for heating rate of K/min is presented in Figure 5a, a proper fitting is obtained for the model with 4 pseudo-components. Also, evolution of CO2 is represented by the same model and number of pseudo-components is represented in Figure 5b. The normalized negative signal for these mass charge relations can be attributed to a higher release of CO2 before the thermal events (absorbed by the biomass) and the absence of production of this compound at the temperatures of decomposition of oil and extractives. Figures 5c and 5d shows the evolution of m/z = 30 for 100 K/min heating rate, and with stair-like heating program. This relation is related to formaldehyde and shows a good agreement between model and experimental data. Methanol fitting (m/z = 32) was not as good as the previous ones as might be due to production of this compound by decomposition in gaseous phase in secondary reactions.
Table 2 Parameters of DAEM model with four pseudo-components for different heating programs
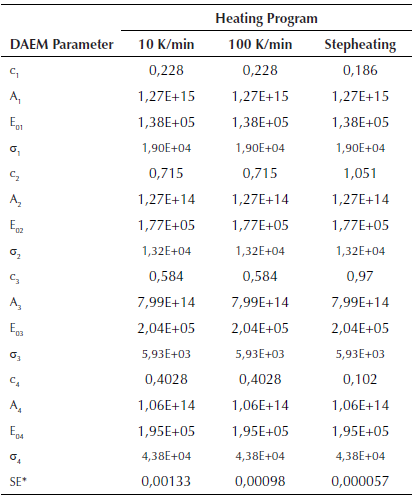
*SE Standard error of the model
Source: Authors
Table 3 shows the relations m/z of the species produced with high relation intensity/noise, during the heating of the samples that were fitted to DAEM model. In the same way, the evolution of the samples and its evolution with the decomposition of the major components of biomass is showed. Also, a possible source molecule that gives the mass charge relation is proposed according to previous studies (T. Chen, et al., 2016; Polat, Apaydin-Varol, & Pütün, 2016; Weerachanchai, Tangsathitkulchai, & Tangsathitkulchai, 2011). During the decomposition of extractives and oil, some relations of m/z related to formaldehyde and CO2 are weak to been taken account. This is also observed for the NO2 relation for thermal decomposition of lignin, giving the insight of the non-presence of those compounds for the pyrolysis of extractives and lignin. In the same way, methane, methanol, formaldehyde, furfural, CO2 and NO2, are produced in all the range of temperatures that correspond to pyrolysis of cellulose and hemicellulose for all the heating programs.
Table 3 Mass spectrometric intensities selected for kinetic evaluation and its presence in the main thermal events
Source: Authors
Source: Authors
Figure 5 4 pseudo-components DAEM fitting of selected m/z signal intensities. a) m/z = 40: PKS heated at 10 K/min; b) m/z = 44: PKS heated at 10 K/min; c) m/z = 30: PKS heated at 100 K/min; d) m/z = 32: PKS heated at 100 K/min; d) m/z = 30: PKS heated with stair program; b) m/z = 32: PKS heated with stair program.
Conclusions
In this study, thermal decomposition of palm husk and fitting to DAEM model was made. Model describes successfully the pyrolytic process kinetics. No change of the kinetic parameters with heating program was observed.
Evolution of m/z ratio of the evolution gas was followed using TG-MS technique. Main molecules found were methane, formaldehyde, furfural, CO2 and NO2. For each m/z signal, modeling of the signals with good results for several m/z ratios were obtained. For the signals that did not fit the model can be concluded that its production is also related with secondary reactions in gaseous phase of some of the evolved products. Results of this work could be used to design pyrolysis reactors and, also, as a starting point to optimize them.

