


 English (pdf)
 Article in xml format
 Article references
 Send this article by e-mail
 Cited by SciELO
  Cited by Google
  Similars in
SciELO
Similars in
SciELO  Similars in Google
 Permalink
Introduction
The electricity sector has experienced a steady growth in the world. The demand for electricity grows at the same time as societies. The growth of population and the quality of life of people are increasing such demand. This situation generates a dynamic operation in the companies of the electricity sector. Sectors such as rural, industrial, residential, government and commercial can have different curves and peaks of demand. Therefore, the companies of the sector require the application of new technologies.
One of the common problems in this sector has been the electrical losses. Electrical losses can be classified into two groups (Sahoo, Nikovski, Muso, & Tsuru, 2015). On one hand, there are technical losses which usually occur due to the dissipation of energy. These losses are usual in elements of the network such as transmission lines, generators and transformers. On the other hand, non-electrical losses (NTL) are mainly caused by disturbances in measurement equipment, indirect and direct legal connections in the electrical network or human errors in the readings of measurements (Glauner, Meira, State, Valtchev, & Bettinger, 2016).
A type of standard methodology used by electricity companies to detect NTL is based on the study of customers who have null consumption during a certain period. This type of customer whose consumption is null is identified with a possible point of non-technical loss. The problem with this methodology is that this client does not always have an NTL because it can be, i.e. an unidentified unoccupied property (Guerrero et al., 2018).
The detection of fraudulent users who have billing is a field in which the implementation of new technologies has been frequent. The detection of irregular users through computational intelligence has been treated by many authors with several approaches. The development of intelligent systems has been an alternative and such systems have included techniques as artificial neural networks (ANNs) (MarkoC, Hlupic, & Basch, 2011; Zheng, Yang, Niu, Dai, & Zhou, 2018), principle component analysis (PCA) (Singh, Bose, & Joshi, 2017), fuzzy models (Viegas, & Viera, 2017; Nagi et al, 2011), data mining (Chen et al., 2014) and support vector machines (SVMs) (Nagi J. et al., 2010; Pereira et al., 2016).
The use of systems based on neural networks is common in several cases of fraudulent user detection due to the flexibility and capability to associate the features of users with fraudulent patterns. By having real data, an artificial neural network can be trained in a supervised way, achieving suitable results due to learning by error correction (Markoc, Hlupic, & Basch, 2011; Zheng, Yang, Niu, Dai, & Zhou, 2018). However, one of the disadvantages of working with an artificial neural network is the need for real life samples other than the training set to evaluate the network performance.
Some approaches (Viegas, & Viera, 2017; Nagi et al, 2011) show how the implementation of a fuzzy cluster allows the classification of fraudulent and non-fraudulent users. These relationships are possible by a classifier called C-means. This classifier orders and rates the consumers profile depending on the measures distances in a range of the unit. As a result of the above, the consumers with high probability of being fraudulent or with irregular patterns score higher in the proposed range. In general, features such as average consumption of the last six months, maximum historical consumption, standard deviation of the last six months, total of irregularities found in the last six months and average consumption of customers with the same rate and geographic location in the last six months, they were used to develop the classification by this technique.
The implementation of advance metering infrastructure (AMI) has benefits in the detection of fraudulent users who have billing such as flexibility and adaptability in any electrical system, monitoring data in real time with reduction of electricity costs due to more precise consumption and more accurate location of non-technical losses. This result is achieved through the use of intelligent electronics devices, measures taken through an automated process and advanced measurement systems (Jiang et al., 2014; Leite & Mantovani, 2016; Lo, Huang, & Lu, 2012; Su, Lee, & Wen, 2016). The importance of this technology is due to the increase of efficiency of estimation algorithms and classification of users, such as distribution state estimation (DSE), A-Star algorithm and semi-definite relaxation (SDR).
Proposed methodology
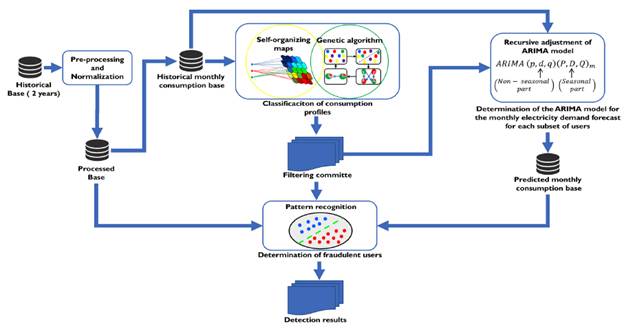
The development of the methodology proposed in this work consists of the following fundamental stages:
i) Creation of subsets of users with similar consumption curve profiles (Clustering Module).
ii) Determination of the ARIMA model for the monthly power consumption forecast for each subset of users (Prediction Module).
iii) Determination of fraudulent users (Detection Module). The proposed block diagram is described in Figure 1.
Creation of subsets of users with similar consumption curve profiles
The historical record of customer consumption was used like the cluster input due to this record is the only necessary feature for the identification of consumption patterns that determine the behavior of the users.
Self-organizing maps were implemented to perform the user classification. This is a special configuration of neural networks in problems of unsupervised learning. The design parameters of the neural network are: number of neurons, network topology, distance function and number of training steps for the initial covering of the input space. The values of the parameters determine the performance and results of the neural network. Therefore, it was necessary to obtain the set of values that will get reliable performance. In response to the above, a multi-objective optimization problem, whose objective functions are to minimize the number of clusters (categories) while grouping performance is maximized, was raised. The first objective function is aimed at reducing runtimes and computational cost while the second is aimed at obtaining the best possible results in the cluster.
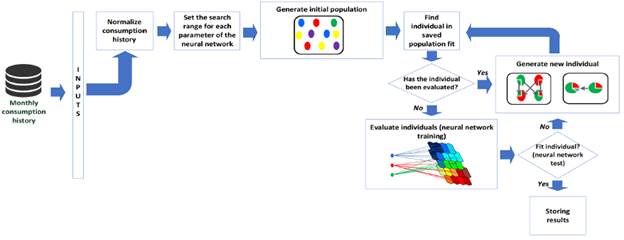
The implemented solution to obtain the optimum values of the parameters of the neural network is a genetic algorithm, which belongs to a search and optimization approach known as meta-heuristic. For each parameter of the neural network, a minimum and maximum value was established. With the minimum and maximum values, two threshold vectors were formed for the search. In addition, it was necessary to include a buffer that stores the already evaluated combinations as good to reduce the number of evaluations. Therefore, if one of the stored combinations is regenerated by a mutation or cross-linking, it is not evaluated because it has already been stored. The final structure of the cluster stage is described in Figure 2, which proved to be a hybrid between neural networks and genetic algorithms.
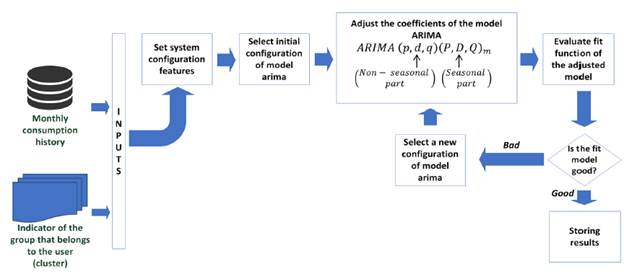
Determination of the ARIMA model for the monthly electricity demand forecast for each subset of users
The functional structure of the prediction system is mainly based on an integrated autoregressive model of moving average (ARIMA). The system inputs consist of a customer's power consumption history and an indicator of the group to which the user belongs. In order to choose a suitable ARIMA model, the iterative script was developed. In this script, the parameters related to the integral and moving average polynomials for the non-seasonal part and the degree of the polynomial of the moving average of the seasonal were varying for several subsets of customers. The parameters with a best performance are chosen for carrying out the power consumption forecasting.
The search for the degrees of polynomials for the seasonal and non-seasonal part is reached through the variation of the degree by means of iterations (Mares, Mercado, & Quintero, 2017). At each iteration, a possible combination is created that gives rise to a model determined by Equation (1).
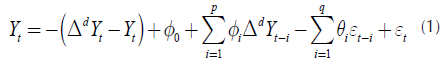
Where:
d it corresponds to the degree of integration polynomial.
q it corresponds to the degree of the moving average polynomial.
p it corresponds to the degree of the autoregressive polynomial.
Φi it corresponds to the parameters belonging to the autoregressive part of the model.
θ j it corresponds to the parameters belonging to the moving average part of the model. φ, it is a constant.
ε¡ it corresponds to the error term (also called innovation or stochastic perturbation).
Each combination generates a model which is evaluated considering how well it fits the original series. The objective is to maximize the fit function which represents the Normalized Root Mean Square Error (NRMSEj and it is determined by Equation (2).
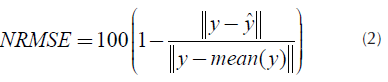
Where,
y it corresponds to the original time series.
 it corresponds to the set time series.
When a new combination is generated, the performance of the ARIMA model is calculated. The iterations are performed until the first performance is greater than or equal to the established threshold. If no ARIMA model meets the above condition, it selected the model with the best performance among all. Figure 3 shows the proposed monthly load-prediction model.
Determination of fraudulent users
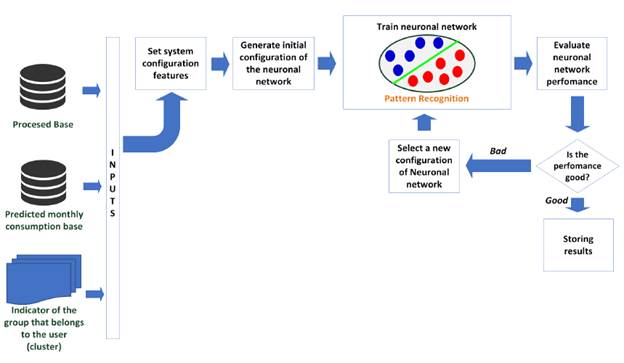
The results obtained from clustering and prediction stages were used in the analysis to establish the structure of input features of the neural network implemented in the identification of users with irregular electricity consumption.
The approach of the proposed model is based on the classification of users into two classes: fraudulent and non-fraudulent. Therefore, it was necessary to combine user samples with fraudulent and non-fraudulent characteristics into training and testing sets to improve the performance of proposed system. The problem addressed in this work is a supervised classification because there are real inspections' data to be used for the training. Therefore, a pattern recognition network is used as alternative methodology to solve the addressed problem (Jokar, Arianpoo & Leung, 2016). This is a feed forward network with supervised learning that can be trained to classify inputs according to target classes. Figure 4 shows the methodology proposed for the detection stage.
The features used as inputs of proposed model based on neural networks are described below:
Power consumption deviation: the deviation of the energy consumption corresponds to the difference between the actual and predicted consumption in the prediction module.
Anomaly reading: it describes irregular situations in user measurements.
Power supply state: it refers to the service status of the user, (e.g., suspended, connected and without contract).
Type of power supply: it refers to the indicator of user consumption type, (e.g., common building area, direct connection, fixed consumption, normal, historical average, average of the stratum).
Overdue billing: it corresponds to the number of invoices not paid by the user.
Tariff: it corresponds to the residential tariff class of the user.
Type of reading: it describes the type of user's measurement.
Cluster indicator: it corresponds to the indicator of the group to which the user belongs.
The data used for the training correspond to the months of July to December of 2015. On the other hand, the data for testing were selected from the months of January to July of 2016.
During the training of the neural network, it was implemented the methodology of Oimenez, Donado, & Quintero, 2017) to find the best neural network by varying the parameters in the configuration. The modified parameters were:
At each iteration, a new neural network was configured and trained with the same training set in all cases. After training, the neural network was validated and the Mean Absolute Percentage Error (MAPE) was calculated. MAPE was adopted as a performance indicator allowing a quantitative comparison of each evaluated configuration. Finally, the best neural network was selected with the least MAPE.
Results
This section presents the results obtained by the clustering, prediction and detection modules that integrate the system proposed in this work.
Clustering module
The clustering module aims to group users with similar behaviors into their monthly power consumption curves. However, fulfilling this goal is a very broad task, so it was necessary to integrate the searching technique of genetic algorithms in order to achieve the least amount of groups with the highest possible quality of clustering.
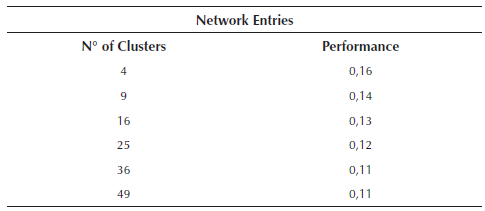
The execution of the multi-objective search algorithm yielded results in the following set of entries belonging to the Pareto frontier solution (see Table 1).
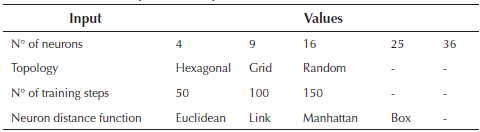
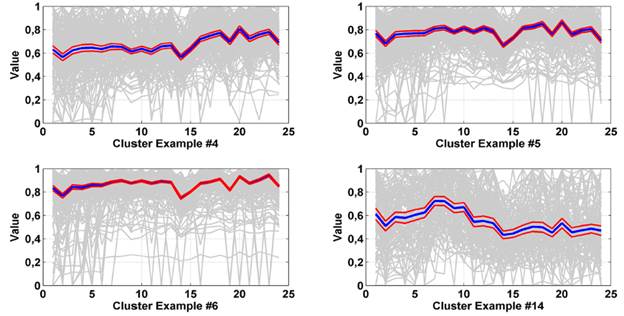
The outputs of the neural network for each of the resulting entries sets are shown in Table 2. Some examples of results were obtained from the execution of the neural network in the optimality condition: 62 neurons, 100 training steps, Hexagonal topology and Euclidean distance function with 24 periods. Figure 5 shows the result of one of the configurations evaluated during the training of the cluster where about 4000 users were used.
Prediction module
To evaluate the performance of the prediction system, the Normalized Root Mean Square Error (NRMSE) was used as a performance indicator. This indicator seeks to ensure that the initial assumption is met, which consists in finding the best model that fits the time series described by the user's historical power consumption curve. If the model found is able to fit with great accuracy to the time series, it is assumed that the model can correctly forecast the value of the power consumption of the following month. Finally, the absolute mean percentage error (MAPE) was used to figure out the model performance. To test the performance of the prediction module, 1000 users were selected randomly for each test. The selection of users was made from the total of 4000 users used in the clustering stage. Four tests were done and the results are shown in Table 3.
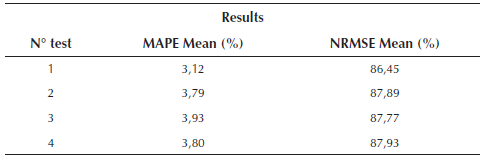
Figure 6 shows the MAPE cumulative average obtained for each user of the test samples. The average of MAPE is close to the value described in Table 3 and the highest concentration of the MAPE distribution is below average.
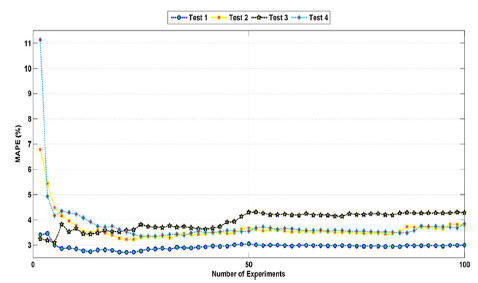
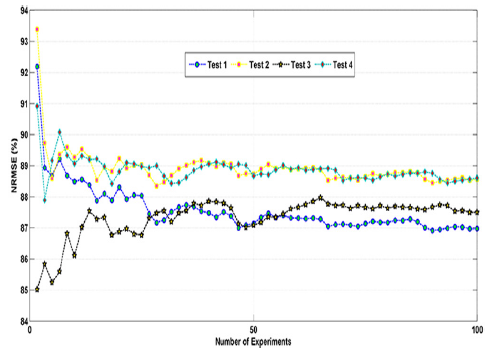
Figure 7 shows the NRMSE cumulative average for each user of the test samples. The most users obtained a fit or similarity between the adjusted series and the original series above average.
Detection module
The performance of the ANN was figured out through the area under the ROC curve (AUC). This indicator can be interpreted as the probability that a classifier will order or score a positive instance randomly chosen higher than a negative one. In this sense, the performance of the detection module was evaluated according to the experimental design based on observing the behavior of the neural network for different tariffs of the database.
Response variable:
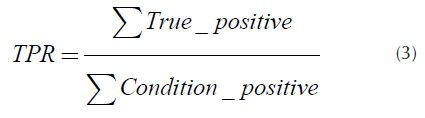
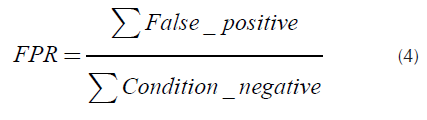
AUC: This value corresponds to the area under the ROC curve. The curve is the representation of the true positive rate (TPR) against the false positive rate (FPR) (Zheng, Yang, Niu, Dai, & Zhou, 2018). The TPR, determined by Equation (3), defines how a classifier is able to detect or classify correctly positives cases of all positive cases available during the test. The FPR, determined by Equation (4), defines how many positive results are incorrect among all the negative cases available during the test.
Independent variable:
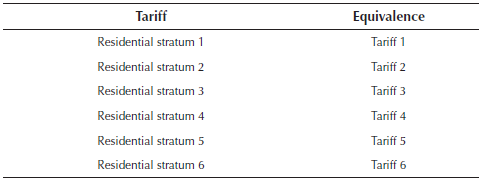
Tariff: it corresponds to the socio-economic level of a user. This variable is also related to the tariff in kWh on the user's electric power service.
For the proposed experimental design, the following scenarios were defined according to the independent variable selected as shown in Table 4. The selected data were randomly selected in groups of 100 users for each tariff. The number of repetitions used was 100. The data between the months of January and July of 2016 were used to verify the detection module performance.
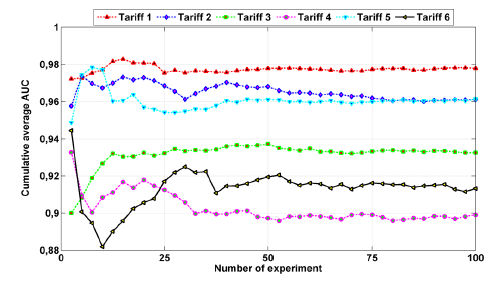
The results achieved are shown in Figure 8, where the accumulated average of the AUC for each type of tariff is displayed. The minimum value reached among all experiments is approximately 88%, a very important fact, since the average success rate of the energy company in the Colombian Caribbean region is 70%. Therefore, the detection rate of fraudulent customers could be increased by at least 18%.
Conclusions
Results in the clustering and prediction stages improved the performance in the detection stage. Figure 8 shows that the proposed methodology allows developing a detection model with an average AUC of 94%. Even from the results, the highest hit rates are concentrated in users of tariffs 1, 2 and 5. This behavior is due to two situations. First, the number of irregular users is greater in tariffs 1 and 2; therefore, they have more samples to define behavior patterns. Second, the number of irregular users is much smaller but the number of non-fraudulent users is greater in tariff 5, therefore, recognition of the patterns of this type of users is made better. In the consumption prediction stage, the proposed model generates adjusted time series very like the original series and for each test the results were very close to each other, i.e., there was not much deviation between the results of each test. Therefore, the proposed model is able to adjust to the real-time series by 87% and predicts values with an average error of 3.5%.
Taking into account the results reached in the detection stage, it is shown that the ANN implemented can work as a reliable tool for the detection of irregular users. However, to obtain suitable results, it is necessary to have a best possible database of samples for the training stage. For the case study, when the neural network is well trained, the results were suitable because the percentage of detection was approximately of 94%. Therefore, the lack of real samples of irregular users can become the greatest disadvantage when implementing an approach such as the proposed in this paper.
As a future work, the authors will continue with the development of an optimization system that provides a suitable route for carrying out recovery billing campaign from the fraudulent users detected.

