


 Inglés (pdf)
 Articulo en XML
 Referencias del artículo
 Enviar articulo por email
 Citado por SciELO
  Citado por Google
  Similares en
SciELO
Similares en
SciELO  Similares en Google
 Permalink
Introduction
This study is part of an investigation line which proposes calculation of earthquake hypocentral parameters by using machine learning techniques, in order to develop an early warning system for the city of Bogotá. Bogotá's Savannah and surrounding areas hold almost a third of Colombian population, being the main economic center of the country with almost 40% of the gross domestic product (Ojeda et al., 2002); this is why a seismic early warning system around Bogotá is so important, and the earthquake depth is one of the main parameter in this system.
The common way to calculate hypocentral parameters, including earthquake depth, consists to apply velocity models for different rock layers of the earth and processing travel time signals of P and S waves recorded in seismic stations (Zhang et al., 2014). In recent years, alternative approaches based on machine learning techniques have been developed, most of them using genetic algorithms (GA) and fuzzy logic (FL). The FL approaches allow efficient exploration of the searching space (Lin and Sanford, 2001), while the GA are manly used to determine X, Y, Z coordinates of earthquake hypocenter (Sambrige & Gallagher, 1993). Ochoa et al. (2014) and Ochoa et al. (2017) successfully applied methods of support vector machines (SVMs) on estimations of hypocentral parameters using only a few signal seconds registered at a single seismological station achieving reliable results.
The aim of this study consist to apply SVMs to figure the earthquakes depth out by using data acquired at the "El Rosal" seismic station. This station is located northwest to Bogotá and it is part of the Colombian seismic network (Figure 1) administrated by the "Servicio Geológico Colombiano - SGC" (Colombian Geological Service). The earthquakes depth distributions around Bogotá are also shown in Figure 1, suggesting high seismicity in surrounding areas.

Source: Authors
Figure 1 Distribution of Seismic Events Around Bogotá. Plane coordinates Gauss Bogotá Origin.
"El Rosal" Station and Dataset Used
The "El Rosal" station employs a Guralp CMG - T3E007 sensor in three components and a nanometrics RD3-HRD24 digitizer, which provides simultaneous sampling of the three channels with 24-bit of resolution (Bermudez & Rengifo, 2002). The used data correspond to three component raw waveforms recorded in the station and its seismic not declustered catalogue of 2164 events, embracing between January 1st of 1998 and October 27th of 2008; all these events located less than 120 kilometers from the seismic station (Figure 1).
Before starting the processing related to SVMs, the waveform files were converted to the American standard code for information interchange (ASCII) format, using a Seisan package tool (Ottemoller et al., 2016). Because of earthquakes with magnitudes lower than 2.0 M_L can be related to man-made tremors, these events along with all extreme or anomalous values were removed, reducing the data set to 863 events. Since the selected seismic records present variable levels of noise, it was necessary to filter them out with both high and low frequency filters. Low frequencies correspond to instrumental noise, easily eliminated through implementation of a high-pass filter with cutoff frequency of 0,075 Hz, and high frequencies were removed with a low-pass filter with cutoff of 150 Hz (Wu & Zhao, 2006).
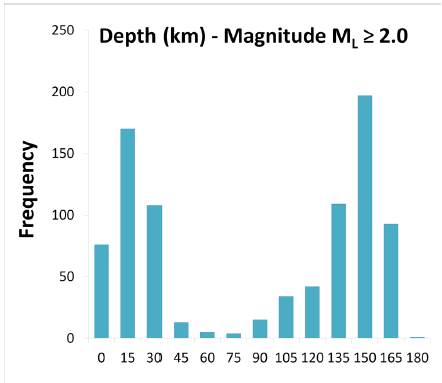
The statistical distribution of earthquakes depth in the area is presented in Figure 2. This bar chart shows a bimodal pattern, suggesting two levels of seismic sources; the first around 15 kilometers and the second around 150 kilometers of depth. The seismicity 15 kilometers of depth is one of the main interests in early warning systems; because of these shallow earthquakes usually produce great damage to near populations.
Support Vector Machines (SVMs)
The SVMs are a group of supervised learning algorithms related to classification and regression problems. When a sample is given to train, it can be separated into classes and train a SVM model to predict the classes within a new sample; a SVM represents the points of a sample in space, separating classes within these points in a widest possible spaces. When new samples are projected in this model, they can be classified to any class in function of proximity of the points. The model of SVM applied in this research is based on its complexity factor "C" and the kernel function selected. The complexity factor regulates accuracy of the model; this factor can lead the model trains properly (generalization), or else, it can reach a point of overfitting. A proper generalization refers the model ability to classify accurately several samples different than the employed during training stage; moreover, overfitting occurs when the model can only classify correctly the sample used during training.
The Kernel function project a dataset in a space of specific characteristics and uses algorithms related to linear algebra, geometry and statistics to identify linear patterns in the dataset. Any solution using kernel methods comprises two phases; first phase consists of a module that performs a mapping of the projected data; second phase contains an algorithm designed to detect linear patterns in the space where this data is projected (Taylor & Cristianini, 2004). The function kernel applied in this study was a polynomial type using the Equation (1).

Where "E" is a parameter representing the kernel exponent and (K) represents the kernel function depending on variables (x) and (y).
The Input Data Set of the SVM
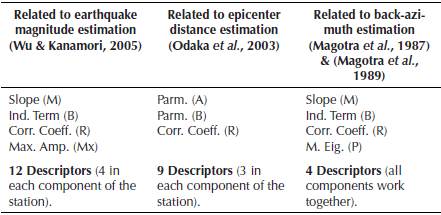
On the first stage, parameters that have been previously used for other authors to earthquake magnitude estimation were calculated and employed as input variables or descriptors for the SVM of this research. In this sense, the relationship between maximum P wave amplitudes and local earthquake magnitudes was considered (Wu & Kanamori, 2005), where a linear regression was performed for each one of the three components. Three parameters were taken from this linear regressions which correspond to slope (M), independent term (B) and correlation coefficient (R). The maximum amplitude values (Mx) obtained for each component's time window were used as descriptors as well. Therefore, each event had 12 descriptors associated with this concept.
In second place, 9 descriptors used for epicenter distance estimation were added, by adjusting a linear regression of an exponential expression in time (t) using the Equation (2).
This equation belongs to the envelope of the seismic record in a logarithmic scale (Odaka et al., 2003) determined also by a linear regression and its respective correlation coefficient (R), for each of component in the seismic station. The correlation coefficient (R) along with the parameters (A) and (B) were calculated for each component of the station; where (B) represents the slope of initial part of P waves and (A) is a parameter related to amplitude variations in time.
Finally, parameters used for back-azimuth determination were used to include information about sources location of the seismic events into the model. Maximum eigenvalues of two-dimensional covariance matrix were used as input, calculated as described in Magotra et al. (1987) and Magotra et al. (1989). A windowing scheme with one second time windows was performed, to obtain consecutive values for which a linear regression was calculated, also determining the slope (M), the independent term (B), the correlation factor (R) of the regression, and this time with addition of the arithmetic mean of the eigenvalues (P). This last processing works with all components of the station together, so only 4 descriptors were added as input related to this process.
In summary, the SVM of this study employs 25 time signal descriptors as input data (Table 1); 12 of them related to works on magnitude calculation, 9 were associated with epicenter distance estimations and the last 4 were used in back-azimuth determination. These descriptors were calculated for 5, 10 and 15 seconds signal of the 863 selected events.

Results
Using the descriptors explained before and real magnitudes for each considered seismic event, a group of 12 datasets were evaluated in order to find the best combination of cutoff magnitude and time signal length (Table 2). Each dataset corresponds to 4 magnitudes (2.0, 2.5, 3.0 and 3.5 M_L) and 3 time signal length (5, 10 and 15 s), along with 7 values of kernel exponent "E" and 6 values of complexity factor "C", summarizing 504 tested models of SVM. This processing was developed using the Weka 3.6 software (Eibe et al., 2016); this algorithm has a strong statistical support and is easily implemented on the station by electronic processing cards. The free parameter "C" and "E" of the SVM were randomly considered in this step, and they were precisely selected after the best combination of magnitude and time signal length was obtained.
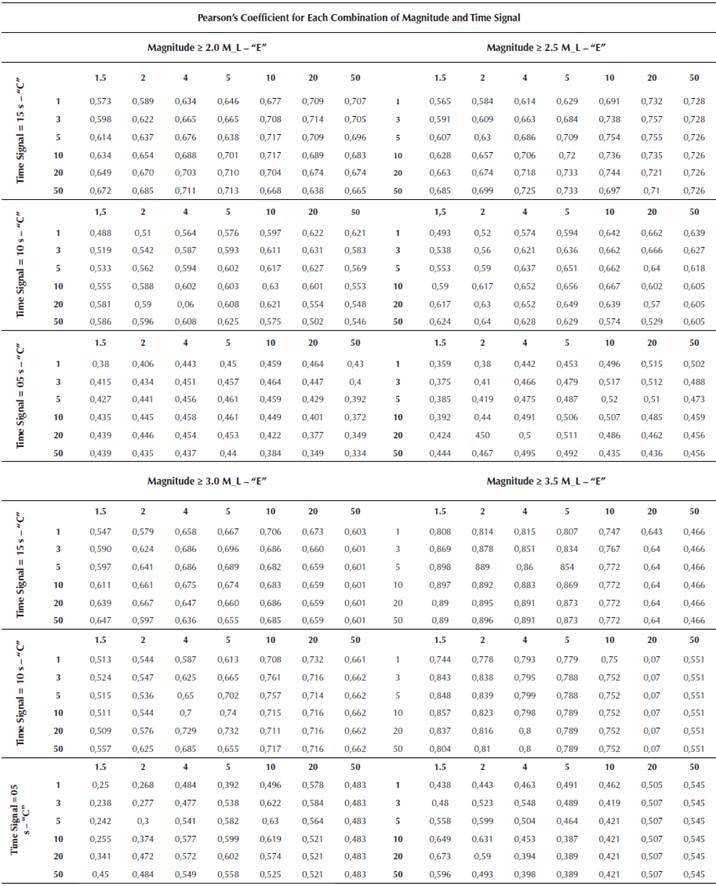
The Pearson's coefficient was calculated for each partition, measuring linear relationship between two variables independently of their scales (Table 2). Positive values mean that two variables change in the same way, i.e. high values of one variable correspond to high values of the other and vice-versa. The closer is this value to one, the greater certainty that two variables have linear relation. It can be observed that best values of Pearson's coefficient are 0.857 and 0.898 for time signals of 10 and 15 seconds respectively with magnitude > 3.5 M_L.
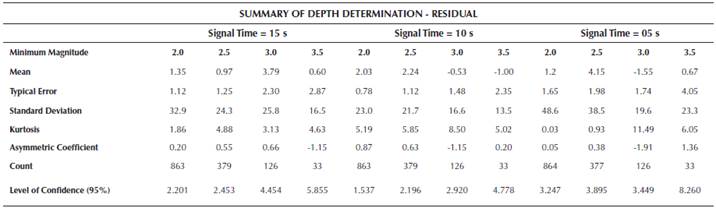
Table 3 shows low standard deviation but high kurtosis for time signal of 10 seconds, indicating that dispersion in residual values is too high and not recommended for depth determination; instead, it is better to choose a time signal of 15 seconds which has standard deviation of 16.5 kilometers and lower kurtosis for a magnitude of 3.5. Once the best combination of magnitude and time signal is obtained, the free parameters "C" and "E" are chosen using the Table 4, where Pearson's coefficient and mean absolute error are presented for each combination. Based on these results, a SVM can be implemented using "E" of 10 and "C" of 2, indicating a reliable model with accuracy of 0,6 ± 16,5 kilometers in earthquake depth determination. Figure 3 shows the cross-plot with relationship between the real earthquake depth (X axis) and the calculated depth by the model (Y axis). The dashed line represents the linear behavior of predicted data, corresponding to the locus where prediction is equal to real values.

Conclusions
The model proposed in this study is an important step towards implementation of an early earthquake warning system for the city of Bogotá - Colombia, and its results can supply reliable information to this system using data of the "El Rosal" station in only 15 seconds before arrival of an earthquake. The accuracy of this study is as high as 0,6 ± 16,5 kilometers in earthquake depth determination, employing a support vector machine with complexity factor of 2 and a polynomial function kernel with exponent of 10.
This model can be implemented in seismological stations directly in the electronic devices embedded at each station, where the main mathematical process corresponds to a simple matrix product involving the given kernel and a vector which contains calculated descriptors of the seismic events.
The results showed in this study are in the same order than (Hsiao, 2011), who reported accuracy of 7,9 ± 6,6 kilometers using data of 5 stations in earthquake depth determination. Also these results are an improvement on that of Romeu (2016) who was as accurate as ± 23 kilometers.
Recommendations
According to Figure 2, this model may be improved by applying two different SVM models; the first one for shallow earthquakes with depth of 15 kilometers and the second for deeper earthquakes with 150 kilometers of depth.
It is important to find ways to improve the prediction accuracy based on further research, supported by computational intelligence and geophysics research groups as well as the seismological network of the Bogotá's Savannah and its surroundings administrated by the Universidad Nacional de Colombia. Additionally, datasets should be complemented with recent seismic events, not considered in this research.

