


 English (pdf)
 Article in xml format
 Article references
 Send this article by e-mail
 Cited by SciELO
  Cited by Google
  Similars in
SciELO
Similars in
SciELO  Similars in Google
 Permalink
Introduction
Jacques & Gonçalves (2016) propose that the credit is an instrument of growth both regionally and nationally and all people should have access to it. However sometimes it is not economically viable, so several Banks choose to not settle branches in several Brazilian cities, turning credit into a narrow resource. In this context, credit Unions might show up as an alternative.
According to BACEN (2018), a credit union is a financial institution formed by an autonomous Association with voluntarily United people, with their own legal form, civilian nature, non-profit, constituted to service their associated members.
According to Bressan et al. (2014), credit unions that provide Financial Services to their associated members, usually with lower costs than market average. In studies such as Eken & Kale (2011), Bijos (2004), Holod & Lewis (2011), Bressan & Braga (2006), there are comments about the credit need for economy development.
The Credit Unions have been increasing in influence. According to Pinheiro (2008), in 1940 there were 239 credit unions in Brazil. In 1990 there were 806, and in 2007 they totaled 1076, with 35 centrals, 2 confederations and 1039 singulars. In despite of the lesser number compared to 2008, the number of associates almost doubled in the same period, from 4,2 to 8,3 million.
Carvalho et al. (2015) found that the size, funding and investments management are directly related to the survival and longevity of Credit Unions in Brazil. Characteristics such as funding and applications are positively related to the maintenance of a Credit Unions in the country and there is concern about the need to balance between social and economic performance.
This work aims to evaluate the efficiency and productivity change of Paraná's credit unions. In order to do so, the following techniques were employed: DEA (Data Envelopment Analysis) and MI (Malmquist Index), both input oriented, considering variables returns to scale. The data selection has been made with PCA (Principal Component Analysis), so the credit union's profile could be better built.
The relative outcome from a credit union depends on, among other factors, from several inputs and outputs. So it is useful to employ an adequate technique to aid in decisions which will influence future outcomes. One of those many tools is MI. It is a technique that makes use of panel data, which, by the way, is based on DEA and has the goal to evaluate the production change of DMUs (Decision Making Units).
The DEA's main feature is that there is no need to investigate relationship between inputs and outputs. However, the quantity of variables (both inputs and outputs) put into analysis is inversely proportional to its quality. For this reason, an independent method of variables selection is indispensable. In the present study, the PCA technique, widely used to obtain information from large databases has been applied (Dong, Mitchell & Colquhoun, 2015; Dong et al., 2015).
Problem Description
The credit union's data used in this work were provided from the OCEPAR System, which is formed by three distinct societies: OCEPAR, SESCOOP-PR and FECOOPAR (OCEPAR, 2016). Those three societies are composed by unions, which divide in singular unions. Those singulars are the subject of this study.
The gathered database includes quarterly observed variables, from January 2009 to July 2015, totalizing 27 observations, in three Paraná's credit unions systems: Sicoob-Unicoob, Sicredi and Uniprime. Each one of those systems is a set of singular unions. The data effectively put under analysis covers 45 singular unions, in the following configuration: 16 from Sicoob-Unicoob system, 24 from the Sicredi system and 5 from the Uniprime system. Each one of those singular unions were taken as an independent DMU.
The data provided from the OCEPAR System presented all the key indicators available in their monitoring software. Thus, the data were wide ranged, treatment being needed before integrating any complex analysis, mainly PCA, DEA and MI. Each singular union had their data categorized, compiled, and presented quarterly, from January 2009 to July 2015.
The key indicators not only represented the singular union's data, but also sometimes economic indicators, grouped data from important sectors to the unions, joined indicators, social information (committee women quantity, as an example), associated members information, among other data. Not all of the indicators presented relevant information for the analysis and were filtered in the way described below.
Employed Techniques
DEA is a non-parametrical technique which uses Linear Programming (LP) and sets an efficiency edge, or frontier, for productive systems. It also compares similar DMUs and ranks them according to their technical efficiency. The DEA models estimate an optimal productive frontier, even a maximum productivity curve. The frontier represents the several possible combinations between inputs and outputs which are efficient, for the analyzed DMUs. If the DMU's production is on that edge, then it will be considered 100% efficient. Otherwise, the DMUs placed under the edge will be labeled according to their distance to the frontier, classified by a percentage.
The DEA methodology has features that may or may not indicate its application, as described in the pioneer work (Banker, Charnes & Cooper, 1984) and followed by many others (Moreno et al., 2015; Machado, de Mello & Roboredo, 2016; Liu, Lu & Lu, 2016; Shokrollahpour, Lofti & Zandieh, 2016).
The goal when applying PCA is to reduce the database size, through linear combinations among the original variables, keeping as much of the information as possible (Pavanelli et al., 2011; Bitar, Madiès & Tamarasco, 2017). This technique sets a vector in a hyper plane, where the sum of the distances to the observed values are the shortest possible. This would be the first principal component.
The second principal component is a vector as well, but orthogonal to the first, with the sum of the distances, again, the shortest possible. Naturally, the distances of the first component will be shorter, because it is set primarily, and the second (and the next) after that, in sequence. It is observed that the most significant variables to the principal components are the most important to the system as well.
Nunes et al. (2015) and Pulido et al. (2017) highlight that this technique is used to reduce the information representation space of a database, constituting a new set in which the variance is preserved in every component. One might then replace the original set for the resulting vectors (vectors extraction) or even identify the main factors of a system and ignore the rest (factors selection) (Camacho, Pico & Ferrer, 2010).
MI is a DEA-derived technique, employed to seek the productivity change in a productive system along the time. When the efficiency index is calculated in a group (1,...,n) of n DMUs, along m periods, then there will be (n x m) efficiency indices. If the nth DMU is efficient at the "1" period, it will not necessarily be again at the m period. Additionally, it is not correct to compare the "1" DMU efficiency at the time "1" against the n DMU efficiency at the m time, as explored in Charnes et al. (1985) and Diewert & Fox (2017).
When data are organized in a panel shape, the MI might be extracted. This shape occurs more frequently when DMUs are evaluated periodically, such as in bank branches (with semiannual or even quarterly business goals), studying environments with bimonthly evaluations, and so on. The MI was first introduced by Caves, Christensen & Diewert (1982) and then developed by many researchers, such as Fare, Grosskopf & Pasurka (2001) and Pastor & Lovell (2005).
Correlated Researches
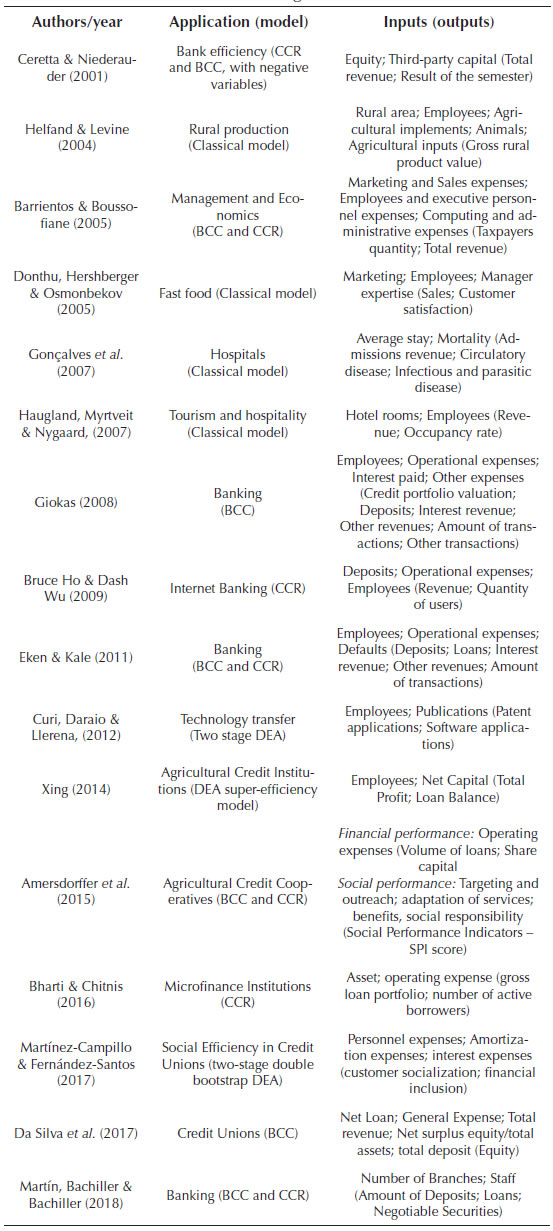
The studies which mainly based this paper, both to set and run the techniques, are briefly presented in the following Table I. The columns bring, in this order: "authors/year", "application area (utilized model version)" and "inputs (outputs)".
Methodology
The used methodology is presented in two steps: firstly the data select and secondly the employed techniques: DEA model, in its BCC version; MI and PCA. The Figure 1, next, represents the timeline of the data selection to the problem analysis.
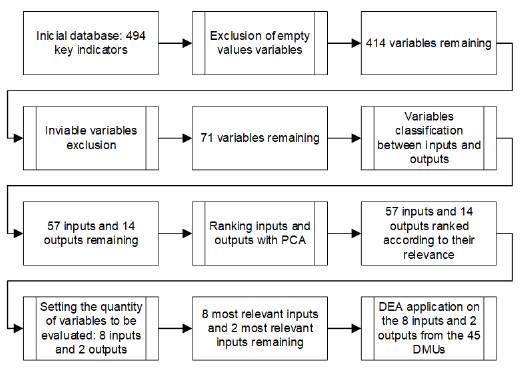
As shown at Figure 1, the database brought initially 494 key indicators, which were reduced firstly to 414 indicators, since many of them did not bring any valid observation in the whole available analyzed period. After that, indicators that repeated economic information were excluded, as well as data which were not from the DMUs themselves, or too specific (and not generalizable), with average values lower than 0,5 (denoting too many gaps along the observations) or with less than 20 observations throughout the entire available period.
After this procedure, 71 key indicators remained in common to every singular union. They were the divided in 57 inputs and 14 outputs. In order to narrow the amount of variables in this work, so the analysis quality would be preserved, it has been observed the criteria stated by Bowlin (1998), which points to 8 inputs and 2 outputs, at most, could be included in the analysis, considering the 45 DMUs available.
The eight best ranked inputs were: "Operational liabilities"; "Funding sources"; "Time deposit"; "Third-party resources"; "Net worth"; "Operational assets"; "Financial reserves and funds"; "Paid-up capital". About the outputs, the two best ranked were: "Income and revenues"; "Available result to the Ordinary General Assembly (Assembleia Geral Ordinária (AGO))".
Negative values for the variables, when occurred, had been replaced by a very small positive number ("1" in this case), following the proposed by Mahdiloo, Noorizadeh & Saen (2011), since this DEA version does not deal with such value range.
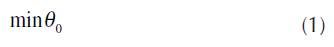
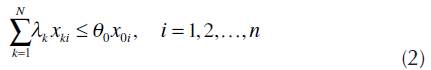
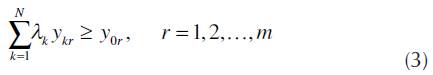
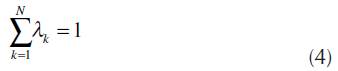
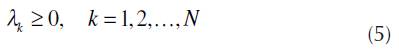
As commented, DEA has many versions. In this work the BCC, input oriented, has been used. The LP model, from (1) to (5), presents it.
Where:
θo - o th DMU efficiency index;
0 - DMU under analysis; N- amount of DMUs;
k - DMU index (k = 1, 2,...,N);
y i . - importance level as a benchmark for the kth DMU to the o th DMU;
i - inputs indices (i = 1, 2,...,n);
n - quantity of inputs;
x ki . - i input of the kth DMU;
x oi - i input of the oth DMU;
r - output index (r = 1, 2,...,m);
m - quantity of outputs;
y kr - rth output of the kth DMU;
y kr - rth output of the oth DMU;
It is worth highlighting that the variable quantity to be utilized within the DEA analyzes, according to Marinho, Cardoso & de Almeida (2012), Fernandez, Koop & Steel (2005) and Unsal & Orkcu (2016), might alter the result of the obtained indexes. Because of that, one can say that the obtained technical efficiency is "relative". There are, as follows, suggestions regarding this amount (maximum or minimum of DMUs):
n° of DMUs > n° of inputs x n° of outputs (Boussofiane, Dyson & Thanassoulis, 1991);
n° of DMUs > 2 x (n° of inputs + n° of outputs) (Golany & Roll, 1989);
n° of DMUs > 3 x (n° of inputs + n° of outputs) (Pastor & Lovell, 2005);
n° of DMUs > 2 x (n° of inputs x n° of outputs) (Dyson et al., 2001).
There are several ways to filter the useful data from a database, in order to highlight only the most important characteristics from a system. A few examples are: PLS (Partial Least Squares), MLR (Multiple Linear Regression), FA (Factor Analysis), among others. In the present study the PCA technique has been employed, which was widely utilized to extract information from databases, according to previous works, such as Dong, Mitchell & Colquhoun (2015) and Dong et al. (2016).
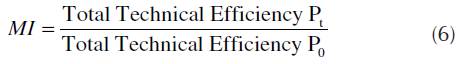
Furthermore, as the data that forms the actual study present themselves in a panel shape, in other words, which characteristics might be observed along the time, it is possible to follow the productivity change. As mentioned before, one efficiency index obtained through DEA is meaningful only if it is compared to the other DMUs that composed the study all together. One DMU might present different efficiency indices if compared in different periods of the DMUs sets. This productivity change is represented by MI which, according to Pastor & Lovell (2005) is obtained through the following (6) equation.
If MI is decomposed, the result would be (7).
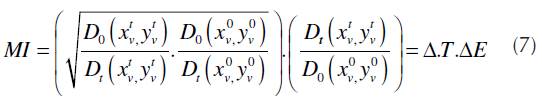
Where:
D0 - relative distance to the frontier, at the 0 period;
D t - relative distance to the frontier, at the t period;
 - amount of the virtual input of the DMU under analysis, at the 0 period;
 - amount of the virtual output of the DMU under analysis, at the 0 period;
 - amount of the virtual input of the DMU under analysis, at the t period;
 - amount of the virtual output of the DMU under analysis, at the t period;
 - distance from the DMU production at the 0 period to the production frontier at the 0 period;
 - distance from the DMU production at the 0 period to the production frontier at the t period;
 - distance from the DMU production at the t period to the production frontier at the 0 period;
 - distance from the DMU production at the t period to the production frontier at the t period;
(T - frontier shift between 0 and t periods;
(E - catch-up effect between 0 and t periods;
The two main factors for the MI to be calculated are the front year shift and the catch-up effect among the analyzed period. The frontier shift, in other words, the technology variation is a reference to the best productive practices, which build the efficiency frontier, which changes along time. The catch-up effect is an allusion to the individual effect of every DMU to follow the best productive practices.
Results
For the PCA implementation it has been utilized the Microsoft Excel supplement Multibase, by Numerical Dynamics Japan. The efficiency indices were calculated through DEA's BCC version through the MaxDea Basic software, developed by Beijing Realworld Software Company Ltd, version 6.6, input oriented, taking into account variable scale returns. The NI application as performed through the DEA-Solver-LV 8.0 Software, developed by Professor Kaoru Tone.
The DEA's BCC versions methodology application input oriented has been made through the mathematical model (1) to (5). Thus, it is obtained a set of results for each one of the 27 available quarters for the 45 DMUs, considering 8 inputs and 2 outputs already selected.
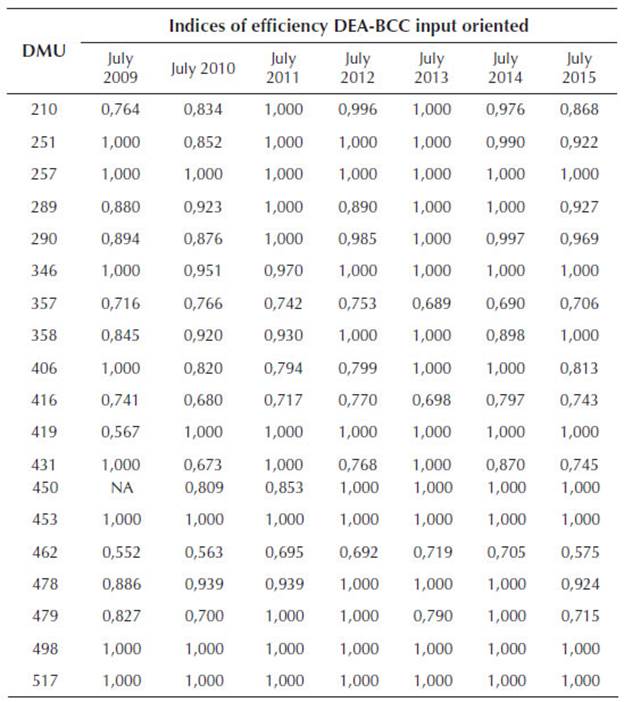
The efficiency sets are partially presented in the Table 2, which presents a quarter per analyzed year of some singular unions (DMUs).
Table 2 Efficiency indices of 19 (from a total of 45) Paraná's Credit Unions between 2009 and 2015
Source: Authors
It is noticeable that among the 1194 evaluations (in other words, 45 DMUs evaluated over 27 periods, taking out of account 21 specific situations where the indices were not analyzable) from which only 19 are represented at the Table 2, 673 (56% from total) have been considered 100% efficient. As such, 44% of the observations might be able to help the decision makers, because they brought weak points to light.
It is also observable that some DMUs were considered 100% efficient in every analyzed period, e.g. singular unions 453, 498 and 517. They could be stated as benchmarks. On other hand, there was no DMU which was not considered 100% efficient at least once, even in some cases (e.g. DMU 462) the indices brought to the Table 2 do not evidence any of such total efficient period. This might indicate that the practical differences which lead to an efficiency level improvement may not be so clear. Nevertheless, it is still possible to notice the difference between certain singular unions attitude along time, such as 257 (100% efficient in every analysis) and 452 (100% efficient in only two occasions: 01/2010 and 01/2013, both absent from the Table 2). In this case, the efforts of those two units might be heading different directions, or even be under influence of some external force. In either situation, further investigation is indicated.
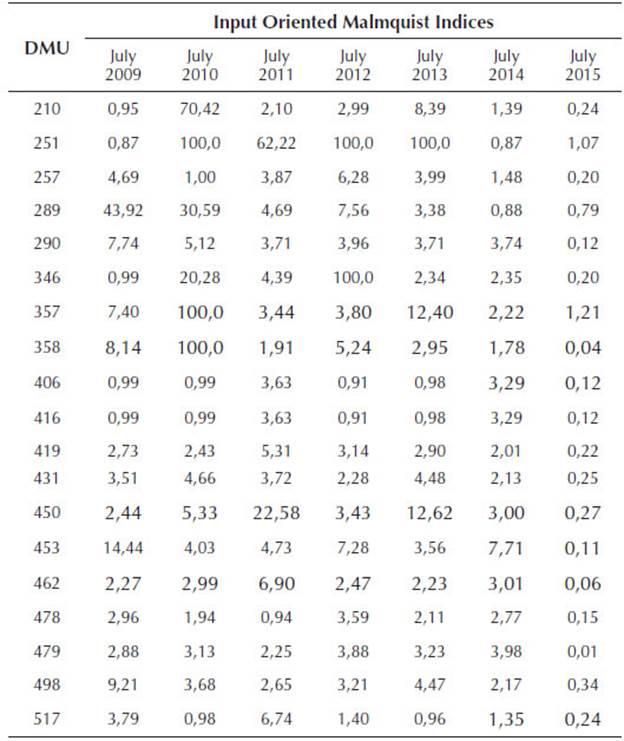
The MI extracted from the provided data supplied the results presented (partially) in the Table 3, next. The efficiency indices were obtained based on the previous period to the indicated semester at the top of the column at the Table 3.
Table 3 Malmquist Indices of 19 (from a total of 45) Paraná's Credit Unions between 2009 and 2015
Source: Authors
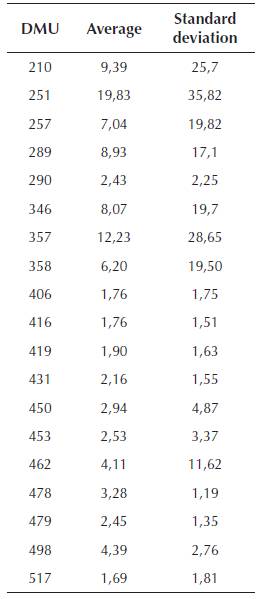
Taking into account the Table 3 results, one can understand that for the singular union 210 there has been a consistent productivity increase from July 2009 to July 2014, because MI > 1. Otherwise, there has been a productivity decrease from July 2014 to July 2015, because MI < 1. In this way it is possible to understand the productive behavior of the other singular unions along the studied periods. The Table 4 shows the MI and their standard deviations for every DMU.
With both evaluations, BCC version DEA and MI, it becomes explicit how different the DMU's outcomes are. The index efficiency at one period gives the decision maker a vertical point of view of the current quarter. The MI, otherwise, provides a long term point of view of all DMUs productivity. Both approaches are valid and important, as they might help to lead to a more comprehensive benchmark settling, aiding managers as corporative policies and culture are developed.
Moreover, the obtained results from the MI were particularly enlightening (Tables 2 and 3), as they brought a consistent variation of the unions behavior. The ones which seems to be efficiency oriented (such as 251, 357 and 358), had their peaks measured through MI, and also presented some of the best averages and standard deviations. On the other hand, the opposite seems to be true. The DMUs 406, 416 and 498, as examples, looked to have an inefficiency and low productivity tendency.
Conclusions
The present research shows DEA is an important tool to com-pare productive units, in order to fundament resources optimization. It is then possible to identify potential yet to be explored among DMUs. There is also the possibility to highlight important resources to be spared and other relevant information. In an environment such as actual Brazil, where Credit Unions often fail due to the lack of management skills (Carvalho et al., 2015), this type of tool is especially useful. If such knowledge would be more widely available, it would certainly help the management board and decision makers to choose their attitude in a clearer way. Even with accounting key indicators being used to predict financial problems since the 60's (Beaver, 1966), there are still novel ways to explore this source of information, as the one proposed in this paper.
Some observations might be done about the MI outcomes. The range between the biggest and the smallest average was important. Thus, in the actual research, the goal to aid in units discrimination has been achieved. As the relative efficiency measure gets more disperse, it makes easier to the decision maker to identify benchmarks and underexplored units.
The dichotomy between social and financial results might push the Credit Unions to choose among the roles to play: keep close to the associates, investing in social improvement and being part of the Government policies for undeveloped areas or move towards a bank-oriented role, searching for economic efficiency (Carvalho et al., 2015). Again, the combined methodologies (DEA/MI and PCA) might help the decision makers to choose carefully and be aware of goals to achieve. It is known that Credit Unions often start with insufficient planning, low professionalism and poor technical background (Braga et al., 2006). If planning and performance evaluation tools, such as the ones presented, were used, the failing and exiting Credit Unions quantity would certainly decrease.
Nevertheless, as any tool of this type, there is need of a specially trained analyst. The DMUs choice and periods to put under analysis might alter the results. One possibility to further re-search is the integration between the tools used in this paper with others that include decision makers preferences such as Maximum Attribute Utilization Technique (MAUT) or preferences optimizations.


