


 English (pdf)
 Article in xml format
 Article references
 Send this article by e-mail
 Cited by SciELO
  Cited by Google
  Similars in
SciELO
Similars in
SciELO  Similars in Google
 Permalink
Introduction
The operation of wastewater treatment systems has been based mainly on the optimization of the biological and physicochemical processes that are involved in the degradation of a large number of organic pollutants (Pérez-Pérez et al., 2017). However, the efficiency of these systems is fundamentally linked to the hydraulic behavior of each treatment unit (Karim et al., 2005). In these units there should be an adequate contact between the microorganisms and the residual water, and operation within an optimum hydraulic retention time (HRT) to achieve the required efficiency levels and those proposed during the design of the treatment system (Odriozola, López and Borzacconi, 2016). However, the fluid tends to deviate from this ideal hydraulic behavior (Mao, Feng, Wang and Ren, 2015), due to factors such as the shape of the system, the scale, the hydraulic characteristics of the input and output structures, the presence of biomass, and environmental conditions (Nicolella, van Loosdrecht and Heijnen, 2000). These factors produce unfavorable hydraulic conditions or flow channels, such as dead zones, inertial currents and hydraulic short circuits (Fuentes, Scenna, and Aguirre, 2011), which reduce the HRT and decrease the efficiency of the system (Pérez-Pérez, Pereda-Reyes, Pozzi, Oliva-Merencio and Zaiat, 2018).
These hydraulic difficulties are currently subject to great interest, which has led to an increase in studies to modify or optimize biological technologies in order to enhance their ability to deal with the global problem of wastewater treatment (Batstone, Puyol, Flores-Alsina,and Rodríguez, 2015). Water pollution is an increasingly complex problem due to the presence of a large number of pollutants with different physical and chemical properties that are recalcitrant and present low degradation. For this reason, it is necessary to achieve an adequate performance of the systems used for the water treatment (Ahmed and Rodríguez, 2018). Many of these pollutants are part of the composition of domestic and industrial wastewater, which must be treated before being discharged to natural water bodies, in order to minimize harmful impacts on aquatic environments and human health.
The study of different hydraulic conditions of treatment systems, mainly with regard to biological technologies (Barrera et al., 2015), is a contribution towards improved bioremediation of wastewater. This aims not only to decrease parameters such as COD and BOD, but also to remove microcontaminants such as pesticides, pharmaceutical and personal care products.
Regarding systems using anaerobic processes, some hydraulic improvements have been made. For example, the modification of the sludge mantle reactor with upward flow (UASB) has been applied to an expanded mud blanket with upward flow (EGSB) (Fuentes et al., 2011). This reactor is characterized by operation at flow rates > 4 m/h (Hwu, van Lier and Lettinga, 1998), which are achieved due to the high height/diameter ratio and the high rate of recirculation of the effluent. This favors mixing inside the reactor and optimizes the contact between the biomass and the substrate to be degraded. As a result, efficiency is improved in the removal process of organic matter and the EGSB system becomes an attractive form of technology for the treatment of wastewater (Wang, Zhang, Zhang, Qaisar and Zheng, 2007).
Studies on the hydraulics of EGSB reactors have reported complete mixing conditions for these systems. However, few researchers have tried to ascertain in detail the hydraulic behavior of these reactors under different operating conditions, for example with extreme values of HRT and the presence of granular biomass. An alternative to better understand the hydraulics of these systems is through the analysis of the residence time distribution (RTD). In RTD, the time that the elements of a fluid remain inside the reactor is evaluated through the stimulus-response test or dispersion studies using tracers (De Nardi, Zaiat and Foresti, 1999).
Meanwhile, mathematical analysis and simulation models are used to understand the quantitative behavior of biological systems, in addition to predict the overall performance of a reactor. These can help in the start-up, operation, and characterization of the dynamics and control of reactors, as well as in the estimation of the times required to reach stable states when disturbances occur (Pérez and Torres, 2008).
In the literature, few models to characterize the non-ideal flow of EGSB reactors have considered the recirculation effect. These are often limited to black box models, where only the input and output of the system are considered (Pereda Reyes et al., 2014). In order to improve the knowledge about the hydrodynamics of this kind of reactor, it is necessary to include the study of the convective or diffusive phenomena that predominate in the expansion zone and the separator. For this purpose, the Peclet number is calculated for each condition by applying an axial dispersion model, which allows to model the hydrodynamics of the reactor with greater precision. This type of model has been used to describe the non-ideal flow patterns of the liquid phase of upstream reactors at pilot scale (Bhattacharyya and Singh, 2010). The objective of this study was to evaluate the distribution of the retention time in different EGSB anaerobic reactors, in order to elucidate the way in which the liquid mass has been subjected to the treatment system. We evaluated the influence of various factors such as the geometry of the reactor, the presence of granular biomass, and different HRT values in the operation of the systems. For this purpose, the stimulus-response test was used, as well as the construction of a mathematical model that fits and describes the hydraulic performance of each reactor.
Materials and Methods
General assembly of EGSB reactors
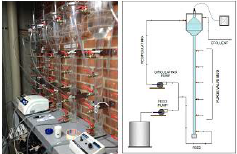
The reactors were constructed using transparent acrylic sheet. They were formed by three main units that highlighted the most important characteristics of the system (Figure 1): an upper part that favored solid-liquid-gas separation; a body formed by a thin cylinder that allowed the expansion of the mud; and a support formed by a perforated plate for the uniform entry of the feed flow. The diameter of the cylinder was 4,4 cm, with a total height of 85 cm. An effective volume of 3,4 L and an expansion volume of the sludge mantle of 1 L were obtained.
Source: Authors
Figure 1 General scheme of the sampling valves and the flow and recirculation system.
The gas collection hood (Figure 1) located inside the structure of EGSB systems was supported by two partitions that allowed water to rise at the outlets of both the effluent and the recirculation ducts. Gases were led by hoses to plastic bags, where they were stored. Additionally, this hood helped to retain the sludge that had not settled.
The operation of each reactor consisted of the tributary inputs through the lower part, where it was evenly distributed by means of a perforated plate. There were two output devices in the upper part.: one responsible for the recirculating part of the effluent and another for evacuating the excess flow. This system was installed in a closed space, avoiding maximum exposure to ambient conditions.
Stimulus-response test for the determination of RTD
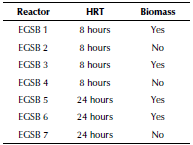
Analysis of the hydraulic behavior of the seven EGSB systems was carried out using potassium bromide as tracer substance. The total concentration of the tracer within each reactor was calculated as approximately 150 mg/L Br-, assuming a predominance of complete mixing in the system.
The tests were carried out independently for each system. The pulse preparation was carried out in 25 mL of distilled water with a Br- concentration of 20 400 mg/L. It was injected into the affluent of the reactors, which were subsequently operated continuously for a period of 3 times the HRT with an up-flow velocity of 3 m/h. In the test, two fundamental parameters were evaluated: the effect of the presence or absence of granular biomass; and the two hydraulic retention times used (8 and 24 h). For this purpose, the experimentation was set up in accordance with the description in Table 1.
Analysis and quantification of bromides
RTD analysis using the stimulus-response method was carried out by monitoring the concentration of the bromide in the effluent of each EGSB system at different time intervals. The quantification was carried out by ion chromatography using a Dionex ICS-1000 ion chromatograph. The operating conditions were as follows: equipment pressure of 1 5002 100 psi, workflow of 1 milliliter/minute and conductivity below 30 μs. The column used was a Thermo Scientific Dionex IonPac AS14A of 0,25 meters length and 4 millimeters diameter, with a 7-micrometer film. The pH range was between 2,0-10,0. A Dionex standard was used. The retention time of the bromide was approximately 5,5 min.
Mathematical modeling for the actual flow: Hydraulic behavior of an EGSB system
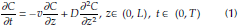
Axial dispersion model. The most used and simplest model to describe flow systems, where both convection and diffusion are important, is the axial dispersion model (Aris, 1999; Danckwerts, 1953; Taylor, 1953) with the Danckwert boundary conditions. The model is based on the following equation:
which in its dimensionless form becomes:
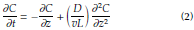
where C(z, t) is the concentration of the tracer, a function of time t and the coordinate of axial position of the system z; D is the axial dispersion coefficient; and v is a constant average axial velocity, which does not depend on z. The first terms on the right side of Eq. (1) characterize the dispersive term and L, which is the length of the reactor (length of the tube plus length of the separator). The second term determines a convective transport of component C in the vertical direction. The Danckwerts-type boundary conditions (Danckwerts, 1953) are:
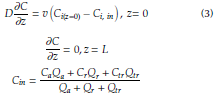
where Ci-in is the input concentration, Qa is the influent flow, Ca is the influent concentration, Qr is the recirculation flow, Cr is the concentration of recirculation, Qtr is the flow rate of the tracer and Ctr is the concentration of the tracer. Qtr and C tr can be calculated from the time of injection and the volume injected.
Originally, Danckwerts boundary conditions were formulated for mass balance equations in discontinuity interfaces between piston flow and dispersive flow in chemical reactors (Danckwerts, 1953). They were then expanded to describe the effects of axial dispersion dueto maldistribution of the flow in the heat exchanger. The group without dimensions
 is the Peclet number (Pe), i.e. the parameter that quantifies the extension of the axial dispersion. It has the following limits: for the ideal mixed flow, the Peclet number is 0; and for an ideal pulse flow, it is infinite.
 Minimum dispersion, therefore plug-flow.
 Large dispersion, therefore mixed flow.
For the solution of the model equation, we used the finite central difference method of order 2. The aim of using finite difference methods to solve Eq. (1) is to replace spatial and temporal derivatives by appropriate approximations, and then to solve the equations of the resulting differences numerically.
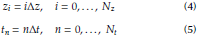
The first step in the discretization procedure is to replace the domain [0,L] X [0, T] with a set of mesh points.
In addition,
 denotes the approaching mesh function C(x
i
; t
n
) for i = 0,…,N
z
and n = 0,…,N
t
: Requiring Eq. (1) to be fulfilled in a mesh point (x
i
; t
n
) leads to the equation:
denotes the approaching mesh function C(x
i
; t
n
) for i = 0,…,N
z
and n = 0,…,N
t
: Requiring Eq. (1) to be fulfilled in a mesh point (x
i
; t
n
) leads to the equation:
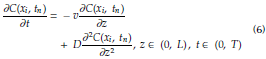
The next step is to replace the derivative with approximations of finite differences. The simplest computational methods arise from the use of a direct difference in time and a central difference in space.
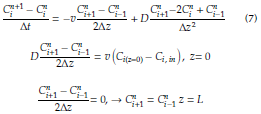
We have turned the Eq. (1) into algebraic equations, also often called discrete equations. The key property of the equations is that they are algebraic, which makes them easy to solve. As usual, we anticipate that
 is already calculated, so that
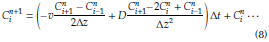
 is the only term unknown in Eq. (7). To resolve with respect to this unknown, Eq. (8) is used:
The derivative of the boundary condition was also replaced by finite difference approximations.
When solving equation (8), the domain was divided into two regions. These were two tubular reactors in series: the first the region of the tube and the region of the separator. The length of each region is divided into small elements of length equal to Δz. The computational algorithm pseudocode was developed using MATLAB software.
Results and Discussion
Distribution curves
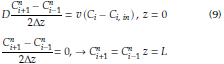
Curve C(t). The distribution of tracer concentration in the effluent of the EGSB systems over time (curves C) are presented in Figure 2.
Source: Authors
Figure 2 Tracer Behavior through EGSB systems applying a hydraulic retention time of a) 8 hours and b) 24 hours.
The results of the C curves obtained for each test showed a similar and defined trend of the tracer within each EGSB reactor. For the theoretical HRT of 24 hours, the behavior was more uniform, while for the HRT of 8 hours, the peaks of maximum concentration presented some differences. This may be linked to failures at the moment of application of the pulse, which in some cases takes more time to enter than others. However, no significant effect of the biomass was observed on the behavior of the tracer distribution in the effluent of the operated systems at a HRT of 8 h. These results seem to indicate that the presence of the granular sludge did not prevent the homogeneous distribution of the flow within these reactors. In addition, it should be considered that the maximum concentration peak of the bromide within the systems could have occurred when samples were not taken, since monitoring was not second by second, but at longer time intervals.
In the graphs, the first-time values showed that the concentration of the tracer was increasing progressively from zero to the peak of maximum concentration. This behavior has been reported as characteristic of real reactors with a combination of piston flow and complete mixing (Arroyave, González Arteaga and Gallego, 2005). Additionally, for the majority of the systems that operated with HRT of 8 h, a single peak of maximum concentration was observed, independently of the presence or absence of granular biomass. This condition allows the nonexistence of short circuits in the hydraulic performance of the EGSB systems to be inferred and was not observed only in the cases of EGSB reactors 5 and 6, which operated with a HRT of 24 h and with the presence of biomass. After the maximum concentration peak, another peak with a slight increase was observed, which theoretically indicates the presence of short circuits in these systems and, consequently, an effect of the biomass combined with the high value of HRT.
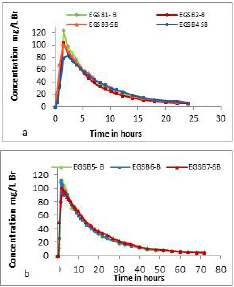
Curve E(t). Curve E represents the distribution of the ages of the fluid that leaves a system or a container, in this case, corresponding to the time required by the tracer to pass through the EGSB reactors. This is presented in Figure 3.
Source: Authors
Figure 3 Curves E applying a hydraulic retention time of a) 8 hours and b) 24 hours.
According to the trends reported, the normalized behavior of the tracer within the reactors reflected a hydraulic performance with a tendency similar to complete mixing flow. This condition will be discussed later in the analysis of the F graphs that are illustrated below.
Curve F. Curve F is used to describe the cumulative concentration of the tracer at the outlet by measuring the concentration in the reactor in relation to the initial one (C/C 0 ).
Curve F shows an increase in the bromide concentration in the output current of each reactor evaluated. The behavior in the distribution of the remnant tracer is shown in Figure 4a. At the beginning of the curves, there is a small upward concave tendency, and subsequently a concave downward curve. It should be noted that initially the curve has a steep slope, which softens after the equilibrium state. The nature of this curve indicates a strong tendency to a complete mixing flow pattern, but the possibility of a combination with piston flow is not ruled out. In Figure 4b, the behavior of the curve is completely concave downward, without sharp increases or decreases. This suggests that for these conditions the reactors behave like full mix reactors.
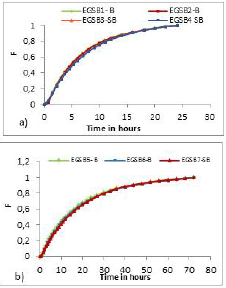
Source: Authors
Figure 4 Curves F: a) Aplying a hydraulic retention time of 8 hours and b) 24 hours.
Figure 5 logically presents a behavior that is analogous to curve F (Figure 4). For this trend, a homogeneous behavior is evident without the apparent presence of hydraulic problems such as short circuits, dead zones or recirculation that impede the effective performance of each reactor.
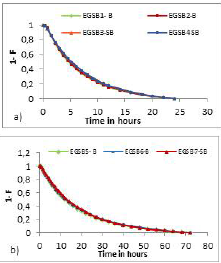
Source: Authors
Figure 5 Curves 1-F applying a hydraulic retention time ofa) 8 hours and b) 24 hours.
Qualitative analysis of the trend of the tracer concentration curve in the reactors
When applying the stimulus-response test in a reactor, analysis of the samples obtained in the effluent of the system reveals that concentration increases with time, until reaching a maximum and then decreasing progressively. This results in a curve showing the behavior of the concentration of the tracer vs. the time, which is also known as curve C. This graphical representation can be analyzed qualitatively according to the criteria described in Table 2.
Table 2 Values of the experimental times obtained for each of the EGSB systems used for the qualitative analysis of the curves trend
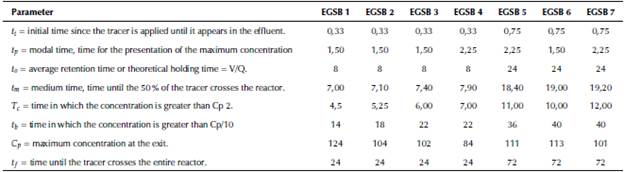
Source: Authors
Table 3 exposes the results o the qualitative analysis for each of the EGSB systems using the criteria presented in Table 2.
Figure 3 Relations between experimental times and theoretical time for the trend analysis of the tracer distribution curve [8, 10]
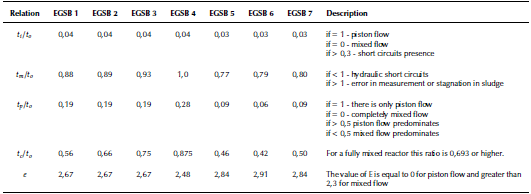
Source: Authors
The results of the qualitative analysis of the tracer test are consistent with the behavior described in the analysis of the DTR curves. In this analysis, the hydraulic performance of the EGSB systems was evaluated, demonstrating a tendency towards a complete mixing flow pattern with little or no presence of dead zones or short circuits within the treatment units (Table 4).
Table 4 Application Results of the axial dispersion model for each of the EGSB systems
Source: Authors
Validation of mathematical model
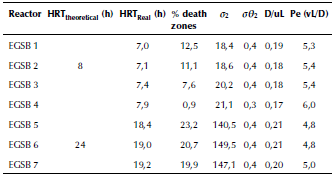
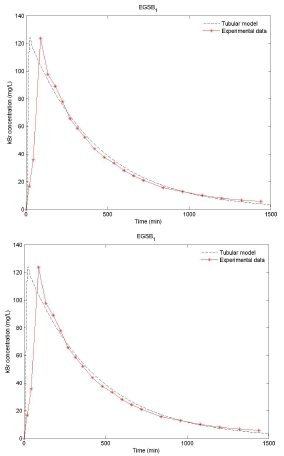
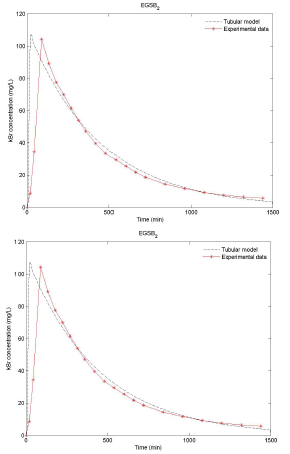
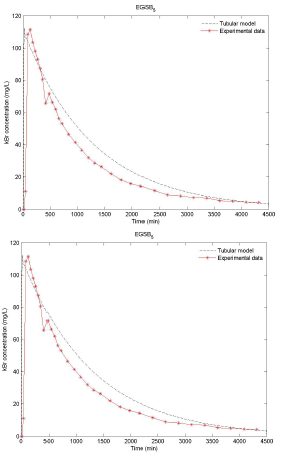
Figures 6 to 9 present the results of the experimental curves and the adjustment obtained with the proposed model.
Source: Authors
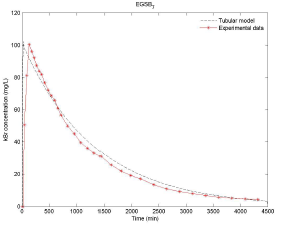
Figure 6 Distribution functions of residence times, experimental and theoretical, for the EGSB operated with HRT of 8h and with the presence of granular biomass.
Source: Authors
Figure 7 Distribution functions of residence times, experimental and theoretical, for the EGSB operated with HRT of 8h and without the presence of granular biomass.
Source: Authors
Figure 8 Distribution functions of residence times, experimental and theoretical, for the EGSB operated with HRT of 24h and with the presence of granular biomass.
Source: Authors
Figure 9 Distribution functions of residence times, experimental and theoretical, for the EGSB operated with HRT of 24h and without the presence of granular biomass.
Figures 6 to 9 show the results of the tracer at the exit of each system and it is evident that the model developed presents a good adjustment to the behavior of the reactor. It is worth mentioning that the injection of the tracer was performed simultaneously to each system. However, small variations in time and pulse inflow could occur during the execution of the test, which may cause differences between the peak and the experimental model. Another possible cause of this difference in the peak is the starting point of the data collection. In the experimental test, time zero was considered immediately after the injection of the tracer, while for modeling, time zero should be considered as the start of the injection (Pereda Reyes et al., 2014).
Results of the tracer test analysis allowed the real HRT values for each EGSB system to be obtained. This allowed to define, with regard to the four reactors that operated with an HRT of 8 h, that the spaces or dead zones within each system were small, ranging between 0,9-12,3 %, without a significant effect on the part of the granular biomass. In the case of reactors operated with a HRT of 24 h, a small increase in dead zones was observed, varying in a range of 19,9-23,2 %. This behavior was verified independently of the presence and/or absence of granular biomass.
The values of the high number dispersion
 > 0 > 0,01 correspond to a fast dispersion of the tracer, indicating the presence of a mixed flow. Values
< 0,01 indicate a slow dispersion, while
= 0, means that there is no dispersion, hence piston flow predominates. The results of the dispersion number for each of the reactors evaluated in this study showed values higher than 0,01. This condition indicates a high degree of dispersion and a marked tendency towards mixed flow, which is consistent with the analysis of the curves presented above. Other studies carried out to analyze the hydraulic performance of EGSB reactors have reported flow characteristics congruent to those obtained in this test. Bhattacharyya evaluated. Reference was corrected the performance of EGSB systems with different rates of ascensional flow and HRT values. The results reported through these studies were under conditions of completely mixed flow with low percentages of dead zones.
> 0 > 0,01 correspond to a fast dispersion of the tracer, indicating the presence of a mixed flow. Values
< 0,01 indicate a slow dispersion, while
= 0, means that there is no dispersion, hence piston flow predominates. The results of the dispersion number for each of the reactors evaluated in this study showed values higher than 0,01. This condition indicates a high degree of dispersion and a marked tendency towards mixed flow, which is consistent with the analysis of the curves presented above. Other studies carried out to analyze the hydraulic performance of EGSB reactors have reported flow characteristics congruent to those obtained in this test. Bhattacharyya evaluated. Reference was corrected the performance of EGSB systems with different rates of ascensional flow and HRT values. The results reported through these studies were under conditions of completely mixed flow with low percentages of dead zones.
Based on the foregoing, it is clear that the complete mix flow pattern governs the hydraulic performance of EGSB systems, under various operating conditions. This is related to the high dispersion values obtained inside the treatment unit.
Conclusions
The hydrodynamic analysis of the EGSB systems allowed them to be characterized as completely mixed reactors, regardless of the HRT evaluated and/or the presence or absence of granular biomass. However, the best performance was obtained by the reactors evaluated with an HRT of 8 h, since they seem to contain no short circuits and, additionally, presented lower percentages of dead zones.
The reactors evaluated with an HRT of 24 h presented dead zone percentages of around 20%, which were not very large but were higher than for the HRT of 8 h. Additionally, for these reactors, the presence of short circuits (EGSB 5 and 6), the combined effect on hydraulic performance of the existence of granular biomass and the high HRT value cannot be ruled out.
The axial dispersion model used for the flow behavior inside the EGSB reactors presented a good fit to the experimental data. This indicates an accurate selection of the model. Additionally, this indicates that the configuration of the systems presented a complete mixing flow pattern, which is in contrast with the analysis performed through curves C, E and F.


