


 English (pdf)
 Article in xml format
 Article references
 Send this article by e-mail
 Cited by SciELO
  Cited by Google
  Similars in
SciELO
Similars in
SciELO  Similars in Google
 Permalink
Introduction
When working in incident management activities, managers need to understand the actions to take and the life cycle of the incident, which includes detection and recording, user support, investigation and diagnosis, resolution and recovery of service, incident ownership, monitoring, and communication (OGC, 2007). According to Lu et al. (2016), service level agreements (SLAs) have been proposed as contracts used to record the rights and obligations of service providers and their customers, including the fault-tolerance concerns and strategies. Hanemann, Sailer and Schmitz (2004) state that to avoid SLA violations, managers should identify the root cause of a fault in a very short time or even act proactively.
Service and network managers monitor events and perform actions based on fault management information and management recommendations and standards, such as ITU-T (1995). The process of fault management tries to identify events and take corrective actions or activate notifications that allow a proper intervention. The study of the business risk involved in network management has been highlighted as one of the ways to find a more effective link among the levels of strategic, tactical and operational management.
The decision about network points that need interventions, including the creation of redundancy measures, has always been a topic of discussion among network and service managers (Stein, 1999). The need to consider business aspects in this activity has considerably increased the complexity of this challenge for service managers.
This paper proposes an incident management supporting model, implemented in a software tool, for identifying and signaling critical points that can be redundant in an optical network (Ramaswami, and Sivarajan, 2001), based on the risk to the business. When defining critical network redundancy points, managers can use model outputs to make better decisions and improve the fault management process. A case study was carried out in a real company, using two simulation scenarios of reference networks.
The remainder of this article is organized as follows. Section 2 includes theoretical foundation for the research and discusses related work. Section 3 shows the detailed design and implementation of the model. Sections 4 and 5 show the case study and result analysis, respectively. Finally, the conclusions and future work are described in Section 6.
Related work
IT services can be provided using other services called subservices and resources (e.g., network links, network components, etc.). Organizations need to be aware of and manage the risks related to their vital assets. Managers need to plan and to be aware of both the probable and improbable events (Gómez, Mora, Gewald, Nebel and O'Connor, 2017). Risk management addresses situations that can be classified as opportunities or threats. The need to develop and maintain control over the interdependencies among network infrastructures was presented in Bloomfield, Popov, Salako, Stankovic, and Wright (2017).
The process of incident management seeks to restore a normal service operation as quickly as possible and minimize the impact on business operations (OGC, 2007). A problem record should be created when multiple occurrences of related incidents are observed. The main goal of problem management differs from incident management, because the latter focuses on the detection of the underlying causes of an incident and the best resolution and prevention. An incident can appear again if the problem resolution is not found. An incident is where a failure or an error occurs. Incidents are usually more visible and its impact on business is more immediate. The result of network diagnostics, revealing that some systems are not operating is considered a problem (OGC, 2007). According to Hanemann et al. (2004), a fault does not lead to the total failure of a service, but its quality of service (QoS) parameters, i.e. service levels agreement (SLA), might not be met.
According to Specialski (2018), failures are not the same as errors. A failure is an abnormal condition whose recovery requires management action and is usually caused by incorrect operations or an excessive number of errors. A failure is a persistent abnormal condition that requires an immediate repair action (e.g. interrupt a communication link). Meanwhile, an error is an occasional abnormal condition (e.g. bit error or sync failure on a communication link). Fault management includes resource monitoring, verifying the network point and predicting when a failure or an error can occur. Managers need to isolate the failure point, seek alternative solutions until problem resolution, in order to reduce the impact on the whole system (and its consequent business impact), and to repair the fault. Hanemann et al. (2004) state that a single fault can cause a burst of failure events. There is a high cost for repairing and restoring a network. Mas, KrauB and Casier (2011) affirm that fault management is one of the most expensive operational processes.
Fen Yanqin and Li (2016) argue that many unsurpassable problems have appeared in traditional transmission networks, which motivates the development of smarter optical networks. Due to the usually high data traffic in optical networks, the number of alarms sent from a fault is often very large, making human work quite complicated and slow (Meira and Nogueira, 2000). In order to facilitate this task execution, solutions called fault localization algorithms were proposed (Mas, Thiran and Le Boudec, , 1999; Mas,Tomkos and Tomguz, 2005; Mas and Thiran, 2000; Lehr, Dassow, Zeffler, Gladisch and Hanik, 1998).
Alarms received by the network management system (NMS) or the contact of the customer service line can initiate the fault management process (Mas et al., 2011). Configuration or physical failures can trigger different subprocesses. Time interval between the first symptom that a service does not perform properly, and the verified fault repair needs to be minimized, especially with respect to SLAs, as such agreements often contain guarantees like a mean time to repair (Hanemann et al., 2004).
Organizations need to be aware of and manage the risks associated with their vital assets. Managers need to plan and prepare for probable and improbable events (Gómez et al., 2017). According to Benhcine, Elbiaze and Idoudi (2013), network resiliency has become one of the major requirements of the service provider to deploy real-time applications and meet the customer's quality of service (QoS) needs. The loss time and the convergence time after link failure were evaluated in different scenarios. Fast Reroute protection efficiency has been affected by the network size. Loss time increases as network topology size does.
Sterbenz et al. (2010) proposed a systematic framework architecture that unifies resilience disciplines, strategies, principles and analyses. The rule was to defend, detect, correct, recover + diagnose and refine. The ResiliNets strategy leads to a set of design principles that guide the analysis and design of resilient networks. In Smith et al. (2011), a systematic approach to network resilience is described. The aspects of this work represent a longer-term view of resilience and require more radical changes in the way network operators currently think about resilience.
Da Silva and Fagotto (2014) state that the literature efforts focus on maximizing network and services availability , as well as providing a rapid reestablishment of the network in case of failures. A Fault Localizing Algorithm (AFA-FLA) was recommended in Mas and Thiran (2000) and Mas et al. (2005). In Sousa, Delfino, De Sousa and Everardo (2005), an algorithm for fault localization was presented, whose main advantage over other algorithms was the small amount of information needed to locate the faults. However, their proposed solution did not address the inherent business risks of the identified failures. They use the alarm domain as a conceptual basis for the development of the proposed model (Sousa et al., 2005).
Hommaand Shinomiya (2016) presented a failure recovery method, using ring structures called tie-sets and proposing an algorithm that searches for a group of tie sets that generate a shorter deviation path in the case of a link failure. The authors idealized tie-sets based on graph theory, dividing a mesh network into logical loops, managing faults with them.
Rodríguez-García, Ramírez-López and Travieso-Torres (2015) state that while, transport networks supported the increased load, routing generated much delay compared to switching, causing transport networks to evolve towards fiber optics. This technology, in turn, evolved into WDM (Wavelength Division Multiplexing) networks. The authors also presented the simulation of Snake One, a heuristic algorithm, and a comparison between three heuristic algorithms: Genetic Algorithms, Simulated Annealing, and Tabu Search, using blocking probability and network utilization as standard indicators.
According to Mas et al. (2011), optical networks need to use more fiber infrastructure and longer transmission distances with less operational effort. These networks also allow new opportunities, for example, new cuttings of access areas with larger sizes and fewer network locations. The design of an intelligent optical metro network was presented and compared to some traditional approaches in Fen et al. (2016).
According to Li-xia and Yue-Jin (2014), connection-oriented ethernet passive optical networks (EPONs) include fault management in their functional architecture, and the creation of a network of automatic protection mechanisms to test the function of simulation tests and the protection of their original programs. The application of this method can provide automatic and rapid protection to meet the requirements of the transmission network survival capability.
The work in Maltz et al. (2015) relates to the one herein because it shows a technology that considers network impact, and automatically mitigates datacenter failures, instead of relying on human intervention. Our proposed model (ASP - Asset Redundancy Points Locator algorithm) is similar to the one used by Oliveira, Brito and Brasileiro (2003) for working with a fault detector that has knowledge about which components may have failed. The work presented by Fabre, Benveniste, Haar, Jard and Aghasaryan (2004) relates to the one here, since it predicts failure situations in an optical link. They simulate the physical layer with transmitter, receiver and optic fiber.
Identification of redundancy points in optical networks
Downtime in a computer network can affect a company in many ways, generating primarily financial impacts. In order to estimate the cost that a network failure could generate for a company, it is necessary to obtain statistics that involve the actors of the process. These actors that use the network dependent services must be in relation to the occurrence of network failures and the current financial information.
Network downtime can also cause a loss in the company's reputation and customer loyalty. For example, the fact that a customer is waiting to make a payment in a commercially-held company, while their systems are stationary can cause loss of loyalty in the short term. The same situation in a new company may cause some customers not to return.
Any investment in redundancy should generate some return for the company. While investments with returns above capital cost increase the value of company; investments with lower returns than capital cost, will reduce it.
Model description
The following optical and optoelectronic devices ("elements") are considered in the proposed model. Optical fiber is a passive device that sends no type of alarm. Every time the Transmitter (TX) passes from one work regimen to another, an alarm is sent. For security reasons, if the transmitter starts to work in a not permitted regime, it is automatically turned off and an alarm is sent to management. The Receiver (RX) sends an alarm to the management control dashboard when the incoming optical power is below a specified value. Add/Drop Filters (ADF) are responsible for the insertion (derivation) of one wavelength in (from) a signal composed of several wavelengths. Each filter sends an alarm when it is not working properly. In the 3R Amplifier, an alarm is sent when it is not possible to recover the synchronism of the input signal. When the signal chosen as reference wavelength has not enough optical power, the Protection Switch (PS) will choose another input signal with acceptable optical power and an alarm is sent to control dashboard. When the Switch (SW) shows bad functioning, it sends an alarm to control dashboard. The Multiplexer/Demultiplexer is a passive device and sends no type of alarm.
On the one hand, the elements of the model that are not able to send alarms are named passive elements (P). On the other hand, during the occurrence of some abnormal functioning condition, elements that can send alarms are microprocessor-based and they are called alarming elements (A). Alarming elements are grouped herein into three categories: Self-Alarmed (Category A1 or A3), Out-Alarmed (Category A2) and Failure-Masking (Category A3) (Sousa et al., 2005).
Another model (and network) entity, is the node. A node utilizes an alternate wavelength and a physical association between two nodes that has two fibers, one for every communication direction. An information activity routed to a given node can achieve it through no less than two distinct paths and a protection switch will decide which of them will be used according to their optical power level. The nodes are classified as central or local. Each network element has a unique identification, in order to identify which network element is damaged and which node it belongs to when a fault occurs. This identification is composed of a string of four fields (A,B,C,D), which has a meaning for a local node (Sousa et al., 2005). In this paper, the notation (A,B,C,D) means network element (A B) between nodes C and D.
The connection between elements that can send an alarm or not is considered in the model. The ASP algorithm has the ability to find damaged passive elements, needing only the identification of the elements that are sending alarms. The employed correlation of alarms reduces the amount of suspect network elements. That amount varies with the number of channels that use the damaged element(s).
The proposed ASP model was automated in a software tool named ASP software, that can simulate optical network scenarios by using ASP model process. This is a useful tool to support decisions on incident management, related to fault management process. The ASP software was developed in a research project at the Federal University of Ceara, Brazil. Its advantages over traditional network simulators include the consistent analysis of the number of alarms generated by a failure, along with risk in business scenario simulations. It has been used in projects that seek the assessment of business scenarios for optical network providers. More than 700 scenario simulations were performed with the software. The disadvantage of ASP is that its scope is limited to redundancy points identification in optical networks. The ASP project is a work in progress in final phase, and its applications will be available to research community when it is totally finalized.
As shown in Figure 1, managers must perform the following steps to use the ASP model:
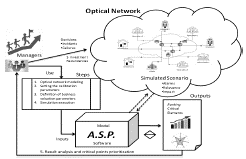
STEP 1 - Modeling the optical network topology in ASP. The information about the topology, channels and elements of the optical network scenario are informed through the ASP software input interface.
STEP 2 - Definition of business evaluation parameters in the model. The following parameters are reported as input to the proposed model:
Model Coverage Degree: for simulations execution, the model allows the selection of scope for risk calculation, where the impact estimation can be performed by network elements category or by each network element.
Business Impact of a network element: The Business Impact Analysis (B.I.A.) for network failures is a very complex process because there is a huge dependence on other services that are supported on the network service. The proposed model is simple and flexible, allowing the definition and use of several formulas (proposals) to calculate the business impact of a network element.
STEP 3 - Setting Model Calibration Parameters. The ASP model uses a consensus-based approach among managers to estimate the parameters for their use. The strategy is based on the Delphi method (Rowe and Wright, 1997), counting two rounds of evaluation, as well as on the use of questionnaires as a tool for collecting the information from the managers. The activity description of the two rounds of evaluation is done sequentially.
1. First round: managers estimate the following parameters, through specific questionnaires. For each answer, managers must present their motivation (justification).
For the optical network:
- Number of IT services that are dependent on the evaluated optical network (number).
- Manager's perception of the importance of high network
availability for the business.
• Very high (5) - High (4) - Medium (3) - Low (2) - Very low (1).
- Perception of the importance to the business of maintaining a high quality of services
• Very high (5) - High (4) - Medium (3) - Low (2) - Very low (1).
For each element category of the optical network (topology) or for each network element of the evaluated topology:
- Probability of failure - percentage (0 -100%)
- Relevance of the network element for the business
• Very high (5) - High (4) - Medium (3) - Low (2) - Very low (1).
- The empirical criteria to be considered by managers, when estimating relevance of a network element for the business are:
Number of IT services dependent on optical networks
Importance of the optical network availability for the business
Importance of the optical network service quality for the business
Importance of the network element importance in topology
Existing redundancies in topology.
The justifications of the answers may be based on empirical or statistical business data.
2. Second round: The results of the first round are presented, as well as a list of evaluators' answers and their justifications. In the choice phase, managers can change their answers if they are convinced by any of presented justifications. In this way, a consensus is sought among the group.
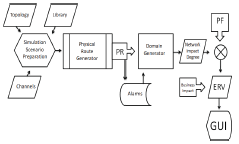
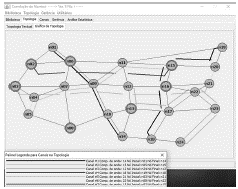
STEP 4 - Scenario simulation execution. The simulation environment is configured to generate the physical route domain of the library, topology, channels and alarms (input data). When executing ASP software (see Figure 2), in the physical route domain, all the network components that comprise any channel are numbered and associated with each of these components and their respective alarms. The next action is to check for alarms from components A1 and A3. The respective components are potential suspects if there are alarms and are then added to the list of suspect components. When checking the alarms coming from the A2 components of each channel, the algorithm takes only the first alarmed component of each channel, if any. This strategy eliminates redundant alarms. The channel is analyzed in reverse way, until it reaches the first transmitter, to consider the rest of the A2 components. This process must be performed on all channels. Next, a list of all the alarmed components A2 and the first transmitter is generated. The generated list is used to form sets, in order to check all the listed components one by one, making sure they are able to produce the alarms observed in the management function in case of failure. This is done by comparing the alarm domain of each component with the physical route domain. The components that passed the test form different sets.
When no component passes the test, it is performed again using component pairs, and so on. The formed sets are added to the suspect components list. Next, ASP model estimates the expected risk value (ERV) for all network elements that presented alarms in simulation. The risk estimate of a network element in the model is done through the formula: Expected Risk Value (ERV e ) = Probability of failure (P e ) X Impact (i e ).
The ASP model is effective in identifying the most critical elements of the optical network. Each network element that is considered a critical point in a management view, is related to a high-risk value. For ERVe calculation, one assumes the risk of an element (e) to be given by multiplying its probability of occurrence (P e ) with its impact degree (i e ) on business (equation 1).

Managers can choose different equations to estimate the network element impact (i e ), because the ASP model is flexible. For future work, the plan is to build a "library of possible equations" to estimate network element impact. In this paper, the focus was to simplify the impact estimative, to illustrate the model use and collect possible evidence that it works and is useful. Business relevance is estimated by managers for each optical network element using a consensus-based approach, based on Delphi method (Rowe and Wright, 1997). The network element impact is estimated (as shown in equation 2) by the total number of the element alarms (Ag e ) multiplied by its business relevance (Re- a relative weight or percentage), divided into the sum of all the generated alarms multiplied by their respective relevance (weights):
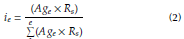
where:
ie - Impact of element e in the network
Age - Number of alarms generated when element e fails
Re - Relevance of the element for the business (Very High -5; High - 4; Medium - 3; Low - 2; Very Low - 1 )
To reduce analysis efforts by model users, business relevance of an optical network element in the ASP model may be aggregately defined for a category of elements (e.g. switches) or for each network element node, according to its location in the optical network topology. In this work, Alpha company managers decided to estimate the business relevance in the simulated scenarios by network element category. Note that equation 2 implicitly assumes that the impact of an element (or its category) is directly proportional to the number of alarms it may generate and its business relevance. In situations where this may be a rather simplistic or unrealistic assumption, users (managers) may compensate the result by pondering R e more carefully.
Model results can be used i) to support decision-making (Sergio, De Souza and Goncalves, 2017) in proactive user information, ii) to reduce the number of inquiries by users and distribute information about optical network critical points (as incident management reports), iii) to supply possible incident-related information to other service management processes, and iv) to ensure that improvement potentials are derived from possible incidents.
Case study and result analysis
Case study
We proceeded to a case study (Yin, 2018), for analysis and validation of the proposed model, with the simulation of two reference networks. Simulation planning and results were presented, discussed and analyzed in a face validity exercise (Runerson and Host, 2009), by service and network managers of a real Brazilian telecommunications company -herein identified as the Alpha company.
ASP software tool was used with the focus on incident management related activities (fault management), to support decision on which network points need interventions -including the creation of redundancy measures.
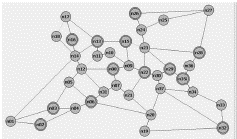
The first scenario considers a USnation-type network (Figure 3). Its composition includes 24 nodes (n07 - n24), where 17 of them are local and the other 7 are central nodes. There are 43 links and 133 network elements.
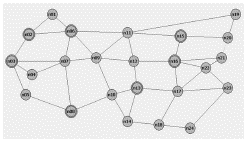
As shown in Figure 3, the channels pass through 17 local nodes, 7 central nodes and 28 links.
The USnation network has the following parameters: 28 fibers, which generate 96 alarms; 7 LAP, which do not generate alarms; 7 de multiplexers, which generate 24 alarms; 7 multiplexers, which generate 27 alarms; 19 Add Drop Filters, which generate 103 alarms; 13 transmitters, which generate 52 alarms; 13 receivers, which generate 18 alarms; 7 switches, which generate 7 alarms; 13 Protection Switches, which generate 16 alarms and 13 3R amplifiers, which generate 5 alarms. There is a total of 127 used network components and 348 generated alarms. The values of the estimated failure probabilities for the network elements in the case study are shown in Figure 4. In ASP model, the probability of failure of each element is estimated by managers. As previously shown, these values are used in the model to estimate the network elements risks, in relation to their business impacts. In case of variations of these probabilities or due to different impacts to the business on different network channels, the risk values of the

ASP software generates statistical validation data for each simulation. Results of the USnation scenario statistical validation are presented in Figure 5.

Managers can verify assertiveness and consistency of the performed simulation, through evaluation of standard deviation, mean, mode, median, minimum value and maximum value.
The second simulation scenario considers a network of type ER_NET (Figure 6). Its composition includes 37 nodes, where 24 of them are local and the other 13 are central nodes. There are 65 links and 128 network elements. The channels pass through 24 local nodes, 13 central nodes, and 65 links.
The network topologies in Figures 4, 5, 6 and 7 are formed by local and central nodes. The local nodes are composed of ADF, RX, TX, PS, SW, 3R and LAP, while the central nodes are composed of MUX, DEMUX, RX, TX, PS, SW, 3Rand LAP. The nodes are interconnected by the optical fibers. The channels determine the active elements that will be analyzed.
Results and discussion
First Simulation Scenario
We proceeded to the US Nation scenario simulation using the ASP software tool (Figure 7).
ASP model generates a risk ranking table that includes all the optical network elements in scenario. Table 1 shows the risks of the first 24 network elements. Figure 8 shows USnation network elements risk zone. A Multiplexer is the element with the highest estimated risk. Managers can analyze risk intervals and proceed to a drill-down analysis, using this useful information to decide on redundancy points choice. Alpha managers affirm that this support improves the quality of decision-making quality. Results of the ASP model simulation for US Nation network indicated that Regenerator 3R (3R amplifiers) were the elements with the lowest risk values.
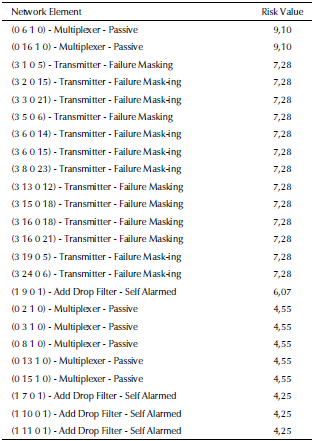
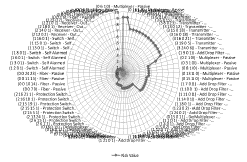
Table 1 shows the risk ranking generated by the ASP model. The ERVs estimated by the ASP model are influenced by network topology, channels and business impact. It can be observed that the risk related to Multiplexers, Transmitters and Add Drop Filters are in different ranking positions, due to possible differences in topology position, channels and business relevance.
In Figure 9, ERV for each network element was estimated in a risk zone between 4,5 and 9,1. The Multiplexer located in topology notation (0 6 1 0) has the highest risk value and probably will receive redundancy. All the priority levels of the elements are shown and the decision on redundancy is supported by the ASP model.

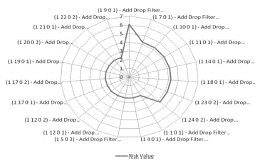
Figure 10 shows the risk related to ADF network element category in USnation scenario. Simulation results indicated that ASP model identified ADFs with different risk values in the network topology. Managers can evaluate topology, channels and nodes distribution to identify possible alarms sources, that could have influenced each element risk estimative. Observation of ADF risk zone (interval between 2,4 and 6) can show 11 ADFs with risk value 2,4 and 8 ADFs with a higher risk value. Managers can analyze this information and ADF nodes location to support decision-making process. Other useful information that can be generated by the ASP model for managers is the risk value related to each element category, as a complementary support for decision-making.
Second Simulation Scenario
In ER_NET scenario, the ERV for each network element was estimated in a risk zone between 0,5 and 10,2 (Figure 11). The Multiplexer located in topology notation (0 22 1 0) has the highest risk value and is likely to receive redundancy. All the priority levels of the element are shown, and redundancy decision is supported by the ASP model. The network elements with the lowest identified risk belong to Regenerators and Receivers categories. At any time, managers can access the complete ranking list if they need to evaluate each element location, for possible decision making.
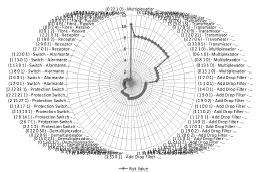
Table 2 shows the first 24 elements in risk ranking. As previously stated, ERVs for network elements are estimated by the ASP model, influenced by network topology, channels and business impact. The risk related to Multiplexers, Transmitters and ADFs is distributed in different positions of the ranking, probably due to differences in their location in topology, number of channels that pass through it, and their degree of business relevance.
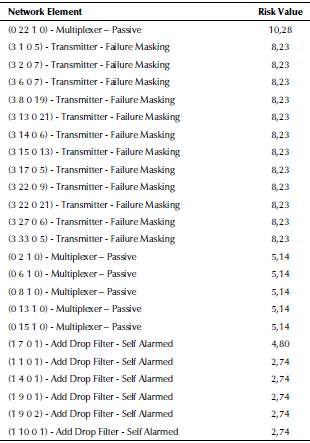
Multiplexer of node 22 has the highest risk value in relation to other multiplexers in the topology, due to the greater number of channels passing through it, which can concatenate a larger alarms number, in case of failure (Figure 12).

Conclusion and future work
This paper presented a model to assist managers in the process of identifying critical points in optical networks.
This model is different from competing models, because managers can use a business view to identify optical networks redundancy points. It aims to aid in the decision-making process in fault management activities, considering the risk impact. It is not intrusive and can be used in addition to incident management and fault management supporting tools. The contribution of this work lies in the model itself, which can mitigate risks in optical network incident management, facilitating the managers' work in fault management activities.
Based on the outputs generated by the model, managers obtain a risk ranking, where they can quickly and assertively identify the critical points that can be applied to establish redundancy in an optical network.
Results of the case study indicated that the identification of critical points, in an optical network from a risk perspective, allows managers to define more effective redundancy points in the network, as well as to justify the adoption of actions that can mitigate risks, thus contributing to a more effective service management process.
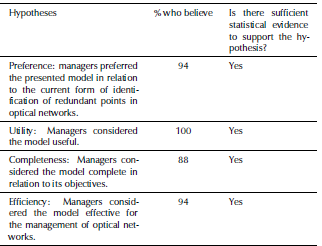
A face validity exercise (Runerson and Host, 2009) was conducted and results indicated that the model is useful, preferable, complete and effective. In order to elicit managers' opinions about ASP model and the associated tool, the model usage was evaluated by 6 network managers and 11 IT managers, who were asked to answer a questionnaire. The model was presented to them, as well as the results of the simulations. Four hypotheses regarding the utility, preference, completeness and efficiency of the proposed model were analyzed. Additional insights were gathered, through talks with managers. The negative hypotheses were refuted in a face validity exercise (Runerson and Host, 2009). A binomial statistical test (Casella and Berger, 2002) with 5% significance was used to produce the results shown in Table 3. We can claim face validity of the model. However, full validation is an activity that requires many years and several repetitions.
As a threat to validity, the single case study and the short periods of observation imply deficiency in statistical significance of conclusions. On the other hand, the hypotheses that were tested used data from 17 managers and were reported with a 95% confidence level and the scenarios simulations were statistically validated by ASP software. There is no threat here. There is always doubt that inputs metrics are well understood by the managers (in relation to construct validity) and this subjectivity leads to a threat: one may not be obtaining the outputs that match reality.
As a future work, we intend to customize the proposed model to simulate next generation optical networks and their business scenarios, with the use of financial values in the estimation of impact and proceed a comparative study with this work results. To consider sensitivity of results on business impact estimative is another research thread.


