


 English (pdf)
 Article in xml format
 Article references
 Send this article by e-mail
 Cited by SciELO
  Cited by Google
  Similars in
SciELO
Similars in
SciELO  Similars in Google
 Permalink
Introduction
Subnutrition is a growing problem. In 2018, 5,5% of the total Latin American population suffered hunger. The problem is critical, especially in children, where official data report that 4 million children under five years old are in underweight, 700000 are in acute malnutrition, and 4'8 million suffer chronic malnutrition (FAO et al., 2019)
Given this situation, some Latin American countries such as Argentina, Chile, Ecuador, Peru, Colombia, Venezuela, Costa Rica, Cuba, Mexico, Nicaragua, Dominican Republic, El Salvador, Guatemala, Haiti, Panama and Honduras have created strategies to guarantee an adequate access to nutrition for the most vulnerable populations (UNICEF, 2006), through the production and distribution of products of high nutritional value.
One of the strategies to fight malnutrition is the continuous supply of food to the vulnerable population. That approach delivers food or complementary feeding to enhance the ingest of high nutritional value nourishment (Lopez-Arana et al., 2016). Other strategies are the direct cash transfers to the target population or the indirect cash transfers for alleviating the cost of the food and increasing the variety of consumer products (De Groot et al., 2017).
Continuous supply strategy differs from direct or indirect cash transfers in the logistical efforts to procure, produce, and distribute the food. Those efforts involve a supply chain that connects the product supply with the demand in the target population.
Some examples in Latin American countries are the LICONSA program to distribute low-cost fortified milk in low-income families (Talamantes, 2016), the National Program of Complementary Food in Chile for children under six years old and nursing mothers (Ministerio de Salud de Chile, 2011) and the axis for food access of the Zero Hunger politics in Brazil (Paes-Sousa and Vaitsman, 2014).
In Colombia, the Instituto Colombiano de Bienestar Familiar (ICBF) focuses on the prevention and comprehensive protection of early childhood, childhood, adolescence, and the well-being of families. One of the institutional objectives of the institute is to promote food and nutritional security (Instituto Colombiano de Bienestar Familiar, 2016). Therefore, the institution has implemented programs related to the production and distribution of foods of high nutritional value. The leader program on this axis is called Bienestarina.
Bienestarina is a nationwide program financed with public resources for producing and delivering nutritional supplements for children, adolescents, pregnant women, lactating mothers, the elderly, and families that are considered vulnerable or in malnutrition risk. The Bienestarina program started in 1976 and has a national scope with an annual budget close to 40 million dollars (Departamento Nacional de Planeación [DNP], 2015). The main product of the program is a powder composed of mixed cereals, milk, vitamins, and essential fatty acids (ICBF, 2019).
As technical system, the Bienestarina program has a six echelon supply chain (Figure 1) composed of: 15 suppliers, 2 production plants located in the departments of Valle del Cauca and Atlántico, 21 regional warehouses, approximately 5 000 distribution points (DP) located in 1 056 municipalities and 170 000 executing units that benefit approximately 4'500000 people (ICBF, 2014).
Source: Authors using 2015 ICBF data (DNP, 2014).
Figure 1 Scheme of the Bienestarina distribution chainEDA acquisition circuit.
According to primary data of the system, the freight flow for the year 2015 was approximately 18 000 tonnes (DNP, 2015). From 2016 to 2019, the public policy planned to maintain a production of 22 000 tons (DNP, 2015).
The Bienestarina system is a non-profit supply chain with characteristics of a business supply chains and also of humanitarian supply chains.
From the point of view of the business supply chain, the Bienestarina system has low variability in the aggregated demand data, stability in the facility network, transport connections, and other support systems, as well as a decisionmaking structure controlled by a small number of actors.
However, the Bienestarina supply chain has different objectives from a business supply chain. The system is not seeking economic profits, it looks for increasing the social welfare of a population living with food insecurity instead. This means that the system cannot limit the level of service or restrict the coverage areas with profit purposes. Hence, the objectives of the Bienestarina supply chain match better with humanitarian supply chains.
Despite the social purposes, in the Bienestarina Supply chain, the decision-making structure and the facility network are not under stress as in a post-disaster humanitarian context. Hence the analyzed supply chain is in a midpoint between a humanitarian objective and a distribution network operation closer to the business context. According to Holguin-Veras et al. (2012), those features match regular humanitarian logistics or slow-onset disaster supply chain. In other words, the supply chain design and configuration should be analyzed from a regular humanitarian logistics or slow-onset disaster point of view, but this does not mean that malnutrition or sub nutrition problem is a slow-onset disaster itself.
The slow-onset disaster supply chains look for the recovery of society after disasters (Noori and Weber, 2016), famine relief, aid within refugee camps, political crisis, or the regional development of a country (Cozzolino, 2012; Gustavsson, 2003; Kovács and Spens, 2007).
Therefore, the strategic configuration of the Bienestarina supply chain should be addressed mainly to reduce the unmet food aid demand, but also to enhance the system efficiency, cutting the logistic cost. At the same time, lower logistic cost means more resources available to increase the system coverage.
Thus, the mathematical programming efforts addressed to improve the supply chain configuration take relevance, especially in the context of a system like Bienestarina, which has been built since 1976 by adding facilities or delivery points to the network without evidence of overall optimizing. This research presents an evaluation of the facility location in the Bienestarina System. The evaluation is made using real data and tested though a mixed-integer linear programming model.
In the next sections, a general description of the background in a strategic supply chain facility location is presented. Next, a mathematical model for facility location is described. Then, a comparison between the current system and the optimal structure is made. Finally, conclusions and future work are proposed.
Facility Location for the Bienestarina context
Facility Location has been a top research topic in the scientific literature for operations research and supply chain management. The decisions to locate and allocate facilities are a strategic challenge for public and private organizations (Accorsi et al., 2016; Owen and Daskin, 1998) with an impact on the long term performance of a supply chain.
The Bienestarina case is not an exception. Moving annually more than 18 000 tonnes between factory plants and delivery points with national scope, every improvement in facility location could impact directly on the system capacity to cover the vulnerable population. As explained before, the system has built the current network throughout more than 40 years of continuous work and adding facilities in an ad-hoc way. Without evidence of an optimization of the network design, comparisons between the current network design and new alternatives based on mathematical models for optimal facility location take relevance.
Despite the system scope and the program relevance to fighting malnutrition, just a few studies exist around the Bienestarina program. For example, studies like the one by Avila (2017) and Rivera and Restrepo (2015) find relations between the nutritional situation and the geographical location of facilities for specific regions in Colombia, but not for the whole country.
For this reason, the mathematical model approach for facility location evaluation in the current system should gather elements from different models and references in the literature. The set of elements is divided here into three main issues: (i) Objectives (ii) network structure and (iii) real case evaluation.
(i) Objectives
In the literature about supply chains, the most common objectives have been the minimization of costs (Bortolini et al., 2016; Colicchia et al., 2016; Rancourt et al., 2015; Paul and Wang, 2015). Nevertheless, this objective is not the priority in a system with social or humanitarian purposes like Bienestarina.
In the humanitarian context, there are objectives like the minimization of deprivation cost (Holguin-Veras et al., 2013) or the maximizing of equity (Ferrer et al., 2018; Huang and Rafiei, 2019). However, those objectives are more proper for emergency contexts, like post-disaster situations.
A system like Bienestarina requires high priority to the social purpose in the demand coverage, but also the second priority is reducing the total freight flows (as a representation of transportation cost). In this sense, a more suitable objective could be maximizing demand fulfillment (Marianov and Serra, 2001) and, with less priority, the minimization of weighted distances between demand and supply sources (Dessouky et al., 2013) (Hall et al., 2013; Sahin et al., 2007).
(ii) Network structure
Besides the objectives pursued in a non-profit supply chain like Bienestarina, there is also the network configuration. The Bienestarina extended network has six echelons: suppliers, factories, regional warehouses, delivery points, executing units, and beneficiaries. The direct supply chain encompasses the two factories, the 21 regional warehouses, and around 5 000 delivery points. In order to evaluate the current supply chain, a mathematical model should check the regional warehouse location. Those warehouses could change their current location more easily than production plants. The third element in the supply chain (delivery points) as a representation of the system demand is not subject to location changes.
The warehouse location requirement is coherent with previous studies in the literature. For instance, in business logistics research, the mathematical models fare common or allocating or selecting warehouses from a set of alternatives (Adivar et al., 2011; Owen and Daskin, 1998). In a humanitarian logistics context, the problem is similar, but the facilities activated are pre-positioned facilities for relief storage and response instead of warehouses (Balcik and Beamon, 2008; Li et al., 2014; Trivedi and Singh, 2018; Singh, 2016; Ukkusuri and Yushimito, 2005).
Additionally, a mathematical model for Bienestarina warehouse evaluation should involve the freight flows allocation between the three echelons in the supply chain. Such characteristic is also common in a facility location and distribution problem, and some examples could be consulted in the studies by Jaimes et al. (2011), Camacho-Vallejo et al. (2014)), and Chaabane and Geramianfar (2015).
Another point for analysis is the distance or time parameters used for building the model. Classical formulations use Euclidian or Manhattan distances. However, in many cases, the Colombian geographic conditions avoid straight crossing for product transportation. Usually, the truck roads cross through mountains, and also rural roads are not always are in good condition. Those conditions suggest using more accurate distance measures than Euclidean or Manhattan distances.
In the last years, real-time or distances are collected using GIS Data with tools like Google Maps®, which can improve the parameter estimation against standard Euclidean distance calculation. Some examples are the studies conducted by Oleshchenko et al. (2019) and Sabarish et al. (2018). Nevertheless, in these tools like Google Maps®, the distance estimation is not available for all towns or municipalities. Due to this fact, it is necessary to take an alternative way for distance estimation. In the model presented in the next section, the distance is calculated using Google Maps® between plants and main urban centers. For the main urban centers and the location with no distance register in Google Maps®, Manhattan distances were used. This approach allows enhancing the model parameters more accurately.
(iii) Real Case Evaluation
The use of real cases in facility location problems is usual in regular humanitarian logistics literature. Some research on slow-onset disasters has develop research around a strategic facility location for improving the food aid distribution in Kenya (M. E. Rancourt et al., 2015). The research considers the welfare of all stakeholders for allocating distribution centers using GIS information. GIS data is also used as a parameter estimation tool in a facility location model for a new United Nations Humanitarian Response Depot (UNHRD) in Kampala, Uganda (Dufour et al., 2018), for silos as a strategy for national food security in India (Mogale et al., 2018) and for providing water to the refugee camp in Syria (Smadi et al., 2018).
Nevertheless, most of the research defines network planning and the warehouses from scratch and make no comparisons with the current network structure. Only the work by Dufour et al. (2018) made a cost and operational evaluation of introducing a new warehouse in the current system. This fact is not completely useful since most of the food assistance supply chains (like Bienestarina) have been operative already for many years, thus comparisons between current structures and new proposals based on mathematical methods may offer significant conclusions about the supply chain performance.
In summary, the efforts to compare and evaluate the facility location in food assistance programs like Bienestarina are scarce, even in systems with similar characteristics like regular humanitarian logistics. Hence the model presented in the next section gathers elements from the different references cited here to adapt the objectives, the network structure, and obtain real parameter estimation.
The model results can be used for decision making in the supply chain design of the Bienestarina case, but also the modeling process is useful for other food assistance programs. Finally, the research presented is also useful to remark the importance of supply chain design in the performance of social assistance programs.
In the next section, the mathematical formulation for the Bienestarina case is presented and then the comparisons with the current supply chain configuration.
Location and allocation model: Bienestarina case
A mixed-integer programming model was used to address the problem of optimal localization of intermediate facilities (regional warehouses) in the Bienestarina supply chain configuration. The model results give a selection of regional warehouses to be maintained or installed within the system configuration, and the allocation of the DP that will be served by each regional warehouse enabled, or directly by a flow sent from either of the two production plants.
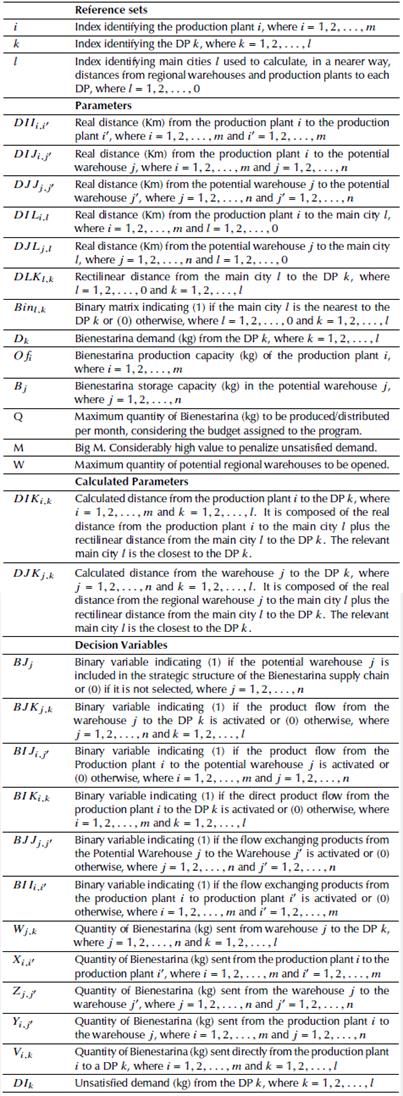
Table 1 shows the indexes, parameters, and variables of the model for the evaluation of the location of intermediate infrastructure, aiming to minimize the weighted distances.
A linear model of mixed-integer programming
The mathematical formulation of the proposed model is detailed in the following equations:
subject to:
Equation (1) shows the objective function, expressed linearly. The objective function combines three purposes: (i) to minimize the unmet demand, (ii) to minimize the total weighted distance, and (iii) to reduce the number of activated warehouses and the flows between production plants or between warehouses, as unnecessary flows.
The objective function prioritizes the unmet demand minimization using a Big m as a prioritization value. Next, as a second objective, the model used the minimization of the total weighted demand. The distance expressed in kg*km works as a prioritization value itself: significantly less than the Big m, but significantly higher than the sum of binary variables, which represent unnecessary flows. The weighted distances are used here as a measure of the transportation effort to reach the demand, such as an indirect measure of the transportation cost, whose data were not available in this research. The lack of cost data avoids further model adaptations to represent the nature of transportation costs. Nevertheless, the causal relation between traveled distance and transportation costs may allow the cost reduction with the weighted distance minimization.
The first two parts in the objective function (total distances and unmet demand) aims to cover the real context of a long-term humanitarian food supply chain. This minimizes the transportation distances as an efficiency measure and the impact over population nutrition status through an efficacy measure. The third term adapts the model to the real data, which reports some flows between production plants and between warehouses.
Equation (1) also requires the distance parameter calculation, whose importance was explained in the previous section. The proposed model includes two kinds of distance parameters: real transport distances gathered from Google Maps® (DIL i,l DJL j,l ), and estimated distances using Manhattan distances (DLK l,k , DLK l,k ). Far distances are used in cases where real transport distances are not available, which is usual in small distant territories from main cities. The demand calculation is exposed in Equations (19) and (20).
Equation (2) ensures that the quantity of Bienestarina, in kilograms, sent from the production plant i does not exceed the sum of the monthly production plus the supplies received from the production plant i '.
Equation (3) guarantees that warehouse j only send product if the binary variable for its activation assumes the value 1. It also ensures that the quantity of products sent does not exceed the capacity of the warehouse. The input flow from warehouse j' is not included to avoid oversizing the storage capacity of the warehouse.
Equation (4) includes the notion of indivisible demand for the DP k, ensuring that all its demand is supplied either by a single warehouse or by a single production plant.
Constraint (5) is included to enable the possibility of activating direct flows from plant i to point k, provided that there is no warehouse closer to the respective DP.
Equation (6) represents an additional constraint on the production capacity of the plants. It constitutes an upper limit of Bienestarina (Kg) that can be produced and distributed per month considering the budget assigned to the program.
With restriction (7), the unsatisfied demand of each DP k is calculated as the difference between the demand of the DP and what it receives from a warehouse j or plant i.
The equilibrium between the inflows and outflows of warehouse j is guaranteed by equation (8).
With the logical constraint (9), non-coherent delivery of the product among the same warehouse is avoided.
With constraint (10) it is guaranteed that no flow from warehouse j is activated if the warehouse is not included in the strategic configuration of the Bienestarina supply chain.
Constraints (11) to (15) are included to assign the value of one (1) to the binary variables of flows between points, whenever products are sent between these points.
The maximum number of warehouses to be opened is guaranteed with constraint (16).
The non-negativity of the flow variables (Bienestarina sent between points), as well as the unsatisfied demand variable of DP k, is shown in equation (17). Finally, equation (18) refers to the binary nature of the variables of activation of flows and opening of warehouses.
Results
This section compares the current Bienestarina system structure with the optimal structure suggested by the mathematical model proposed in the previous section.
The model parameters used the real location of production plants, warehouses, and DPs. Figure 2 shows the current facility location in a map of Colombia that describes the scope of the national program. White spaces show zones without delivery points and correspond to less populated zones. The warehouses are located in the center and north parts of the country. The production plant indexes are related in Table 2.
Source: Authors
Figure 2 Map of Colombia with the location of the regional warehouses in relevant months of 2015.
Data used for facility location and real deliveries correspond to the 2015 ICBF reports (ICBF, 2017). In that year, the system produced and distributed around 18 000 tonnes of Bienestarina. The distributed quantity not necessarily matches the nutrition demand in the country. Thus, five demand scenarios were built taking as reference the 2016 total population under malnutrition conditions in 1 113 Colombian municipalities. These data were estimated using the official 2016 total population report made by the Departamento Administrativo Nacional de Estadística (DANE) and the last malnutrition report published by the Colombian Ministry of Health with 2010 data.
The five scenarios are defined as follows:
The current system using 2015 real deliveries data and 1 056 municipalities with real delivery points.
Malnutrition population between 0 to 4 years old in 1 113 Colombian municipalities.
Malnutrition population between 0 to 19 years old in 1 113 Colombian municipalities.
Total population between 0 to 4 years old in 1 113 Colombian municipalities
Total population between 0 to 19 years old in 1 113 Colombian municipalities
These population ranges are chosen for representing the main population groups in the current system, where around 60% of total deliveries are sent to 0-4 years old children, and 80% to people under 20 years old. In order to determine the supply chain structure, scenarios B, C, D, and E are compared with the current system structure.
The purpose is to determine the system capacity to respond to the demand scenarios. Also, to test the current facility location, the model has the possibility to allocate warehouses in the current positions or in other new alternatives. The set of potential warehouses was composed of 59 alternatives (21 current warehouses, 2 production plants, and 36 of the main cities or municipalities in Colombia).
Therefore, the comparison measures show how many of the current warehouses locations remain in an optimal solution, how many of the freight flow allocations match with the optimal location, and the percentage of the total demand covered in each scenario.
The proposed mathematical model was solved using the General Algebraic Modeling System - GAMS 23,7 optimization software (2019) and the CPLEX solver, in a computer with Intel Core i7 processor, 1 terabit hard drive and 16 gigabit RAM.
Scenario A. Real deliveries data
The real deliveries data were gathered from the 2015 delivery reports (ICBF, 2017). As we mentioned above, in the current structure the system has activated 2 production plants and 21 warehouses, where the production plants serve also as a warehouse.
In order to evaluate the robustness of the warehouse location against deliveries variability, the location model was solved for the months with minimum and maximum demand (Figure 2).
The optimal location of warehouses enabled for each month is represented in Figure 2 in two ways: like black circles without filling, if the selected location is a current warehouse, or like purple triangles, if the selected location corresponds to potential warehouses. The orange circles sections represent the DPs to be assigned. Figure 2 also shows that only 11 of the current warehouse locations are selected in the optimal solution, which means a matching percentage of 52%.
In favor of proving the robustness of the optimal warehouse location, the model was run for every month in the analyzed year. The analysis aims to evaluate the changes in the optimal facility location when facing demand changes.
In Figure 3, the map shows the facility location according to the activation percentage, which considers the number of times that each potential warehouse appeared in the solutions of each model run (relevant months).
Source: Authors
Figure 3 Map of Colombia summarizing the regional warehouses activated in 2015. Scenario 1. The icons with black border are current warehouses, while those with a white border are potential warehouses.
Green dots represent the warehouses present in all the runs, which means the set of facilities that remains invariant when facing any demand change. The warehouses marked with a red X are discardable facilities because of their lack of appearance in every solution.
The analysis for scenario A finishes with the comparison between the current structure and the optimal solutions. The current system performance was calculated through the insertion of the current warehouse and freight flows in the objective function (row "Current" in Table 3). Those results are compared with the model runs in the same three demand calculations as in Figure 2 (minimal demand, maximal demand, and average demand). The comparative results are shown in Table 3.
Table 3 Comparative analysis: Current vs. Proposed configuration -Real demand data, 2015
(1) % weighted distances/total OF value, (2) Unsatisfied demand and (3) Binary variables activated.
Source: Authors
The row called "Potential" presents the objective function value for the three demand calculations. The comparison process demonstrates the potential reduction of freight flows in optimal solutions. For instance, for the month with maximum demand (July), the total reduction is calculated in 17,33%. The solution also evidences the fulfillment of system purposes. Table 3 shows in any run that the model does not allow unmet demand. Hence, for the three demand calculation, the total contribution of the weighted distance component is more than 99% (Row (1)).
The exposed comparison shows an important gap to be improved, in terms of weighted distance (km*kg). Indeed, if the results are put in a cost context, where the percentage is shown, it would mean a significant reduction in the global logistics cost of the Bienestarina Supply Chain.
This section evaluated facilities location with the real deliveries data; however, it could have differences with other demand scenarios. For this reason, scenarios B to E are proposed. Those scenarios are built for covering nutrition in a staggered manner, first focusing on underage population with malnutrition and then in all underage population.
Comparison of scenarios B to E
The demand parameters used for supply chain configuration modeling were estimated from demographic information registered in the DANE and the malnutrition percentages registered by the Ministry of Health and Social Protection of Colombia.
According to the model presented in a previous section, Table 4 registers a comparison between the current supply chain configuration and the scenarios B to E in terms of objective function value, unsatisfied demand, and number of allocated warehouses.
Results in Table 4 show the performance of the current supply chain configuration in the four scenarios. With 23 active warehouses (2 warehouses in the factories and 21 distributed along the country), the current structure can cover the entire demand for people under 19 years old with malnutrition conditions - scenarios B and C.
Nevertheless, the proposed structure indicates that the system could cover the estimated demand in scenarios B and C with potential warehouses and improve the freight allocation, with a lower weighted distance. Results also demonstrate the need to change the current warehouses location. Indeed, in scenario B, the system could operate with 21 warehouses, where 8 of the current operative warehouses remain (38,09%). In scenario C, the remaining operative warehouses percentage is 38,09% too. Additionally, in both cases, the weighted total distance in the objective function decreased. Thus, an increase in transport efficacy could be expected.
In scenarios D and E, the modeled demand increases to cover the whole population between the indicated age rank. The comparison between the current system configuration and the proposed structure in scenarios C and D presented the same uncovered demand. This fact means a restricted freight flow by the system production capacity and, notably, by the budget constraint of the Bienestarina Program. At first glance, it seems that the variation in the value of the objective function in scenarios D and E is not very high. However, by eliminating the effect of the uncovered demand on the objective function (same value for results with the current and the proposed configuration), the proposal structures in scenarios D and E also reduce significantly the weighted total distance compared with the current system configuration, even increasing the number of warehouses.
As in scenarios B and C, the model suggests a modification on the warehouses location, remaining the 42,86% of the current operative warehouses in scenario D, and the 23,81% in scenario E.
Figure 4 depicts the proposal of warehouse location in all scenarios. The solutions in all scenarios illustrate that warehouses are moved to crowded areas, prioritizing the distribution of major freight quantities without reducing covered demand.
Source: Authors
Figure 4 Map of Colombia summarizing the regional warehouses activated in Scenarios B to E: Proposed configuration.
Finally, the objective function values imply fewer logistics costs and, therefore, more public resources available to invest in production capacity.
Sensitivity analysis. Between humanitarian and commercial purposes
Sensitivity analysis was performed to test the importance of the two primary purposes in the objective function (Equation 1): (i) to minimize the unmet demand and (ii) to minimize the total weighted distance. The first purpose is a typical humanitarian objective and the second purpose is closer to commercial logistics purposes. In the previous section, the objectives were weighted in order to prioritize the humanitarian purpose over the weighed distance minimization (as a representation of the transportation cost).
The humanitarian objective was prioritized by the BigM, using a value of 3'600000. The results using this value show a complete demand covering, which is entirely coherent with humanitarian purposes.
In this section, the sensitivity analysis aims to describe the impact in the system structure when the weights in the objective function are changed. Using scenario A in the month with minimum demand, the weight of the Big M took three values: 3'600000, prioritizing the humanitarian objective; 388 505, to give similar weights to the unmet minimization and the distance minimization; and equal to cero (0), to nullify the unmet demand minimization. Table 5 depicts the sensitivity analysis results.
Table 5 Sensitivity analysis results
(1) Weighted distances/total OF value (%), (2) Big M * Unmet Demand, (3) Binary variables activated.
M(1), slightly higher than the highest value of the distance between production plants/warehouses and DPs; M(2), average distance of activated paths between production plants, warehouses, and DPs, under the current scenario; M(3), null penalty of unmet demand.
Source: Authors
The results show the impact in the system design when the system purposes are changed. In the original Big M value (3'600 000), the humanitarian objective rules the system, the unmet demand is cero, and the number of transportation flows is maximum. With the second Big M value (388 505), the humanitarian and the distance minimization took similar weights, hence the model reduces the freight flows number giving priority to the crowded zones and canceling the flows in rural or remote areas. Besides, the unmet demand increases to 32,14%. Such results describe the change in the system design; the weight of the humanitarian purpose decrease, giving more importance to the classic commercial purposes, which means cutting the longest distance freight flows and the reduction of the service levels in remote areas.
Finally, in the third Big M value, the unmet demand effect is canceled, and the model also eliminates all the freight flows. The results are logic because the absence of freight flows removes all traveled distance, and the objective function got the minimum value.
Conclusions
Bienestarina supply chain is an example of humanitarian food assistance programs and, in a broader way, humanitarian, social assistance programs. This kind of system represents a unique type of supply chain, which does not match entirely with business supply chains or humanitarian supply chains. From the business supply chain, humanitarian social assistance systems take the efficiency orientation, and from the humanitarian supply chain, they takes the purpose of minimizing human suffering. As unique features, this program has the financing structure, sponsored by a government program; the national scope with a high last-mile access level; and the heterogeneous population as it requires simultaneously distribution in rural, urban, and ethnic territories.
Despite the vast scientific literature on facility location, the evidence of research around slow-onset disasters as malnutrition problems are just a few and also the comparisons between optimal and current supply chain configurations. This research presented a comparison between the optimal structure and the current structure of a humanitarian food assistance program with national scope and a large number of warehouses and delivery points.
With comparison purposes, a mixed-integer programming model was designed for locating the system warehouses and allocating the system freight flows. The model aims to capture food assistance purposes. In this way, the model seeks to assure efficiency in the deliveries via total distance minimization and the food aid covering via unmet demand minimization.
Additionally, the model was adapted to gather a better estimation of real distance parameters using the available Google-Maps® distance and Manhattan distances where Google-Maps® was not available.
The research found a low matching percentage between the current system configuration and the optimal proposal. This fact implies more money in logistics cost and less in food assistance, especially for a program like Bienestarina, whose unique public budget should cover production and logistic cost.
For instance, in scenario A, only 52% of the current facilities are in the optimal solution and a potential reduction in 17,33% in the freight flows could be achieved. Results also show the system capacity to cover the demand in all the malnutrition scenarios (A, B, C) and also, enough capacity to cover all children under four years. (Scenario D).
The facility location model was designed to prioritize the humanitarian objectives through the minimization of the unmet demand and also using the minimization of the weighted distances as secondary purpose. The sensitivity analysis shows changes in the results when the model modifies the priorities to give similar weights to humanitarian and commercial purposes. In that case, the model allows unmet demand and cut freight flows leaving unattended rural and remote areas, but also reducing the total traveled distance. This means that in a system led by business purposes, the model reduces the transport cost but sacrifices the demand covering.
These results generate some public policy implications. First, although the program has been incresing its scope and coverage, the growing of the facility network requires optimal planning to achieve the humanitarian objectives and also reduce the transportation cost. Second, the results presented could be used as an input in public tenders for logistics service providers.
With respect to demand calculation, this research had to build a set of scenarios to estimate the number of beneficiaries. That procedure was forced by the absence of data on public demand estimation. The lack of real demand data indicates the incapability of the current system to recognize the target population and, thus, its impacts over nutrition indicators in the country. This weakness could be partially solved through the design of tracking and traceability systems (Rueda-Velasco et al., 2019).
Future work could include the design of supply chain configuration models that minimize deprivation cost (Holguln-Veras et al., 2013), though firstly the deprivation cost for food assistance in Colombia should be calculated. Future studies could also analyze tactical and operative problems like vehicle routing, including time windows, to represent the labor hours in the distribution points.
Supply chain design and configuration with the social scope is a promising research area. Many public programs imply production or transportation of products related to health, food security or other types of humanitarian aid. Usually, this kind of program has the same target population, but its resources and networks are designed and managed independently. Therefore the design of collaborative aid networks can help to improve the public resource allocation and efficacy will be included in future research efforts.
Also, logistics systems as the Bienestarina supply chain, have special characteristics, such as social-oriented objectives, high distribution coverage, and connection with a vulnerable population. These features make this kind of system suitable for disaster response, however, effects evaluation on a possible disaster and the design of adaptation procedures toward multi-purpose supply chains should be researched.

