Introduction
In Colombia, South America, gold extraction, on the small and medium scales, is carried out through the Merril-Crawe process, which consists of the lixiviation of the gold mineral, using sodium cyanide solutions as solvents and zinc for further precipitation. During this process, cyanide water is produced, and both low gold selectivity and sensitivity to oxygen occurs. Adsorption-desorption with activated carbon is an alternative to the Merril-Crawe process due to its higher selectivity for gold (Sheya and Palmer, 1989). Moreover, this process eliminates further clarification and filtration due to the addition of carbon particles directly to the cyanidation pulp. Gold loss during the adsorption-desorption process is also significantly lower than that of the Merril-Crawe process, thus offering economic advantages for both major gold recovery as well as lower comparative capital and operation costs (Navarro and Wilkomirsky, 1999).
However, in Colombia, coal is extracted mainly for exportation. In 2011, only 7,61% of the extracted coal was used internally for coke production and energy generation (Ministerio de Minas y Energia, 2012). For the above, Colombian coal valorization constitutes an alternative to strengthening and promoting technological development within the Colombian carboniferous zones.
Activated carbon is a material formed by a carbon structure and a minimal concentration of other atoms such as oxygen or hydrogen. Activated carbons can be produced from diverse materials such as coconut shell, rice husks, and coal (Yahya, Al-Qodah, and Ngah, 2015). The porous structure of activated carbons is the most important physical property, and its final use depends on pore distribution (Uribe, López and Gonzáles, 2013). To produce properly activated carbon for gold adsorption, it is necessary to understand the mechanism of the aurocyanide ion attached to the carbon surface. There is no general agreement regarding this mechanism. The gold adsorption process is dominated by kinetics, not by an equilibrium constant. Moreover, it is dominated specifically by gold diffusion from the external surface to the inner surface of the activated carbon particles. (Seke, Sandenbergh, and Vegter, 2000). Diffusion through micropore structures is slow. Thus, gold reaches these spaces only at the equilibrium phase, which occurs after a long-time lapse in a carbon in pulp (CIP) plant (Pleysier, Dai, Wingate, and Jeffrey, 2008).
McDougall, Hanckock, Nicol, Wellington, and Copperthwaite (1980) proposed the most accepted mechanism of gold adsorption. It involves adsorption of an ionic pair Mn+ Au(CN)x, where Mn+ is a metallic ion. Then, there is a reduction stage, with the formation of type-species Au(CN)x on the carbon surface. This mechanism describes the aurocyanide ion adsorption without any chemical transformation. Although this mechanism is the same for acid and basic pH, gold adsorption, in terms of adsorption rate, is higher for alkaline pH, and its equilibrium constant is larger for acid pH. With low pH (< 3), gold is present in the form of aurocyanide acid, and at intermediate pH, the ionic pair and aurocyanide acid are observed simultaneously (Adams, 1989; Fleming, 1984). The ionic pair is adsorbed preferably on hydrophobic sites formed by carbon bonds overactive sites of superficial groups with oxygen or nitrogen (Jia, Steele, Hayward, and Thomas, 1998).
Aurocyanide complexes adsorb to imperfections on graphite or graphene layers, whereby physical activation results are more convenient due to the formation of carbon structures that are more disordered than the carbon structures produced by chemical activation. Aurocyanide ion adsorption occurs irreversibly through the electrostatic interaction of Au (CN)2-on the active polar sites of activated carbon, but the ionic pair KAu(CN)2occupies fewer active sites through Van der Waals forces (Yin et al., 2014).
To use coal as raw matter to produce activated carbon suitable for the gold adsorption process, the activated carbon must be produced using a physical activation that would provide it with a major number of hydrophobic sites related to the aurocyanide ionic pair (Jia et al., 1998). The superficial area should be from 600 to 900 m2/g and they must have high porosity (Navarro and Vargas, 2010; Pleysier et al., 2008; Seke et al., 2000; Yalcin and Arol, 2002). Porosity distribution depends on coal rank due to its relationship with volatile matter and fixed carbon ratio. Thus, bituminous and sub-bituminous coal could have adequate fluidity for mesopore and micropore formation during the carbonization stage (Marsh and Rodríguez-Reinoso, 2006).
In this work, activated carbons were produced from seven Colombian coals for gold adsorption in cyanide solutions. Different morphologies of the activated carbons produced from the used coals were obtained. Proximate analysis of original coals and activated carbons was performed as well as an evaluation of the effect of the temperature and residence time during the activation stage. Mass yield, IN, and the surface area of the activated carbons were determined. Testing of our activated carbons and a commercial source using artificial and waste gold solutions was performed. Adsorption isotherms were adjusted using the Freundlich adsorption model for artificial solutions and linearized Langmuir plots were used for gold waste solutions.
Experimental section
Materials and methods
Bituminous and sub-bituminous coals from seven departments of Colombia (Antioquia (A), Boyacá (B), Cundinamarca (C), Guajira (G), Norte de Santander (N), Santander (S) and Valle del Cauca (V)) were used in this work. The coals were characterized by proximate and ultimate analyses according to ASTM standards (ASTM, 1958). The samples were crushed to particle size (< 250 m) using a disk mill.
Activated carbons were produced in two stages. During the first one, carbonization was carried out to decrease the volatile matter content using an atmosphere of N2, with a flow of 0,65 L/min, a temperature of 850 °C, a residence time of 2 h, and a heating rate of 10 °C/min. In the second stage, steam was used as the activating agent with a flow of 0,275 L/min. A factorial design of 22 for each coal was used, with two levels of temperature (700 °C and 850 °C) and with residence times of 1,5 h and 2,5 h. Those operating temperature conditions were selected according to preliminary tests and literature review about activated carbons using Colombian coals as precursors (Benabithe etal., 2005; Navarro and Vargas, 2010; Uribe et al., 2013). Central points with duplicates were used for error estimation.
Proximate analysis was performed on activated carbons for determination of moisture, volatile matter, ash, and fixed carbon. Iodine number was used as an indicator of micropore content. Activated carbons with both the highest and lowest micropore content were selected to evaluate the effect of the micropore content on gold adsorption (Yalcin and Arol, 2002).
The characterization of activated carbons also included the determination of surface area, the mean pore size and the micropore content using ASAP 2020 Micromeritics equipment. The micropore volume was determined by the software in the summary report as a t-plot micropore area. We used the gas adsorption isotherm of N2 at 77 K on the sample, and then performed pore size distribution analysis with the ASAP 2020 V4.01 (V4.02 E) software already installed on the instrument. The instrument was programmed to start from P/Po ~ 1e-5 and collect a large number of data points (~ 80-90) up to P/Po = 1. Thus, pore size distribution could be calculated for pores from ~ 1 nm large.
The morphology of the carbons was determined by scanning electron microscopy (SEM) with JSM-6490 SEM JEOL Ltd. equipment.
Gold adsorption tests were carried out using both artificial and real gold cyanide solutions. Solutions of 5, 10, 15, 25, 35, 50 and 100 ppm Au (11,6 < pH < 11,9) were used for the artificial tests. A weight of 1 g ±1 mg of each activated carbon was added to a 50 mL solution, which was kept under constant agitation at 190 rpm for 8 h. A waste gold solution of 21 ppm Au, from Buenos Aires gold mine, in Cauca, Colombia, was used as a real cyanide solution. The gold equilibrium concentration in the remaining solution was measured by atomic absorption spectrometry. Gold load, X/M (mg Au/g), was determined by the difference between the initial and final gold concentrations. The gold load versus the equilibrium gold concentration in solution C (ppm) was adjusted to the Freundlich isotherm in order to establish the adsorption constant at equilibrium K which corresponds to the maximum gold load for these conditions. The least squares fit method was used to adjust the data.
Results and discussion
Original coal characterization
Original coals were characterized by proximate and ultimate analyses, and the results are presented in Table 1. Coal rank was obtained according to ASTM D 388-19a (2019), where Fixed Carbon (FC) and Volatile Matter (VM) are on a dry mineral matter free -basis.
Table 1 Proximate, ultimate analyses and rank of the original coals
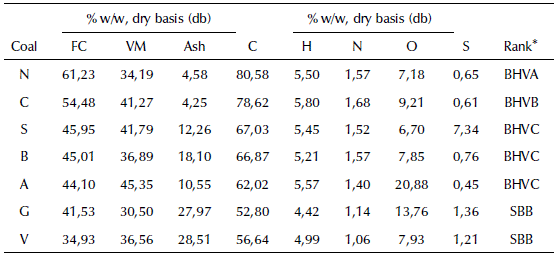
BHVA, Bituminous, high volatile A; BHVB, Bituminous, high volatile B; BHVC, Bituminous, high volatile C; SBB, Sub-bituminous, B
Source: Authors
Volatile matter and fixed carbon content are indicators of both carbonization degree and porosity development because, during the carbonization stage, the porosity of char is formed through the release of volatile matter. Additionally, during the activation stage, steam consumes fixed carbon from the charcoal pore walls, widening them. In this process, the limiting stage is represented by the steam adsorption onto a solid surface, which makes the distribution of fixed carbon and volatile matter determine the production of the activated carbons. (Uribe et al., 2013). For the above, the coals G and A would probably produce high surface areas. Ash content does not contribute to the development of porosity, but ash content does affect adsorption properties, as it creates inactive sites.
Some authors such as Adams, McDougall, and Hanavecock, (1987), Ibrado and Fuerstenau (1992), and Lagerge, Zajac, Partyka, and Groszek, (1999) showed that some elements such as C, H, and O affect the adsorption process. Carbon content influences gold adsorption due to its relationship with C-C bonds, which corresponds to graphite layers, where the aurocyanide ionic pair is preferentially adsorbed. Oxygen content is related to a higher reactivity: surface compounds containing oxygen are consumed more easily at high temperatures, generating spaces into the structure that allow the entrance of activating agents to consume fixed carbon, thus widening the pores (Gentzis, Hirosue, and Sakaki, 1996). According to the above, activated carbons produced from A and G coal, theoretically, may produce a higher content of macropores. In addition, H content is associated with volatile matter release (Gentzis et al., 1996; Niksa, 1995). Therefore, devolatilization capacity should be similar in all the original coals used.
Table 1 presents the rank of original coals used. In general, coals are in the rank of bituminous and sub-bituminous, with differences in volatile matter content. In terms of the fluidity of the carbon matrix at high temperatures, those ranks are similar (Marsh and Rodríguez-Reinoso, 2006). According to ASTM D388-19a (2019), the bituminous, highly volatile C coals may cause agglomeration between particles during activated carbon production.
Morphology of activated carbons
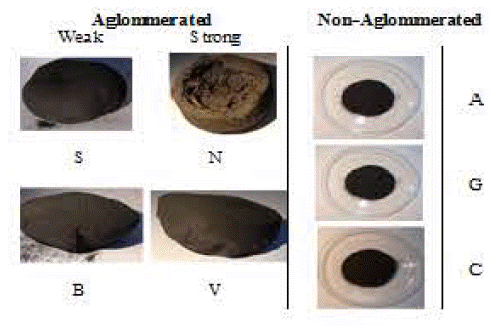
Figure 1 shows the different morphologies of activated carbons produced from the used coals. There are two types of agglomeration: (1) agglomerated from coals B, V, S and N, and (2) non-agglomerated activated carbons from coals A, C and G.
Non-aglommerated morphology could be due to the low swelling index, whereas aglommerated coals have a medium and high swelling index. Activated carbons from coals B and C present a weak agglomeration, whereas V and N presenta strong agglomeration. The NS coal formed activated carbons with concave shells of high volume that were melted during the process. Those different agglomerations affect the porosity and surface area, which affects gold adsorption.
Proximate analysis of activated carbons
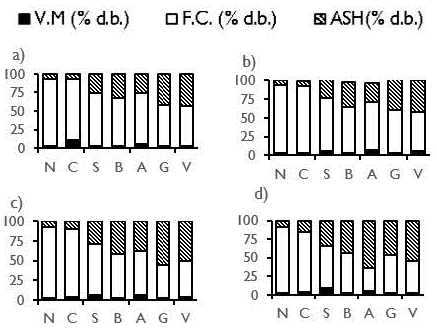
Proximate analysis of the activated carbons is presented in Figure 2. Some differences in the properties of activated carbons were presented when they were obtained under different temperature and residence time conditions. In general, for all activated carbons, volatile matter showed a lower concentration compared to the original coals. Values of less than 10% were obtained for volatile matter, indicating that the devolatilization process was effective. This result is related to the content of hydrogen that, for all the original coals used, does not vary by more than 1%.
Source: Authors
Figure 2 Proximate analysis of activated carbons from coals: a) 700 °C, 1,5 h; b) 700 °C, 2,5 h; c) 850 °C, 1,5 h; d) 850 °C, 2,5 h.
In general, for all the operating conditions, the coals N and C produced activated carbons with the highest fixed carbon and lowest ash contents. Those properties are followed by activated carbons from coals S, B, A, G and V.
In general, for all activated carbons, the ash content increased with temperature. This behavior is related to the increased release of volatile matter and the increased consumption of fixed carbon. The highest values of ash were displayed by the activated carbons V and G at a temperature of 850 °C. Those results matched the ash content of the original coals.
Mass yield of activated carbon
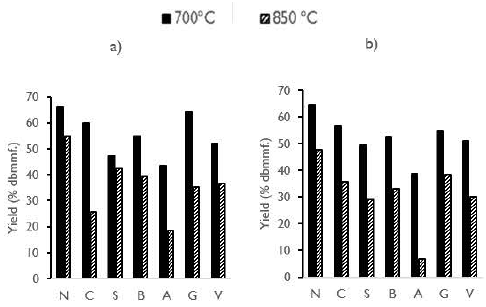
Figure 3 shows the mass yield (Y, %, dry basis mineral matter-free, dbmmf) of the activated carbons obtained as a function of activation temperature and residence time. For both residence times, mass yield decreased as temperature increased. Mass yield values were approximately between 12%and 65%. Activated carbon N presented the highest mass yield at a temperature of 700 °C and at both residence times, whereas the activated carbon A presented the lowest yields under all the operating conditions. As mentioned above, coal A presented the highest O content, and its functional groups on the surface probably reacted more quickly to the activating agent, allowing greater weight loss associated with the consumption of fixed carbon. Those results agree with Ibrado and Fuerstenau (1992).
A statistical analysis was carried out to evaluate the influence of the coal-type factor, the residence time and the temperature of the activation stage on the response variable mass yield. Table 2 shows the data obtained from the ANOVA for the mass yield. Although residence time was significant within the studied range, temperature was the most important variable in the process. In addition, the interaction between the temperature and the type of coal was significant, although much less important in magnitude than temperature.
Table 2 ANOVA for mass yield
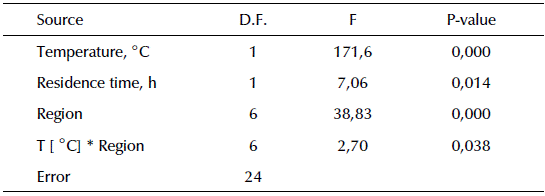
D.F., Degree of Freedom, F, Calculated F for F-test. P-Value, Probability value.
Source: Authors
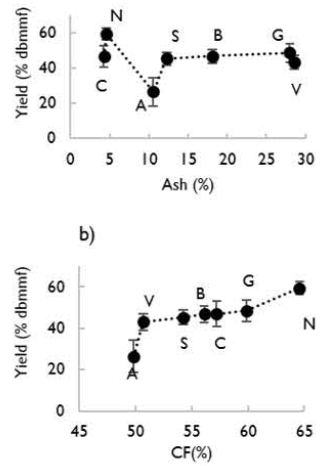
In Figure 4, the main effects of fixed carbon and ash content on the mass yield are shown. It increased with fixed carbon content related to coal rank. Coals of high rank have low reactivity. According to the above, the highest yield was obtained for the N activated carbon.
Regarding the ash content of the activated carbons, the mass yield decreased with the increase in ash content, which can be related to an inhibiting effect caused by ash on the carbon surface, preventing steam from going through the initial pores of the charcoal. However, the ash content effect is minimal compared to the fixed carbon and temperature effect (Linares-Solano, Martín-Gullon, Salinas-Martínez De Lecea, and Serrano-Talavera, 2000).
Iodine Number (IN) of activated carbons
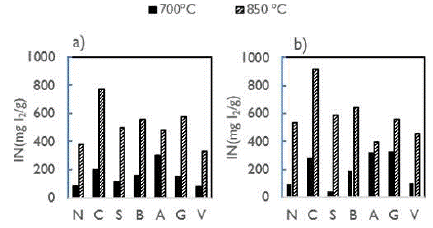
Figure 5 shows the IN of the activated carbons obtained under all the operating conditions. Those values of IN were in rank 40, with 910 mg I2/g.
Source: Authors
Figure 5 IN of activated carbons from original coals at temperatures of 700 and 850 °C. a) 1,5 h; b) 2,5 h.
The IN figures obtained with our prepared activated carbons are in the range of values when compared to the Yalcin and Arol range of 466-440 mg I2/g (2002). They used helzenut shells, apricot stones, and peach stones as precursors, with steam as an activator agent, and temperatures between 800900 °C. When it is compared to commercial activated carbons, (836 mg I2/g), produced by CECA company (Soleimani and Kaghazchi, 2008), The IN figure also fallas within the range of our activated carbons.
In general, for all the activated carbons and residence times, IN increased with the increase in activation temperature. Kiel, Sahaglan, and Sundstrom (1975) concluded that, by increasing the activation temperatures, the kinetics of reactions between the fixed carbon and steam also increased. CO and H2 molecules produced as intermediate products during the activation process usually blocked the entrance to the inner initial porosity in the charcoal, causing an impediment for steam to react with fixed carbon on the pore surface. At higher temperatures, both molecules were consumed faster, allowing the charcoal surface to react with the steam (Uribe et al., 2013).
The two highest IN values (919 y 773 mg I2/g) were produced with C coal at 850 °C. Even though N coal had similar characteristics, the maximum iodine number was 535 mg I2/g. These differences in IN values are possibly related to the elastic properties of coal (Greenbank, M., and Spotts, S., 1993; Marsh and Rodríguez-Reinoso, 2006). As Figure 1 shows, activated carbon N had fused particles while C carbons did not form any kind of agglomerate. The lowest IN values were obtained with V coal, which had the highest ash content and lowest fixed carbon content.
Theoretically, all activated carbons produced from bituminous high volatile C coals (B, C, and A) should have similar characteristics. However, differences in O content (20,88%) for A coal could explain the differences observed in IN values. According to Gentzis et al. (1996), oxygen content is related to the presence of vitrinite maceral. Vitrinite is more easily broken at high temperatures, generating a porous matrix. Therefore, for the activated carbons, micropores can be formed at 700 °C but, when the temperature increases, steam is consumed by the inner fixed carbon, transforming micropores into meso- and macropores, thus generating a lower IN. For sub-bituminous B rank, a behavior similar to bituminous high volatile C was observed. Oxygen content of G activated carbon (13.76%) was almost twice the oxygen content of V (7,93%). Therefore, during the activation process, those oxygen surface groups were consumed faster, creating wider pores for the G activated carbon.
Table 3 shows the ANOVA for IN of the activated carbons. The activation temperature was the most important factor, followed by region (coal), residence time, and the interaction between temperature and region.
Table 3 ANOVA for IN of the activated carbons
| Fuente | D.F. | F | P-value |
| Temperature, °C | 1 | 235,19 | 0,000 |
| Time, h | 1 | 5,08 | 0,034 |
| Region | 6 | 20,55 | 0,000 |
| T [ °C] * Region | 6 | 4,94 | 0,002 |
| Error | 24 |
Source: Authors
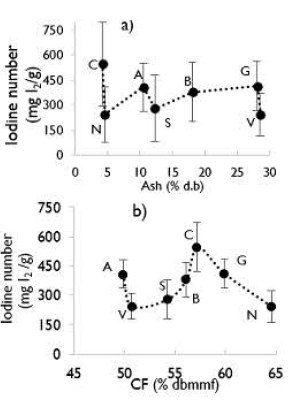
In Figure 6, the main effects of fixed carbon and ash content are shown. According to Kiel et al. (1975) and Uribe et al. (2013), the nature of the global reaction is endothermic, making kinetics increase with temperature. However, fixed carbon had a positive effect (from 49% to 57%). Then, a decreasing iodine number was observed. The initial positive effect may be related to fixed carbon disponibility and reactivity; sub-bituminous coal (lowest fixed carbon content) had a larger probability of allowing steam to react with the inner walls of each pore, widening them and producing lower iodine numbers. A coal developed more micropores than V, S, and B coals. This could be related to the barrier effect of ash, which inhibits fixed carbon-steam contact. The negative behavior corresponds to activated carbons when the fixed carbon content is approximately 66%, and according to Gentzis et al. (1996), higher rank coal corresponds to lower reactivity and elasticity.
Surface area of the activated carbon
The surface area of the selected activated carbons, according to the highest iodine number, was determined to compare the influence of microporosity on gold adsorption. Additionally, an activated carbon GRC 22, particle-size (6 x 12) Tyler mesh from Calgon Carbon industry, was characterized to compare it with the produced activated carbons. The BET area, micropore area, micropore percentage, pore size and pore volume results for the selected activated carbons are shown in Table 4.
Table 4 Surface area ofactivated carbons and GRC 22 (6 x 12)
| Activated Carbon | BET Area (m2/g) | Micropore Are (m2/g) | Micropore Percentage (%) | Pore Size (A) | Pore Volume (cm3/g) |
| C-850-2.5* | 773,2 | 369,2 | 47,7 | 36,5 | 0,7058 |
| C-850-1.5 | 588,9 | 328,4 | 55,8 | 29,0 | 0,4265 |
| B-850-2.5 | 474,9 | 339,3 | 71,5 | 19,9 | 0,2360 |
| S-850-2.5 | 507,0 | 362,5 | 71,5 | 21,6 | 0,2737 |
| G-850-1.5 | 427,1 | 363,2 | 85,0 | 20,4 | 0,2177 |
| GRC 22 6 x 12 | 880,2 | 654,0 | 74,3 | 21,5 | 0,4735 |
Source: Authors
According to Navarro and Vargas (2010), pore volume is high when it is higher than 0,2 cm3/g, with a surface area between 400 and 1500 m2/g. Therefore, only the activated carbons with the highest IN can be considered commercial-grade. A decrease in the surface area with increasing micropore percentage was observed. Except for the activated carbons B-850-2,5 and S-850-2,5, the activated carbons had the same proportion of micropores, and the differences in the surface area were low.
For the activated carbons C-850-2.5 and C-850-1.5, the micropore percentage was close to 50%, which suggests that surface area is composed by larger pores such as macro- and mesopores, since pores in the external surface are formed before inner pores and, thus, they are exposed to steam for a longer time. This pore distribution could give an aurocyanide ion easier diffusion from the external to the internal area. The commercial activated carbon GRC 22 (6x12) presented a larger surface area compared to the activated carbons produced in this work, and a micropore percentage of approximately 70%.
In agreement with Navarro, Vargas, and Aguayo (2009) and Seke et al. (2000), the appropriate pore volume for gold adsorption should be larger than 0,4 cm3/g. Using this criterion, only activated carbons C-850-2.5, C-850-1.5 and the commercial GRC 22 would be useful for this application. Therefore, gold adsorption tests with both real and artificial aurocyanide solutions were performed with those activated carbons.
Gold adsorption using artificial solutions
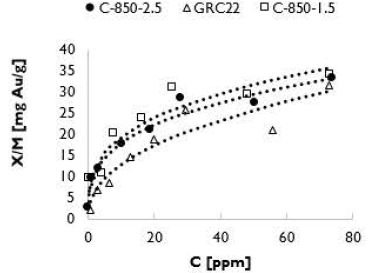
Figure 7 shows the adsorption isotherms for the activated carbons GRC 22, C-850-1.5 and C-850-2.5. According to Ho (2004), the isotherms are generally type II. Increasing gold concentrations in the initial solutions causes high gold adsorption in the activated carbons. However, it is difficult to find solutions with higher concentrations in industrial applications, where anything higher than 100 ppm is not applicable (Fleming, Mezei, Bourricaudy, Cañizares, and Ashbury, 2011). The adsorption isotherm curves corresponding to the GRC22 activated carbon are under the other curves obtained for activated carbons C-850-2.5 and C-850-1.5, which means that our prepared activated carbons presented a higher gold adsorption compared with the commercial activated carbon used for this application.
The data of the adsorption isotherms were adjusted using the Freundlich adsorption model, represented by Equation (1):
where C is the concentration of gold at equilibrium, X is the mass of gold loaded in mg, M is the weight of the activated carbons, and K is the constant defined as the maximum load of the gold at equilibrium with the solution at a concentration of1 ppm. The adjustments were made using the least squares method. Table 5 shows the values of K and n as well as the Pearson adjustment coefficient. The Pearson correlation factor was over 0,9, which means that the data adjusted well to the Freundlich model.
Table 5 Adsorption constant at equilibrium according to the Freundlich model
| Sample | K (mg Au/g) | n | Pearson Factor |
| C-850-2.5 | 8,73 | 3,2 | 0,98 |
| C-850-1.5 | 9,35 | 3,2 | 0,95 |
| GRC22 | 4,74 | 2,3 | 0,94 |
Source: Authors
Yalcin and Arol (2002) reported gold equilibrium constants in the range of 23-100 mg Au/g for commercial activated carbons. Table 5 shows that the K value of GRC 22 was low compared to our activated carbons C-850-2.5 and C-850-1.5.
The highest K value (9,35 mg Au/g) was obtained with activated carbon C-850-1.5, even though C-850-2.5 had a larger surface area (773 m2/g) and IN (919 mg I2/g). This behavior proves that longer residence times during activation increase the ash concentration and decrease the active sites on the surface of activated carbons (Linares-Solano et al., 2000). According to Table 3, C-850-1.5 presented a higher micropore proportion (55,8%) than C-850-2.5 (47,7%), which confirms that micropores provide the total adsorption capacity. However, the total micropore area for C-850-1.5 was the lowest, suggesting that, during gold adsorption processes, pore distribution is more important than the total micropore area.
In general, the two produced activated carbons with high IN presented higher K values than GRC 22. A larger micropore proportion in GRC 22 and a larger particle size may cause lower gold adsorption, since micropore excess in the external surface can cause lower gold adsorption in the equilibrium with the molecules of the aurocyanide ion adsorbed on the surface. This prevents the diffusion of the molecules towards the interior of the granules of the activated carbon (Gloria J. McDougall and Hancock, 1981; Qada, Allen, and Walker, 2008).
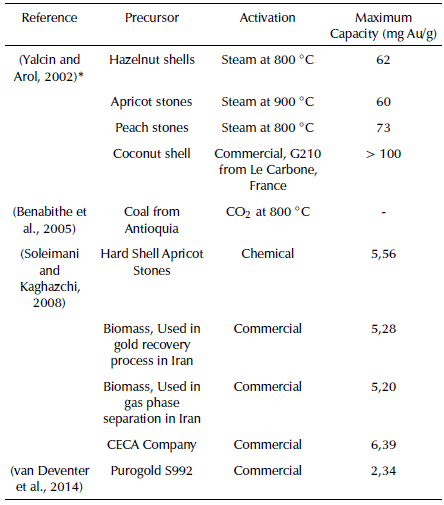
The sorption capacity of the activated carbons toward gold can be seen in Table 6 compared with other carbonaceous materials prepared from different waste and coals
Table 6 Maximum gold load for different activated carbons
* Aurocyanide concentration of 1000 ppm.
Source: Authors
According to the results in Table 8, the maximum gold capacity (mg Au/g) for our prepared activated carbon has similar figures to the capacity displayed by the commercial activated carbons produced by Purogold 5992 and CECA Companies. In addition, since there is a lack of uniformity in the way in which gold maximum capacity tests are carried out, activated carbons evaluated by Yalcin and Arol, (2002) show higher capacity than ours. However, they used a higher concentration of 1000 ppm aurocyanide solution.
Table 7 Gold adsorption data for C-850-1.5 and GRC 22, 10 x 16 particle size
| Sample | K (mg Au/g) | n | Pearson Factor |
| GRC 22 10 x 16 | 4,64 | 2,4 | 0,98 |
| C-850-1.5 10x16 | 4,56 | 2,0 | 0,98 |
Source: Author
Particle size effect
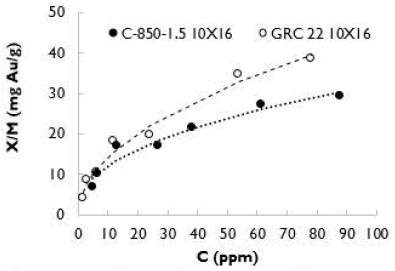
To exclude the particle size effect over K values, additional gold adsorption tests were carried out, using C-850-1.5 and GRC 22 with the same particle size (10 x 16), with an activation temperature of 850 °C and with a residence time of 1,5 h. In Figure 8, gold adsorption isotherms are shown.
The adsorption isotherm for the sample of GRC 22 (10 x 16) was over the isotherm of the activated carbon C-850-1.5, which is contrary to the results obtained using smaller particle size (60 x 120). Table 7 shows the K, n and Pearson correlation values obtained from the two isotherms. A good match between the experimental data and the Freundlich model was obtained.
Gold adsorption using a waste solution
A gold solution from a waste stream produced in Buenos Aires gold mine, in Cauca, Colombia, was used. The composition of the waste solution was 21 ppm Au, 3800 ppm Cu and 3000 ppm CN. Tests were carried out using different activated carbon loadings for the same solution. According to the Adsorption Isotherm Regional Analysis (ARIAN) model described by Abdollahi (2015), isotherms can be divided into four regions, defined by the equilibrium concentration rank. For gold adsorption tests with the waste solution, only regions I and II were identified, since the initial concentration was low. Regions I and II correspond to monolayer formation on the activated carbon.
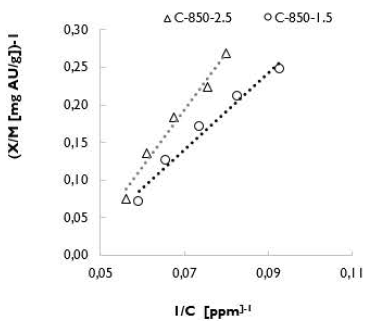
The linearized form of the Langmuir equation (Equation 2) was used to adjust the values obtained in the adsorption tests with the waste solution:
where C e is the concentration of the equilibrium solution (ppm), Q e is the maximum charge of gold at equilibrium (mg Au/g), and b is the Langmuir constant. To establish the adsorption favorability through the type of isotherm, the dimensionless equilibrium parameter was determined with Equation (3):
where b is the Langmuir constant and C 0 is the initial concentration of the solution. The value of R l indicates the type of isotherm: unfavorable (> 1), linear (= 1), favorable (between 0 and 1), or irreversible (= 0).
Tests were carried out on C-850-1.5 and C-850-2.5, and the corresponding adjustments were made according to the Langmuir isotherm. Carbon C-850-1.5 had the highest value of adsorption capacity, considering that the coal load was the highest among the others. The adjustments to the Langmuir isotherm are shown in Table 8. Moreover, R l shows that the isotherm is favorable for the process of gold adsorption using activated carbon.
Figure 9 shows that the inverse of the load was high for carbon C-850-1.5, which confirms that the tests carried out with the waste solution are a good indicator of the loading capacity of activated carbons in equilibrium.
SEM analysis of the activated carbons
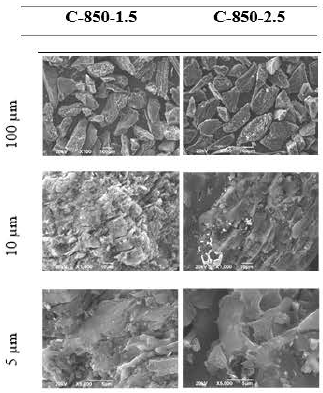
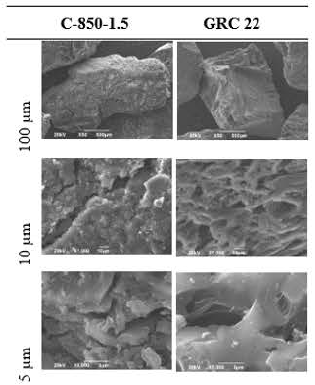
To establish the differences between the surfaces of the activated carbons, SEM analysis was performed. Three photographs were taken at 100, 10 and 5 m, which are shown in Figures 10 and 11 for carbon activated samples C-850-1.5 and C-850-2.5, with particle size 60 x 120, as well as for samples C-850-1.5 and GRC 22 (10 x 16).
In general, the activated carbon C-850-1.5 exhibited the most irregular surface and texture in comparison with sample C-850-2.5. High residence time probably generates a larger consumption of carbon walls, thus producing a smaller surface area and a longer distance between the layers, with fewer available spaces for gold adsorption. Therefore, high residence time during activation has a negative effect on gold adsorption, possibly due to sample C-850-2.5 having more micropores in the inner surface of the activated carbon, whereas sample C-850-1.5 had micropores on the external surface, and the diffusional limitations decreased.
With respect to C-850-1.5 and GRC 22 with a particle size of 10 x16, the first one presented a larger amount of structural irregularity and less pore layer separation than the second one. These findings are in agreement with Pleysier et al. (2008), who showed that gold preferably adsorbs to pore imperfections formed by graphene layers. Then, an external surface formed by micropores may cause external gold saturation for the sample C-850-1.5 x16 because there is a barrier made by adsorbed ionic pair gold molecules, preventing the gold particles from going through the pores to the inner ones.
Conclusions
It was possible to produce activated carbons that could be applied to gold adsorption processes from Colombian coals. Their characteristics are comparable to a commercial activated carbon obtained from biomass. The IN corresponding to the activated carbon C-850-1.5 has the highest adsorption capacity of 775 mg I2/g. The highest IN iodine is not related to the maximum adsorption capacity, since it was not possible to establish the distribution of porosity from this variable. The most important process variable during the activation, in terms of the IN, was the activation temperature since it directly affected the kinetic constant of the reactions between the carbon surface and the activating agent (steam). The appropriate activation time corresponds to 2 h, whereas the temperature should be 850 °C, since, with those values, both the IN and the yield are maximized. The particle size of the activated carbons has an influence on their adsorption capacity. When comparing C-850-1.5 with commercial GRC 22 at the same particle size, similar K values were obtained for both, indicating that the produced activated carbon has the characteristics of a commercial one used in gold adsorption. The coals, raw material for the production of activated carbons used in cyanide solutions, were adequate since the structure of this material has larger sites derived from imperfections in the graphite plates formed during the carbonization and activation, as compared to the activated carbon produced from biomass.


