


 English (pdf)
 Article in xml format
 Article references
 Send this article by e-mail
 Cited by SciELO
  Cited by Google
  Similars in
SciELO
Similars in
SciELO  Similars in Google
 Permalink
Introduction
The prediction of the bearing capacity and the footing settlement with a reasonable accuracy is required in the field of foundation design and affects the overall economy of a project. For this purpose, the bearing capacity equations for conventional footings such as strip, square, circular, and rectangular were well established and are available in the literature. However, different, unconventional geometries for shallow footings were sometimes required for the economy and architectural matters. Numerical analysis using FLAC 3D software was carried out by Ghazavi and Mokhtari (2008) to observe the failure behavior of the sand beneath multi-edge shallow footings. The laboratory tests were performed by Davarci, B., Ornek, M., and Turedi, Y. (2014) on multi-edge footings and reported that the performance of such footings was better than that of square ones of the same width. Furthermore, for these types of footings, no bearing capacity and settlement equations were available in the literature. Hence, the researchers had to resort to experimental research, but generating this kind of data is very expensive. An alternative approach could be building a mathematical model to understand the relationships between the various parameters by calibrating and fitting the generated experimental data. To this effect, the power of ANN to store, learn and capture the complicated relationships between multiple parameters without any prior assumptions is the best choice in determining the bearing capacity ratio and the settlement reduction factor. Hence, the paper presents the application of ANN to model such parameters in unconventional multi-edge skirted footings on the sand.
Background
There have been several studies with ANN in the geotechnical engineering, such as those related to bearing capacity and the settlement of regular shaped footings in different mediums (Kalinli, Acar, and Gunduz, 2011; Marto, Hajihassani, and Momeni, 2014; Ziaee, Sadrossadat, Alavi, and Shadmehri, 2015; Nazir et al., 2015a; Rezaei, Nazir, and Momeni, 2016; Momeni, Armaghani, Fatemi, and Nazir, 2017; Khudier, 2018). The bearing capacity of the footing on sand was predicted by Kalinli et al. (2011) using ANN based on 97 datasets by varying the footing width, embedment depth, geometry, unit weight of sand, and the friction angle of the cohesionless soil. On similar lines with Kalinli et al. (2011), other researchers have explored the application of ANN on the prediction of the bearing capacity of footings resting on sand and rock. The list of these references with the scope of their work, type of material, type of data collected, settlement to width ratio, data set, and input parameter is shown in Table 1.
Table 1 Dataset and parameters varied in the literature for the development of ANN model
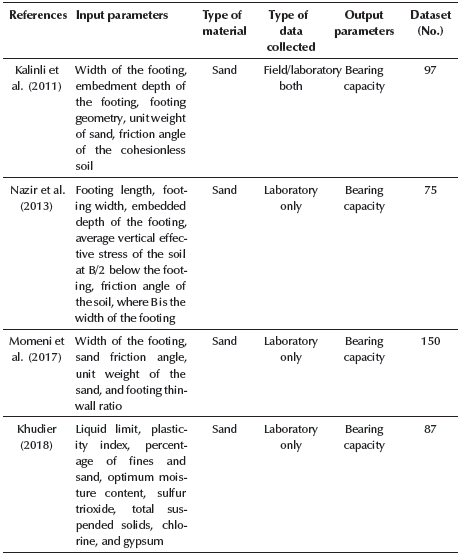
Source: Authors
Note that, for the references listed in Table 1, the dataset in various cases ranged between 75 and 150. Similarly, some papers predicted the ultimate bearing capacity and settlement of the piles using experimental data with help from different soft computing techniques (Nazir, Momeni, Marsono, and Sohaie, 2013; Nazir et al. 2015b; Momeni et al. 2015a; Harandizadeh, Armaghani, and Khari, 2019; Chen etal. 2020; Khari et al. 2020; Yong et al. 2020). Furthermore, the results obtained from all the studies above indicated that ANN-based predictive models could be satisfactorily used in predicting the bearing capacity and the settlement of regular shaped footings. In the present paper, the data for regular shaped (square and circular) skirted footings were collected from the published literature, whereas the data for the multi-edge (T, Plus, Double box) skirted footings were generated through experimentation in the laboratory. The data was used during training, testing, and the predictive phase of ANN models. Input variables for the bearing capacity ratio were skirt depth to width ratio of the footing and friction angle of the sand for ANN modeling. Similarly, to model the settlement reduction factors, the considered input variables were skirt depth to width ratio of the footing, friction angle of the sand, and normal stress. The outputs for these ANN models were bearing capacity ratio and the settlement reduction factor, respectively.
Experimental Materials and Methods
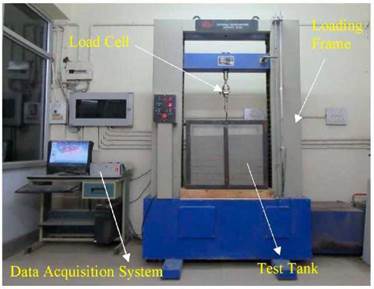
As mentioned earlier, the data related to the bearing capacity and the settlement of multi-edge skirted footings on the sand was generated by performing experiments in the laboratory. All tests were performed in s tank (700 mm length x 450 mm width x 600 mm depth), which was prepared with a 15 mm thick perspex sheet, stiffened by the mild steel plate as shown in Figure 1.
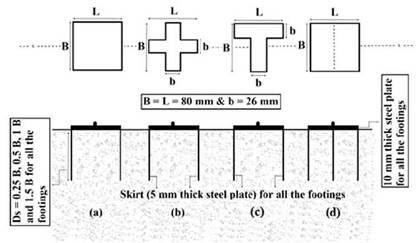
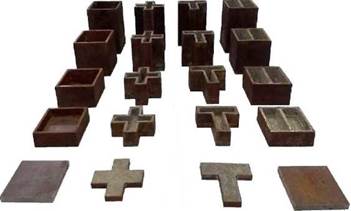
The 10 mm thick steel footings with plan dimensions 80 mm x 80 mm were prepared in the shape of a square, T, plus, and double box, as shown in Figure 2. The skirts with 5 mm thickness and depths between 0,25 B and 1,5 B were firmly welded to these footings to simulate skirted footings, as shown in Figure 3.
Source: Authors
Figure 2 Plan and a sectional view of various shapes of unskirted and skirted footings: (a) square, (b) Plus, (c) T shape, (d) Double box.
In the case of rough footings, the sand was pasted to the base of the footing and also to the inner surfaces of the skirt; while, as for partly rough footings, a machined surface was used as it was. Beas river sand was used in this research and had a specific gravity (2,67), coefficient of uniformity (C u = 1,46), coefficient of curvature (C c = 0,98), and minimum and maximum dry unit weights of 13,06 kN/m3 and 15,97 kN/m3, respectively. As per IS 1498, the sand was classified as poorly graded (SP). The consolidated drained triaxial friction angle of sand at relative densities of 30%, 40%, 50%, and 60% was measured as 36,06°, 38,64°, 39,86°, and 41,72°, respectively. It is pertinent to note that due to the dilatancy effect, the friction angle of sand depends on the prevalent stress level or confining pressure in the test. Hence, it is likely that the friction angle developed in the small scale laboratory test, such as this one, will be much greater than the mobilized friction angle for the field size footing at failure with similar loading and soil conditions. Therefore, the predicted bearing capacity for the field size footing will be generally higher if extrapolated linearly from the results of the small-scale laboratory test data. This aspect is referred to as the size or scale effect on the bearing capacity (Chakraborty and Kumar 2013; Tang et al. 2014). To study this effect, it is necessary to carry out the load test with different footing sizes, which is a cumbersome task, especially with respect to multi-edge skirted footings. Hence, in the present study, no attempt has been made to study it. This implies that care is paramount when extrapolating the results of the present study for the field size footings. The tank was filled with sand to achieve the targeted relative density, which was varied from 30% to 60% in this investigation. The sand bed was placed in the tank in 8 equal 60 mm thick layers. The weight of the sand in each layer was calculated corresponding to the required relative density by using the unit weight of the sand and the volume of the layer. The weighed sand was then poured from a constant height and was compacted using a wooden 6 N rammer by giving several blows (obtained using the trial and error method) to reach the required relative density. It was ensured that the difference in measured relative densities was within ±1%. This was achieved by placing four steel bowls of known volume in each of the layers and measuring the achieved relative density of sand in them. As shown in Figure 1, the test on the prepared sand bed was performed with a strain-controlled loading frame of 50 kN and the employment of a load cell of 5 kN capacity. Note that, rather than measuring the pressure below the footing, the load applied on the top of the footing was recorded with a data acquisition system. This implies that this measured load, divided by the plan area of the footing, represents the magnitude of the average uniform pressure below the footing. Furthermore, any non-linear variation of normal stress was not considered (Kumar, 2009). This assumption is in linewith the literature, wherein the magnitude of the bearing capacity is defined based on the average uniform pressure. All the tests were performed using a 0,24 mm/min strain rate. It was intended that at this low strain rate, it would be possible to capture the non-linear pressure-settlement behavior. It was assumed that the measured penetration depth of the applied load would be a reasonable representation of the immediate settlement of the footing. However, further study is required to confirm this, since it is beyond the scope of the present work. After the completion of each test, the pressure-settlement curve was plotted, and, subsequently, the bearing capacity and the settlement at a given pressure were calculated. It was anticipated that the applied load on the skirted footing would be resisted by the shear resistance mobilized along the skirt-soil interface, along with the shear strength of the sand. The bearing capacity of the skirted footing was denoted in terms of the BCR. Further, the reduction in settlement of the footing, due to the provision of the skirts, at a given pressure, was expressed in terms of settlement reduction factor. For the development of the models (ANN and MRA), for the prediction of the BCR and the SRF, the data from the literature on square and circular footings was collected. After the development of the models for regular-shaped skirted footings, the models were extended for the prediction of the BCR and the SRF of T, Plus, and double box shapes by means of simple multiplication factors. Finally, the ANN and MRA model predictions were compared to bring out the superiority of the ANN over the MRA model.
Test Results
Pressure settlement curve and Bearing capacity variation of footing with skirt depth
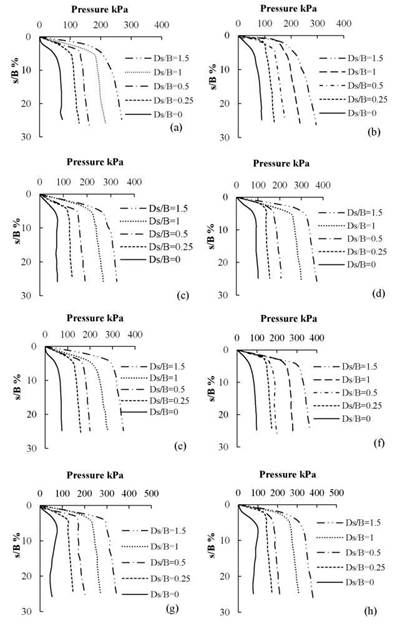
The pressure-settlement behavior of the footings (skirted and unskirted) with different plan shapes corresponding to a relative density of 30% is shown in Figure 4. It is pertinent to mention here that the ultimate bearing capacity was taken with respect to the minimum of the peak pressure or the pressure corresponding to an s/B ratio of 10% on the pressure settlement curve. The settlement ratio was used for the calculation of the settlement of the footing. Furthermore, if a clear peak in the pressure-settlement ratio curve was not obtained, the ultimate bearing capacity was calculated by using a double tangent method.
Source: Authors
Figure 4 Pressure settlement behavior for footings with partly rough (a, c, e, g) and rough (b, d, f, h) interfaces for square (a, b), plus (c, d), double box (e, f), T (g, h) corresponding to a relative density of 30%.
The results obtained in the current study related to the bearing capacity of the unskirted square footings (partly rough and completely rough) and were compared with the classical bearing capacity formula reported by Terzaghi (1943). To calculate the bearing capacity of the footing, the friction angle obtained from the triaxial test for different relative densities was used. This comparison is shown in Table 2.
Table 2 Comparison of bearing capacity values of the square footing with literature
| R d (%) | Present work | Terzaghi (1943) | |
|---|---|---|---|
| Partly rough | Rough | ||
| 30 | 65,50 | 73,30 | 40,68 |
| 40 | 120,39 | 153,24 | 45,09 |
| 50 | 158,53 | 207,81 | 53,73 |
| 60 | 228,31 | 268,93 | 91,09 |
Source: Authors
From this table, it can be seen that the observed bearing capacity in the present case was higher in comparison to the one obtained by using Terzaghi's formula in all circumstances. This is perhaps due to a higher mobilized friction in the test on account of the dilatancy of the sand, which is more significant at a low-stress level; and due to a slight localized densification of the sand nearby the footing given the applied load. The study of Figure 4 shows that, irrespective of the plan shape of the footing, the bearing capacity increases with the increase in skirt depth. The obtained bearing capacity for unskirted footings is shown in Table 3.
Table 3 Variation of bearing capacity with relative density for the different plan shape of footing
| 𝑹𝒅 (%) | Interface condition | Ultimate bearing capacity (kPa) | |||
|---|---|---|---|---|---|
| Square | Plus | Double box | T | ||
| 30 | Partly rough | 65,5 | 74,29 | 65,5 | 77,14 |
| Rough | 73,3 | 91,43 | 73,3 | 100 | |
| 40 | Partly rough | 120,39 | 128,57 | 120,39 | 131,43 |
| Rough | 153,24 | 160 | 153,24 | 165,71 | |
| 50 | Partly rough | 158,53 | 165,71 | 158,53 | 168,57 |
| Rough | 207,81 | 210,57 | 207,81 | 211,43 | |
| 60 | Partly rough | 228,31 | 231,43 | 228,31 | 234,29 |
| Rough | 268,93 | 270 | 268,93 | 271,42 | |
Source: Authors
A careful study of this table indicates that, for a given relative density, irrespective of the interface condition of the footing, T-shaped footings is provide the highest bearing capacity, followed by Plus, double box, and square shapes. The difference in the bearing capacity of the footing is quite substantial for the lower relative density, i.e., at Rd = 30%. It should be noted that, without any skirts, double box and square-shaped footings are both the same, hence the identical value of the bearing capacity.
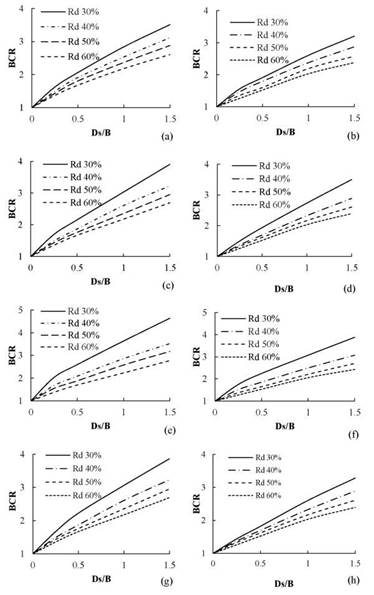
The variation of the bearing capacity of the skirted footing (expressed in the form of BCR) with the skirt depth for the different relative density considering various plan shapes is shown in Figure 5. In all cases, the BCR for the square and the multi-edge skirted footings increases with the increase in skirt depth. The BCR at a relative density of 30% for a partly rough footing with D s /B = 0,25 was observed to be 1,62, 1,67, 1,91, and 2,03 for square, T, plus shape, and double box shapes, respectively. When the D s /B increased to 1,5, the BCR increased to 3,51, 3,86, 4,43, and 4,64, respectively. For a given skirt depth, the BCR decreased with the increase in relative density.
Variation of SRF with skirt depth
The provision of the skirt along the periphery of the footing increased the bearing capacity and decreased the settlement below the footing. The settlement reduction in skirted footings was defined in a quantitative manner by using a settlement reduction factor:
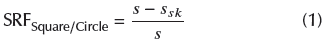
where, s and s sk are the settlement of the unskirted and skirted footings, respectively, corresponding to a given pressure σ.
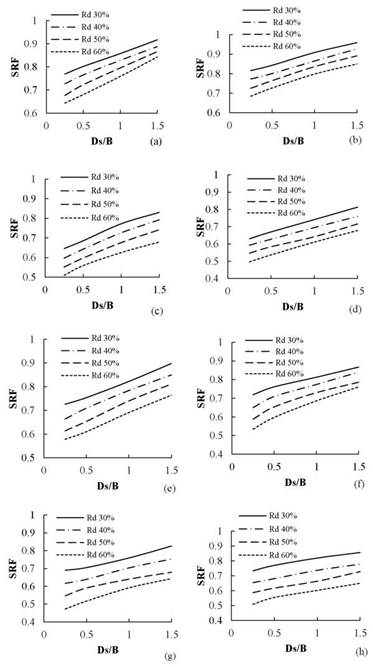
In the present study, the SRF was calculated at pressures of 25 kPa, 50 kPa, 100 kPa, and 200 kPa. Its variation with the skirt depth, for the different relative densities, at a pressure of 100 kPa, and for the various plan shape of the footing, is presented in Figure 6. As anticipated, for a given relative density, the SRF increased with the increase in skirt depth. In contrast, for the constant skirt depth value, the SRF decreased with the increase in relative density for all the plan-shaped footings. The considerable reduction in the settlement was obtained for the footing with a rough interface and at D s /B = 1,5 and R d = 30% as the SRF was observed to be 0,87, 0,83, 0,89, and 0,86 for square, Plus, double box, and T plan-shaped footings, respectively. This implies that, at a relative density of 30%, the reduction in the settlement due to the provision of the skirts could range between 80% and 90%, which is quite significant. Thus, skirted footings can be considered as an alternative ground improvement technique in loose sand wherein large settlements are often anticipated.
Artificial Neural Network
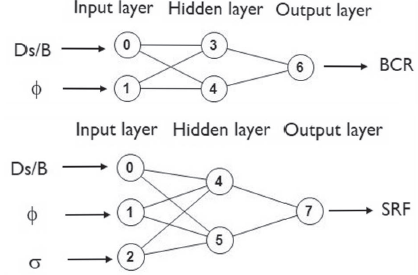
This work aims to model the neural network architecture to predict the bearing capacity ratio and settlement reduction factor for multi-edge footings on sand. However, considering the data availability on the bearing capacity and the settlement of the square and circular skirted footings in literature, an ANN model was first developed, which was applicable for these shapes. This model was later modified to suit the aim of this research. Generally, the bearing capacity of non-cohesive soil is dependent on the friction angle (Meyerhof, 1963; Vesic, 1973). In this study, along with the friction angle, skirt depth to width of the footing ratio was also used, since it is considered to affect the bearing capacity. Skirts play a significant role in improving the bearing capacity, as reported by some studies (Khatri, Debbarma, Dutta, and Mohanty, 2017; Khatri and Kumar, 2019). Regarding settlement prediction, normal stress was also plays a role, along with the friction angle and skirt depth (Al-Aghbari and Dutta, 2008; Al-Aghbari and Mohamedzein, 2018; Gnananandarao, Dutta, and Khatri, 2020). Hence, to predict BCR, the nondimensional skirt depth (D s /B) and friction angle (ф) were considered as input variables. In contrast, the prediction of SRF requires an additional input of pressure, along with the variables above.
The difficult job in the ANN model development is to determine the number of hidden layers and their neurons. The accuracy of the network model is dependent on the initially assigned weights and other associated parameters, as well as its architecture. However, until now, there is no defined technique to achieve the optimal architecture and parameter settings for an ANN model. Therefore, researchers have to follow the time-consuming trial and error approach. However, ANN have a disadvantage, such as being stuck in local minima and slow learning rates (Marto et al. 2014). Still, this technique is popular in Geotechnical applications.
Network Structure Preparation and Data Set Used
The performance of an artificial neural network entirely depends on its structure. The first step in its creation is to fix the number of hidden layers and hidden layer nodes. Generally, a rule of thumb has been adopted for choosing the hidden layer (one in this case) and the neurons in the hidden layer, which is 2/3 of the size of the input variables (Shahin, Maier, and Jaksa, 2002; Dutta etal. 2015b; Rezaeietal. 2016; Dutta, Rani, and Gnananandarao, 2018; Gnananandarao, Dutta, and Khatri, 2018). Considering this, the number of hidden layers and the hidden layer nodes were 1 and 2, respectively. The chosen ANN architecture for the prediction of the BCR and the SRF is shown in Figure 7.
The next difficult task is to fix the number of epochs. An excess number leads to overfitting of the data, whereas a low number leads to poor prediction. The statistical parameter (mean square error) was calculated between the actual and the predicted value corresponding to different epochs. The lowest mean squared error corresponding to an epoch is chosen to develop the neural network model. Byfollowing the procedure above, 100 and 450 were selected as the number of epochs for the BCR and the SRF, respectively. Finally, in this study, 2-2-1 and 3-2-1 structures for developing the ANN model were chosen for the BCR and the SRF, respectively. A total of 43 and 131 model experimental data points were collected from the literature (Prasanth and Kumar, 2017; Momeni etal. 2015a; Al-Aghbari, 2002; Al-Aghbari, 2007; Eid, Alansari, Odeh, Nasr, and Sadek, 2009) to predict these parameters in regular shaped skirted footings (square and circular).
Furthermore, an additional 94 and 266 data points were collected from the author's experimental work reported elsewhere (Gnananandarao, Khatri, and Dutta, 2018). Hence the total data points used for modeling were 137 and 397 for the BCR and the SRF, respectively. The data for the other regular shaped footings (rectangular and strip) were excluded due to scarcity in the literature. The range of the various input parameters for which the developed model is applicable is also presented in Table 4.
Table 4 Details of parameters used in ANN and regression models for BCR and SRF
| Parameters | Minimum value | Maximum value |
|---|---|---|
| The angle of internal friction (σ) (Deg.) | 32,50 | 42,9 |
| Skirt depth to width of the footing ratios (D s IB) | 0 | 2 |
| Bearing capacity of the skirted footing to bearing capacity of unskirted footing ratio (BCR) | 1 | 7,8 |
| Normal stress (σ) (kPa) | 25 | 200 |
| Settlement of skirted footing to settlement of unskirted footing ratio (SRF) | 0,06 | 1 |
Source: Authors
To check the generalization capability of the model, about 70% and 30% of the data from the total data were respectively selected randomly for training and testing purposes. After its development, the model for these regular-shaped skirted footings was modified to account for the shape of multi-edge skirted footings with the introduction of multiplication factors. These factors were obtained by dividing the BCR/SRF of multi-edge footings with those of the predicted BCR/SRF in regular-shaped footings from the model. The multiplication factor for the BCR and the SRF was termed as F mbcr and F msrf, respectively. A total of 120 and 450 data on the BCR and the SRF of T, Plus, and double-box-shaped skirted footings were taken from the present experimentation. These data points were used to calculate the average multiplication factors to predict the BCR and the SRF of multi-edge skirted footings.
Activation Function Selection, Performance Measure, and Sensitivity Analysis
Artificial neural networks make use of various activation functions to create a relationship between the input and the output variables at each neuron layer. These functions are generally mathematical expressions and are used to produce the outputs. The different activation functions used were linear, threshold, threshold symmetric, sigmoid, sigmoid stepwise, sigmoid symmetric, sigmoid symmetric stepwise, gaussian, gaussian symmetric, gaussian stepwise, elliot, elliot symmetric, linear piece, linear piece symmetric, sin symmetric, cos symmetric, sin, and cos. All of these are available in the open-source Agiel neural network software. To choose the best activation function among these 18 functions, a comparison was made with various performance measures such as the coefficient of determination (R2), variance account for (VAF), mean square error (MSE), root mean square error (RMSE), mean absolute error (MAE), and mean absolute percentage error (MAPE).
The predictive models with an R2 of 1, VAF of 100%, and MSE, RMSE, and MAE of zero indicate a perfect model (Hajihassani, Abdullah, Asteris, and Armaghani, 2019; Huang, Asteris, Koopialipoor, Armaghani, and Tahir, 2019; Xu, Zhou, Asteris, Armaghani, and Tahir, 2019). The mathematical formulas for these performance measures (reported by Dutta et al. 2015b; Dutta et al. 2018; Gnananandarao et al. 2019) are provided in Table 5 for the BCR. In the same table, the performance measures for the SRF can be written just by replacing the BCR with the SRF. Based on the best statistical results, sigmoid symmetric and sigmoid were selected as the activation functions for the BCR and the SRF, respectively. The performance measures for these functions in the training and testing phase are shown in Table 6.
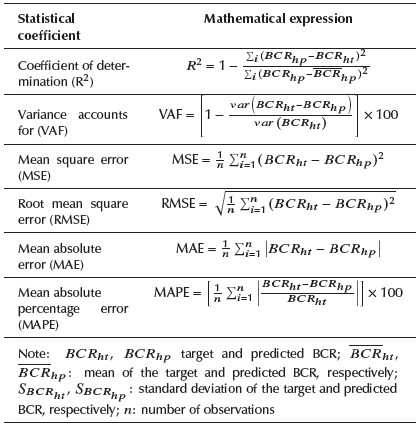
Table 6 Performance measures for the training and testing of data for BCR and SRF for the best activation function
| Parameter | Training | Testing | ||
|---|---|---|---|---|
| BCR | SRF | BCR | SRF | |
| Activation function | Sigmoid symmetric | Sigmoid | Sigmoid Symmetric | Sigmoid |
| R2 | 0,96 | 0,91 | 0,94 | 0,93 |
| VAF (%) | 91,21 | 87,62 | 92,84 | 89,28 |
| MSE | 0,30 | 0,01 | 0,36 | 0,01 |
| RMSE | 0,55 | 0,09 | 0,60 | 0,09 |
| MAE | 0,36 | 0,07 | 0,42 | 0,06 |
| MAPE | 15,97 | 19,25 | 17,61 | 18,90 |
Source: Authors
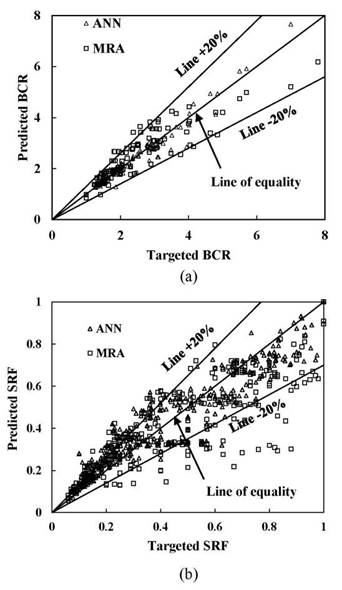
The next important step is to choose a learning rate that analyses the performance of the activation function both for the training and the testing datasets after fixing the optimal epochs. The learning rate is vital for understanding any neural network structure, as it explains the influence of the errors on the hidden weights and biases. If the learning rate is low, the values will take a longer time to converge; otherwise, the model may be overfit to the target value. Thus, a default value of 0,7 was considered in this study. After getting the predicted BCR and the SRF of the regular shaped footings, using the procedure mentioned above, the next step was to check the accuracy of the predicted parameters regarding the target values. It was achieved after minimizing the errors. The comparison of predicted and the target BCR and the SRF values during training and testing step is shown in Figure 8a and b, respectively. This figure indicates that the coefficient of determination ranges between 0,91 and 0,96, which implies a good fit.
Furthermore, the sensitivity analysis was performed to know the direct or the indirect relation between the input and the output parameter saccording to the method used by Erzin and Gul (2014). The connection weights and biases obtained in the neural network were examined to understand the relative importance of the input and output parameters.
Source: Authors
Figure 8 Plot of predicted versus targeted (a) BCR (b) SRF values using ANN for training and testing.
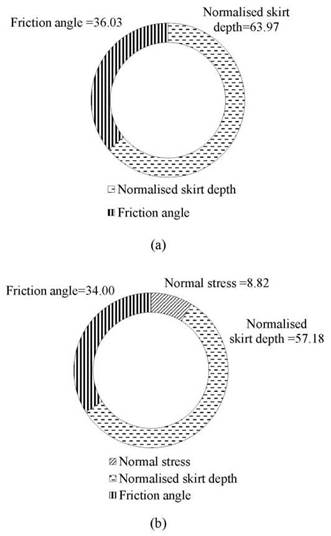
The result of the sensitivity analysis is presented in Figure 9, which suggests that for the prediction of the BCR as well as SRF, the input variable D s /B affects the most that is about 64% and 57%, respectively.
Comparison with multivariable regression analysis
In the present study, apart from the development of ANN models, additional multivariable regression analyses were carried out to develop expressions for the predictions of the BCR and the SRF. The forecasts from these expressions were compared with ANN predictions. On similar lines with the ANN models, the MRA was first performed on the data related to regular shaped footings, and later, the developed expressions were modified for prediction of the BCR and the SRF of multi-edge footings with the introduction of multiplication factors such as Fmbcr and Fmsrf. To decide the form of the expression, the BCR of the skirted footing was compared with the ratio of the bearing capacity of the embedded footing to the surface footing:
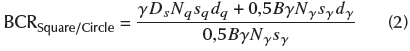
therefore,

where, s q - s γ - shape factors, and d q - d γ - depth factors, according to Meyerhof's bearing capacity theory (1951,1963).
A careful study of Equation (3) suggests that the form of the expression for the regression analysis can be chosen as
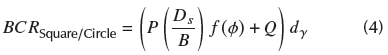
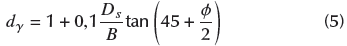
In the expression above, P and Q are constants that will be obtained through regression analysis, since the N q /N γ ratio is dependent on the friction angle, which is replaced with the function of 𝜙 i.e. f(𝜙). The depth factor d γ is determined as follows:
In the present study, the non-linear regression analysis was carried out by using the Datafit software, version 9,1 (trial version). The final equation after regression analysis for the prediction of the BCR is:
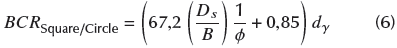
Finally, the BCR of the multi-edge skirted footing can be related to the BCR given by Equation (6) as:

where F mbcr can be calculated by a procedure similar to the one described in the previous sections. The SRF equation for the regular shaped footing was obtained after the regression analysis as:

Furthermore, the SRF of multi-edge footings is related regular shaped footings as:

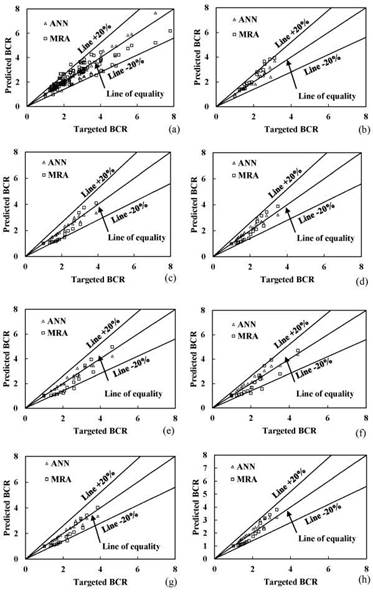
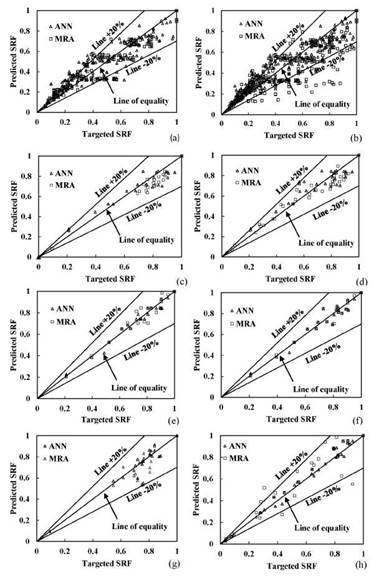
The R2 for Equations (6) and (8) is about 0,87 and 0,84, respectively, which is acceptable. A comparison between the BCR and the SRF predictions for the square and the multi-edge footings with partly rough and completely rough interfaces obtained from the regression analysis and the ANN is shown in Figures 10 and 11, respectively. These figures indicate that the predicted BCR and SRF are almost within the ±20% of the line of equality. The R2 ranges between 0,940 and 0,977 for the ANN model and 0,827 and 0,934 for the regression analysis. Furthermore, the study of Figure 11 suggests that the R2 for the SRF prediction may lie between 0,913 and 0,985 for the ANN model and 0,739 and 0,932 for the regression analysis. A comparison of Fmbcr and Fmsrf obtained from the ANN and the regression analysis for the parameters in question is provided in Table 7. It is quite noteworthy that these factors are comparable, even though they were obtained with different methodologies.
Source: Authors
Figure 10 Comparison of ANN with MRA models after the prediction of BCR for partly rough (a, c, e, g) and rough (b, d, f, h) interfaces of square (a, b), plus (c, d), double box (e, f), T (g, h) plan shapes.
Source: Authors
Figure 11 Comparison of ANN model with MRA after the prediction of SRF for partly rough (a, c, e, g) and rough (b, d, f, h) interfaces of square (a, b), plus (c, d), double box (e, f), T (g, h) footings.
Table 7 Multiplication factors Fmbcr and Fmsrf for prediction of BCR and SRF for multi-edge footings in ANN and regression models
| Plan shape of footing | Multiplication factor (F mbcr and F msrf ) | |||
|---|---|---|---|---|
| Artificial neural networks | Regression Analysis | |||
| BCR | SRF | BCR | SRF | |
| Plus | 1,03 | 0,98 | 1,02 | 0,99 |
| Double box | 1,11 | 0,89 | 1,09 | 0,92 |
| T | 1,04 | 0,97 | 1,03 | 0,98 |
Source: Authors
Equation for the BCR and the SRF from ANN
The goal of the present study was to develop an equation for the reliable prediction of the BCR and the SRF of the regular shaped and multi-edge skirted footings. From the comparison of the predictions obtained with the ANN and the regression analyses, it is quite clear that ANN predictions were always superior. Therefore, the equations for predicting the BCR and the SRF are also presented here.
The ANN model was developed with the optimum number of epochs (100) using the open-source Agiel software to obtain the weights and the biases introduced between the hidden layer and the output layer. The generalized function of the ANN model for the output (BCR) of the regular shaped skirted footing is defined by Equation 10:

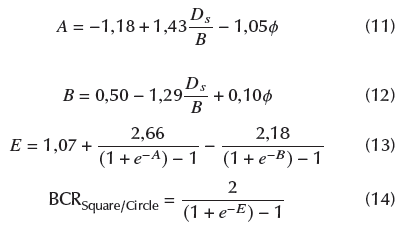
The BCRSquare/circle resulting from Equation 14 is between - 1 and 1 for the activation function (sigmoid symmetric). Hence, there is a need for the denormalization of the output to get the actual value. The denormalized equation is as follows:
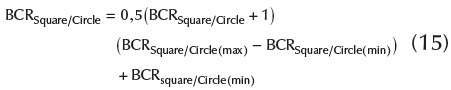
where BCRSquare/Circle(max) and BCRSquare.Circle(min) are the maximum and the minimum predicted bearing capacity ratios of regular shaped skirted footings, respectively.
The BCR of multi-edge footings can be obtained by following Equation (7), which was defined earlier. On similar lines with the BCR, the SRF can be predicted by following Equations 16-19 as given below:
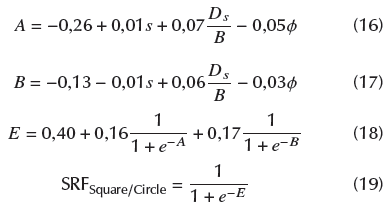
The SRFSquare/Circle predicted by Equation (19) ranged between -1 and 1 for the activation function (sigmoid symmetric). Hence, there is a need for the denormalization of output (SRF) to get the actual value. The denormalized equation (20) is shown below:
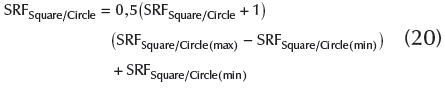
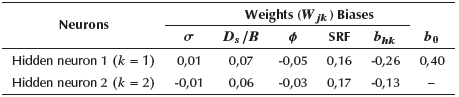
Where SRFSquare/Circle(max) and SRF Square/Circle(min) are the maximum and the minimum predicted settlement reduction factors of regular shaped skirted footings. Furthermore, the SRF of multi-edge footings is obtained following Equation (9) and Table 7. The weights and biases between the hidden layer neurons with input and the output nodes for the BCRSquare/Circle and the SRFSquare/Circle prediction are provided in Tables 8 and 9, respectively.
Table 8 Weights and biases between hidden layer neurons with input and output nodes for BCR prediction
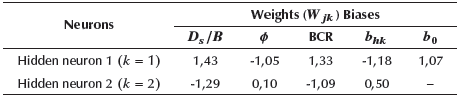
Source: Authors
Conclusions
The study carried out in this work showed the feasibility of using a simple ANN and multivariable regression analysis to predict the bearing capacity ratio and settlement reduction factor of multi-edge skirted footings resting on sand. Based on the obtained results, the following conclusions can be drawn:
For a given relative density, the non-dimensional bearing capacity of square/circular and multi-edge footings was defined in terms of BCR increases with an increase in depth of the skirt. The BCR of multi-edge footings was marginally higher than that of its square/circular counterpart, which is desirable.
For a given constant pressure, the reduction in settlement of skirted footings, expressed in the form of SRF, increased with the increase in skirt depth. However, contrary to the observation of BCR, the SRF of multi-edge footings was marginally smaller in comparison to regular-shaped skirted footings.
The BCR and SRF predicted by using ANN or regression analyses are in agreement with experimental values, although ANN provides superior predictions in all cases.
The developed equations can be used to predict the BCR and SRF of partly rough and completely rough skirted footings as the predictions are not much affected by interface roughness.
It is anticipated that the outcome of this study will help in emphasizing the use of multi-edge skirted footings wherever possible. Furthermore, the developed equations can be used to predict the bearing capacity and reduction in settlement of such footings at a given pressure without conducting the field tests. Neural network models, in general, cannot provide reasons and reasoning beyond the model (black boxes) thus obtained; once a network knows one set of weights, any new learning results in disastrous forgetting. The suitability of alternative techniques such as vector supporting machines, particle swarm optimization, or genetic programming may also be explored in the future.

