


 English (pdf)
 Article in xml format
 Article references
 Send this article by e-mail
 Cited by SciELO
  Cited by Google
  Similars in
SciELO
Similars in
SciELO  Similars in Google
 Permalink
Introduction
Within the agroindustry, there are crucial goals such as quality, which must respond to the growing demands of the consumer. The development of new products and agroindustrial processes results from the interaction of men, materials, and equipment, which should establish an organized system that enables the maximization of benefits (Prieto, Mouwen, López Puente, and Cerdeño Sánchez, 2008). In this sense, process design or redesign in this type of industry acquires a special importance, since it is possible to obtain the best combination of this interaction and achieve maximum economy at work (Espinel-Ríos and Ruiz-Espinoza, 2019; Pérez-Martínez et al., 2012). During process design, there is a cycle of activities that goes from the generation of alternative solutions to their corresponding analysis and the selection of the optimal alternative.
The non-centrifugal cane sugar industry has a great importance in developing countries because it is a livelihood for many families, due to its local and artisan production. Currently, many companies wish to expand the commercialization of their products without making large investments. There is an interest from many producers in achieving a stable quality in this process and its by-products (Velásquez, Espitia, Mendieta, Escobar, and Rodríguez, 2019). Reaching this technological goal paramount today because this type of product is being revalued in European markets for its nutritional value (Belitz, Grosch, and Schieberle, 2004; Jaffé, 2012; Lee et al., 2018).
In this problematic situation, there are cases of isolated studies in the literature where models and simulations of the non-centrifugal cane sugar manufacturing processes are applied. These are regarded as an alternative for process analysis and with an economic analysis. Theoretical results are also obtained, which helps decision making. However, they have focused primarily on energy efficiency and equipment redesign for non-centrifugal cane sugar production (López and Zuluaga, 2014; Restrepo, Flórez, and Tibaquirá, 2017). In the current literature, the use of these methodologies in the cane honey production process and its quality is little mentioned.
One of the main advantages of mathematical modeling is that shorter execution times are required, and it is cheaper than project execution, thus allowing to reduce the risks that could occur in real situations, as well as to quickly identify the expectations (Molina-Mora, 2017). On the other hand, simulation in the agro-industrial field is used today to predict the results of a process, which gives an answer to the phenomena that occur in it. In such a way, it allows to anticipate the operation of a modified or new process, knowing whether or not it will be viable (Bildea, Dimian, and Kiss, 2014).
Process simulation has been a widely used tool in process design, with or without taking uncertainty into account (Washington and Swartz, 2014). Uncertainty is considered a property from a collection of expectations, judgments about possible outcomes for a future event (Hansen and Pearce, 2014). Natural and technological systems usually face uncertainty (Cerda Mejía, Pérez-Martínez, González-Suárez, and Concepción Toledo, 2018; Rabassa-Olazábal, Eduardo-Guerra, Pérez-Sánchez, González-Suárez, and Pérez-Martínez, 2016; Sahinidis, 2004). Product and process design is notfreefrom it (Bortzetal., 2017; Steimel and Engell, 2016). Due to the empirical and semi-empirical conditions in the production of non-centrifugal cane sugar and its derivatives such as honey this process is subject to uncertainty.
Therefore, there is a need to study it in product and process design (design and operational parameters), as well as in quality (Rincón Arévalo, 2005). Thereupon, it is evident that uncertainty plays a very important role in the process of ensuring that a product meets certain quality specifications. For this purpose, it must be checked whether or not the analytical result is within a "tolerance" range of values defined in the specifications (Lawless and Heymann, 2010; Maroto, Boqué, Riu, and Rius, 2001).
In the uncertainty analysis during the production of cane honey, there should first be a focus on the raw material, because it can be affected by several factors, which cause variability in the Brix degrees and the pH, these being the main quality attributes for the elaboration of honey. The quality of the final product depends on the initial conditions of the raw material and the operational parameters. Some of the main factors that affect the quality of the cane are variety, cutting age, and cultural practices (Castro, Prado, Paladines, and Cervantes, 2017). Other authors describe that the uncertainty related to the operational parameters is present in temperature, pressure, and flow. Variations in temperature can be experienced during the energy supply stages (evaporation), and pressure variation could occur if vacuum evaporators are used (Espitia, Velásquez, López, Escobar, and Rodríguez, 2020; González Cortés, Pedraza Gárciga, Clavelo Sierra, and González Suárez, 2015).
As mentioned above, quality is a parameter of the product and the process that has a great variability. The quality of food products in the production of non-centrifugal cane sugar and other products of this process (cane honey), is still limited and little documented. Some factors hinder the quality and risk management of the processing, safety, and traceability of food products (Silva, Silva, Perestrelo, Nunes, and Câmara, 2017). However, some references could contribute to promoting the quality of the process and the product, such as the Quality by Design (QbD) approach, which has been applied with good results in the pharmaceutical industry. It is supported by the Design of Experiment (DoE), which allows the operational parameters to be correlated with the quality attributes (Oliva, Fariña, and Llabrés, 2013; Orlandini, Pinzauti, and Furlanetto, 2013; Pasquini etal., 2016; Tol, Kadam, Raotole, Desai, and Samanta, 2016). Along with these emerging approaches, there have been other studies that use artificial intelligence to achieve the same goals (Herwig, Garcia-Aponte, Golabgir, and Rathore, 2015; Uraikul, Chan, and Tontiwachwuthikul, 2007; Zhai, Xuan, Fan, Zhao, and Jiang, 2018).
In the agroindustrial processes and process design, the determining role of quality as an early stage of the process design and its consideration as a parameter, it is little documented (Phadkeand Dehnad, 1988). An example of this is the process design carried out for products derived from the sugar industry, where the technological scheme is sometimes established from the experimental data, without holistically considering economic, environmental, technological, and transversal quality aspects (Aguilar-Rivera, Galindo, Fortanelli, and Contreras, 2009; Rabassa-Olazábal et al., 2016; Rabassa Olazábal, González Suárez, Pérez Sánchez, Miño Valdés, and Pérez Martínez, 2015). Moreover, the use of simulations is incipient, as well as the emerging sequential procedures that contemplate it (Yu and Kopcha, 2017).
Current research takes the production of sugarcane honey into consideration, where organoleptic aspects such as viscosity, flavor, and the possible presence of crystals (considered this as a defect) have a significant importance in the quality parameters of the sensory analysis, performed by the consumer, who identifies and personalizes sugarcane honey. Determination of these sensory parameters implies a certain degree of uncertainty because they are subjective.
In previous experimental investigations, a range of operational parameters caused a great variability in the sensory quality attributes of sugarcane honey (Quezada Moreno, González-Suárez, Quezada Torres, and Mera, 2016). Based on this case study, the aim of this research is to increase the acceptability of quality attributes (sensory) through simulation methodologies, and thus reduce uncertainty in operational parameters, as part of the process design to obtain sugarcane honey.
Materials and Methods
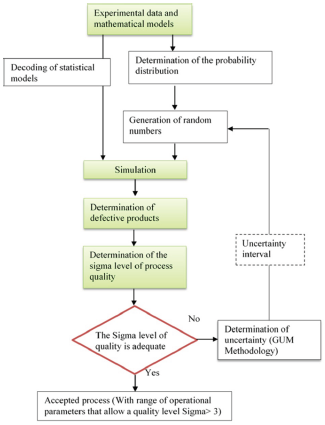
Excel macro was the tool used to implement a procedure to increase acceptability. It followed these general steps (Figure 1): 1) Determination (or analysis) of experimental data and mathematical models, 2) Simulation, 3) Determination of the number of defective products, 4) Determination of the Sigma quality level of the process, 5) Determination of the uncertainty (GUM Methodology). Case study was based on the data and models obtained in the research published by Quezada Moreno et al. (2016). The analyzed randomized batches were 10, 120, and 1560. These quantities are in accordance with the production that takes place in the Amazon Region of Ecuador for one day, one month, and one year.
Experimental data and mathematical models that correlate the operational parameters and final product quality
Operational parameters (pH and Brix degrees) were considered as independent variables and sensory quality attributes (taste, viscosity, and presence of crystals) as dependent variables. The correlation between sensory and operational parameters was taken from Quezada Moreno et al. (2016) in the form of statistical models. The variability of the dependent variables was determined considering the following statistical parameters as ranges: standard deviation and the mean absolute deviation (MAD) (Anderson, Sweeney, and William, 2014).
Simulation
For the simulation:
a) The probability distribution of the experimental data was determined considering the best goodness of fit, by means of the software Arena 7.01.
b) Random numbers were generated from the previous probability distribution, using Microsoft Excel. The ranges used in the first iteration for this case study were obtained by Quezada Moreno et al. (2016), and, for subsequent iterations, they were determined using the GUM methodology (Pérez Hernández, 2012). The number of generated random samples was established according to production for a day, month, and year considering the mass balances.
c) Statistical models were decoded using STATISTIC software version 8,0.
The mathematical models and the obtained random numbers allowed us to calculate the new values of quality attributes such as flavor, viscosity, and the presence of crystals.
Determination of the number of defective products
From the attribute specifications of product quality (dependent variables) obtained from the simulation, defects per unit (DPU) and the percentage of defective products were determined. DPU refers to the quality attribute specifications that were not fulfilled. In this case study, values below six were considered defective in the sensory evaluation scalar test for each sensory attribute, where according to Avila-de Hernández, González-Torrivilla (2011), and Hernandez Alarcon (2005), the control scale test in the sensory evaluation panels establishes a rating of six for "I like it a little", and 10 for "I like it a lot".
Determination of sigma quality level of the process
Sigma quality level of a process (Eq. 1) is calculated for each production based on its DPU with Equation (1), proposed by Abdelhamid (2003).
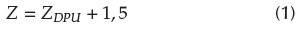
Where Z is the sigma quality level and Z DPU is the standard normal distribution corresponding to the DPU.
Other Sigma level metrics were also determined according to what was proposed by Keller (2011) and Pyzdek (2003).
a) Defects per million opportunities (DPMO) (Equation 2):
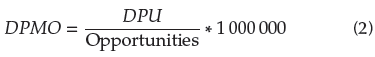
Where Opportunities is the value of the productions.
b) Yield (Yd) (Equation 3):

Analysis of the Six-Sigma quality level of the process
In each iteration, it was analyzed whether at least the Three-Sigma quality of the process was reached, as recommended by Alderete, Colombo, Di Stéfano, and Wade (2003). This value is equivalent to a 93,32% acceptance of the total products (Table 1). Methodologically, this is a step in decision making, where Sigma level is reached or exceeded. Moreover, no further iterations were carried out following the procedure of Figure 1.
Determination of uncertainty by the GUM methodology
In each iteration, the uncertainty of the operational parameters was determined through a modified GUM methodology (Pérez Hernández, 2012) in order to reduce the range of operational parameters until achieving greater acceptability of the quality attributes corresponding to a Sigma level greater than or equal to three. The steps were the following:
Mathematically expressing the relationship between the measurand (Y) input quantities (x i).
Determining the estimated value of the input quantities (xi) from the statistical analysis of a series of observations.
Evaluating the standard uncertainty of the input quantities (u(x;)), where the evaluation should be type A or B.
Determining the combined standard uncertainty (uc(y)) for the measurand, the uncertainty for the input quantity, and covariances associated with input estimates.
Determining the value of the expanded uncertainty (Up) to provide an interval (y - Up, y + Up) where Up = u c (y) * kp and kp = 1 (Coverage factor).
Quantification of the economic benefit
The mass balances were proposed for sugarcane honey production to determine product quantity for each batch. This allowed quantifying and comparing income based on the accepted products. To this effect, referential market sale prices published in Ecuador were used.
Results and discussion
Experimental data and mathematical models that correlate the operational parameters and final product quality
It is known that some of the distinctive characteristics of agro-industries are the variability in the quantity and quality of raw materials. The amount is uncertain due to climatic changes or damage to crops or diseases. Quality varies because standardization of raw materials is still difficult to achieve, which contrasts with the specifications defined for standard materials used in the manufacture of other industries. These variations greatly influence the design and quality control of an agro-industrial plant (Austin, 1984).
The statistical behaviour of the sensory attributes of sugarcane honey is shown in Table 2. The range and mean absolute deviation for the three quality attributes demonstrate the great variability of each of the attributes obtained experimentally in previous studies. For the three attributes, the minimum and maximum values are distant, which results in range above seven. They are also at the extreme values of the hedonic scale used by Quezada Moreno et al. (2016). High MAD values represent the variability of the data and, therefore, of a greater dispersion of experimental values (Pérez, Aldana, and Arguello, 2016). Consequently, the new predicted values by the theoretical models will also show variability (Quispe and Purca, 2007).
Table 2 Statistics of the quality attributes of sugarcane honey based on data from Quezada Moreno et al. (2016)
| Statisticians | Sensory attributes (dependent variables) | ||
|---|---|---|---|
| Viscosity | Flavor | Presence of crystals | |
| Mean | 4,2900 | 6,4800 | 6,4300 |
| Standard deviation | 3,9300 | 3,3900 | 3,1900 |
| Range | 8,9000 | 7,3000 | 8,1000 |
| MAD | 3,3900 | 3,0100 | 2,6700 |
| Minimum | 0,7000 | 1,9000 | 1,2000 |
| Maximum | 9,6000 | 9,2000 | 9,3000 |
Source: Authors
The pH values and Brix degrees are adjusted to a Beta distribution, which is a continuous probability distribution with two parameters α and β(Table 3). From this information, it is possible to generate the new random numbers.
Table 3 Parameters of the Beta distribution
| Parameters | Operational parameters (independent variables) | |
|---|---|---|
| pH | Brix degrees | |
| Superior value | 3,5000 | 74,0000 |
| Lower value | 4,5000 | 78,0000 |
| Alpha | 0,8030 | 0,8800 |
| Beta | 0,8010 | 0,9100 |
Source: Authors
Mathematical models for each of the response parameters are shown in Equations (4) and (6). Decoding allows to simulate directly with the experimental values or new generated values (for the first and second iteration in this case study). This new form of modelling is advantageous when compared to the statistical models provided by Quezada Moreno et al. (2016), due to the simplicity of the calculations when performing the simulations and subsequent analysis.
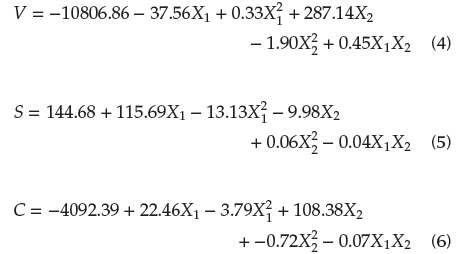
Where V (Viscosity), S (Taste), C (Presence of crystals), and X1 (pH), X2 (Brix degrees).
Simulation results
The case study was simulated for a production capacity of 10 batches per day (A). Moreover, it was studied for a one-month production of 120 batches (B) and another one-year production of 1 560 batches (C), which have a frequency of three times per week of production capacity correspondent to Ecuadorian Amazon Region production. This type of production is different from other regions of Ecuador, mainly in the main sugar mills, whose harvest begins in July and ends in December. Sugar production occurs throughout the year, working six days a week, and the harvest period is not carried out between January and February.
The analysis for the first iteration was performed following the procedure in Figure 1 with 10, 120, and 1560 random numbers in correspondence with these productions. When analyzing the product quality specifications according to sensory attributes (Figure 2), there is a tendency to increase the quantity of defective products as production increases, for the three sensory quality attributes. The percentage of defective products for productions A, B, and C was 30,00%, 50,83%, and 52,63%, respectively. If this research is considered to have been carried out in the context of process design, this trend is not desirable, since income would decrease.
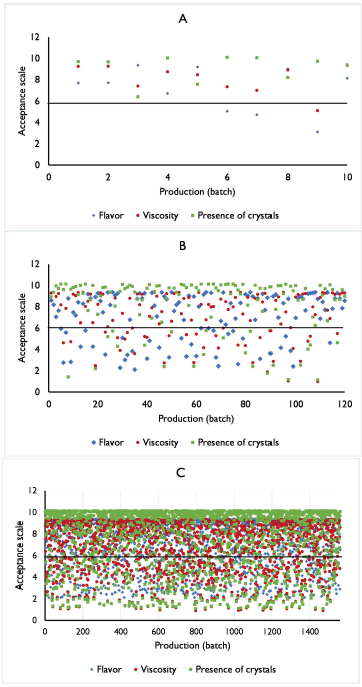
Source: Authors
Figure 2 Simulation of the quality attributes for the first iteration. (A) Production for 10 batch; (B) Production for 120 batch; (C) Production for 1 560 batch.
According to the previous considerations, in the present case study, performing new iterations to reduce uncertainty and the number of defective products based on the defined quality attributes is suggested, as well as determining the best product acceptability range.
The number of defective products of the second iteration (Figure 3) is still around 10% for production A. However, in productions B and C, a 0% in defects was achieved when compared with the results obtained in the first iteration. The range of operational parameters for each production was measured until the number of defectives reached the desired Sigma Level value of 3 (Table 1), thus demonstrating the effectiveness of the proposed methodology (Figure 1).
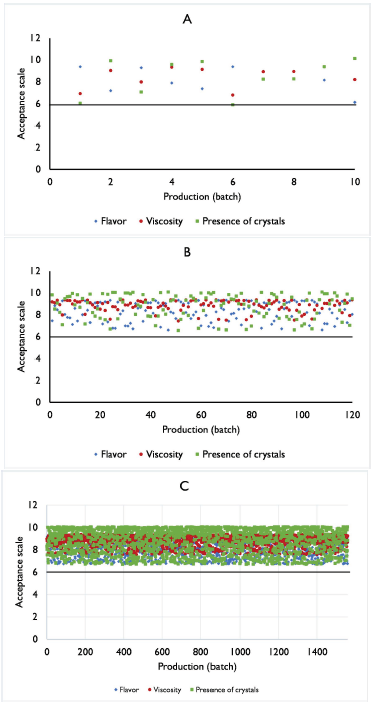
Source: Authors
Figure 3 Simulation of the quality attributes for the second iteration. (A) Production for 10 batch; (B) Production for 120 batch; (C) Production for 1560 batch.
The simulation was performed until the third iteration for production A, where defective products were not obtained (Figure 4). The GUM methodology allowed to reduce the range of operational parameters (pH and Brix degrees), and the decrease in the number of defective products was obtained as the production increased.
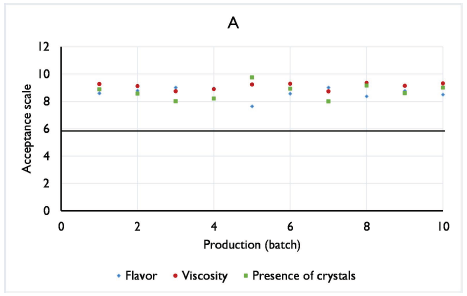
Source: Authors
Figure 4 Simulation of the quality attributes for the third iteration for production A.
Determination and analysis of the Six-Sigma quality level of the process
Sigma level for A, B and C productions in the first iteration corresponded to 1, where the yield (% of products accepted) was in a range between 47,37 and 70,00, and a Sigma value of less than 3 (Table 4). As a restriction, it is necessary to reach at least 93,3% of yield, as has been proposed (Gutierrez Pulido and de la Vara Salazar, 2013), thus achieving the Sigma 3 level and concluding the simulation. The equivalent 93,32% of the historical standard is equivalent to almost 67 000 defects per million opportunities (Alderete et al., 2003; Allen, 2019; Laureani and Antony, 2019). By consensus, companies have accepted Sigma 3 or Sigma 4 as standard (99,38% is the current standard, equivalent to almost 6 250 defects per million opportunities).
Table 4 Sigma level of the process for different productions
| Parameters | Iteration 1 | Iteration 2 | Iteration 3 | ||||
|---|---|---|---|---|---|---|---|
| Prod. A | Prod. B | Prod. C | Prod. A | Prod. B | Prod. C | Prod. A | |
| Total accepted | 7,00 | 59,00 | 739,00 | 9,00 | 120,00 | 1560,00 | 10,00 |
| Total rejected | 3,00 | 61,00 | 821,00 | 1,00 | 0,00 | 0,00 | 0,00 |
| Yield (%) | 70,00 | 49,17 | 47,37 | 90,00 | 100,00 | 100,00 | 100,00 |
| Sigma level | 2,02 | 1,48 | 1,43 | 2,78 | >6,00 | >6,00 | >6,00 |
Source: Authors
In subsequent simulations (iterations 2 and 3) of production A, it was possible to estimate a Sigma level of 2,78 for the second iteration, and higher than Six-Sigma in the third. After the third iteration, Six Sigma was reached, where the yield is close to 100%. This means that all products meet the organoleptic quality specifications. Productions B and C have better performance since the desired Sigma level is reached from the second iteration. Reaching Six Sigma, it is equivalent to having less than four defects for every million opportunities (99,99966%), which means a higher quality level (Alderete et al., 2003; Allen, 2019; Laureani and Antony, 2019).
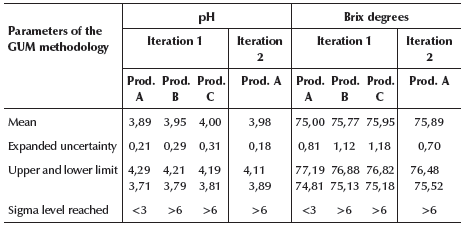
Determination of uncertainty by the GUM methodology
The reduction in uncertaninty is achieved for each of the operational parameters (Table 5). The initial pH range was 3,54,5, and the Brix degrees were 74,0-78,0, which characterizes the experimental sample (Table 3). The GUM methodology makes it possible to reduce the range of each operational parameter in each of the iterations, but decision-making should take into account whether the desired Sigma level has been reached. For example, in the case of production A, iteration continues until the Sigma 3 level is reached. This quality level is reached in iteration 2 for a pH range of 3,894,11 and Brix degrees of 75,52-76,48. The range suggested for process design of these operational parameters correspondz to production B, where the pH should be between 3,79-4,21 and the Brix degrees at 75,13-76,88. This selection is based on the fact that the range of the operating parameters for the rest of the studied production variants (A and C) are included in the selected range of production B.
The implemented range should not only include criteria of the Sigma level but also of the technological level, which should be available for its implementation and control. It should also be taken into consideration that, for this type of analysis (sensory), potential consumers constitute an important decision factor when a new product is to be introduced in the market. Therefore, food quality is a set of properties and characteristics that confer the ability to fulfill some implicit needs expressed by the consumer, but whose evaluation in any of its categories, including the sensory, is not free of errors (uncertainty).
During food product design, some of the quality specifications should come from an adequate sensory analysis. Due to, it influences in the different stages not only of the design but also of its manufacture, maintenance, improvement, and optimization, as well as the evaluation of the potential market (Moskowitz, Beckley, and Resurreccion, 2012). For this reason, sensory evaluation is regarded today as a scientific discipline, which is used to measure, analyze, and interpret reactions to some characteristics of food and materials. In the food industry, the compounds are perceived by the senses (sight, smell, taste, touch, and hearing), which, as a whole, constitute food quality, together with microbiological, nutritional, and toxicological aspects (Lawless and Heymann, 2010; Stone, 2018; Stone and Sidel, 2004).
In this process, the upper and lower limits for each operational parameter are very close. Therefore, for subsequent stages should evaluate the implementation of an automatic control system, which can keep these parameters within calculated theoretical ranges. Regarding the implementation of these results at the local level, it should be considered that the production carried out in Pastaza is artisanal and with technological backwardness, so this would not be feasible under current conditions.
The presented and validated methodological proposal provides an alternative to reduce the variability in quality in process design. By incorporating the GUM methodology as a tool for this purpose, it is also possible to reduce the systematic errors that may be present during the simulation. These errors are dependent on the selected model and error propagation at the time of the simulation. Although the GUM methodology has been proposed to be applied in other fields of quality, the advantages with respect to its easy implementation make it possible to suggest it in the design of processes. Its use becomes more important when quality and its variability are taken into account within a holistic context of analysis. The mentioned advantages allow recommending its use and validating it in other case studies of agro-industrial process design.
Systematic approaches such as QbD, which begins with predefined objectives and emphasizes the understanding of the design and control of products and processes, as well as the prediction of quality risk, should also be taken into account for future research (Yu, 2008; Yu and Kopcha, 2017). The rigor and advances in process design in the pharmaceutical industry allow us to extrapolate some concepts to agro-industries. We suggest identifying the characteristics that are critical to quality from the consumer's perspective, and translate them into the attributes that the agro-industrial product must possess, in addition to establishing how the critical parameters of the process can be varied to consistently produce an agro-industrial product with desired characteristics. This will allow to implement a flexible and robust manufacturing process that can adapt and produce a consistent product over time.
Some of the reference QbD elements (Yu, 2008) that are used for the design of new agro-industrial processes are: a) product design, product development, and manufacturing processes; b) identifying critical quality attributes, process parameters, and source variability; c) define the quality profile of the target product; and d) control the manufacturing processes to produce quality over time. In this research, following the methodological proposals of this approach has not been proposed as an objective. Although it has not been the aim of this research to follow methodological proposals of this approach (QbD), it is interesting to note that there are coincidences between the goal of the steps proposed by QbD and the procedure presented (Figure 1). At present, Computer-Aided Process Design (CAPD) method is used to design chemical, pharmaceutical, or agro-industrial processes (Petrides, Koulouris, and Lagonikos, 2002).
This research contributes knowledge to process design. For example, one should be careful when establishing a technological scheme based exclusively on experimental results, since there is a risk that, once in production, there will be defective products. Moreover, complementing the experimental results with new theoretical calculations (simulations), as well as with an uncertainty analysis, can reduce the number of defects. However, this evaluation is focused on a subsystem of quality analysis that can contribute to decision making during process design, which should consider technical, environmental, economic, and quality requirements (Cerda Mejía et al., 2017; Pérez-Martínez et al., 2012).
Economic benefit
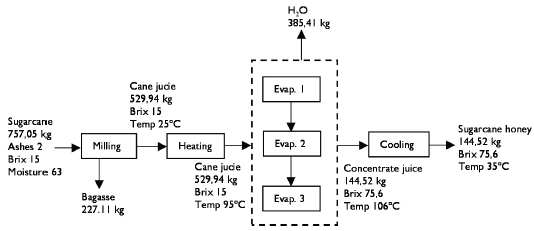
Sugarcane processing capacity in Pastaza region is 757 kg/batch. Regardless of the sugarcane variety, moisture content and Brix degrees vary, which remains approximately around 15 (Figure 5). Taking into account these data, the estimated production of sugarcane honey is around of 144,52 kg/batch. Accordingly, its commercialization in the regional market is in a presentation of 460 g at a sale price of 2,70 USD. Therefore, in each batch production of 314 units is obtained.
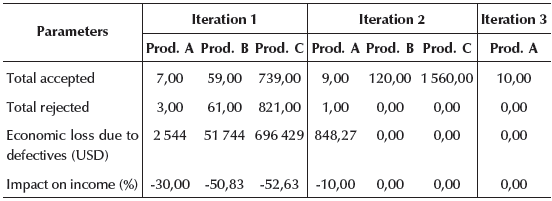
Analyzing the first iteration and the losses caused by the defective products. It was found that income reduces in the amount of 696 429 USD in a year of production (Table 6). This means that the data provided by Cerda Mejía et al. (2017) and Quezada Moreno et al. (2016) would have a huge economic impact. The negative effect of the number of defective products on the income for this iteration ranges between 30% and 52% in the range of the studied productions. These values demonstrate that the process is not economically feasible and that the investment runs the risk of not being recovered. Therefore, the selection of the range of operational parameters under study influences compliance with quality specifications and economic losses, since it affects the decrease in revenues from the sale of the product.
If the process were designed considering only productions A, Bs and C with the experimental data of Quezada Moreno et al. (2016). The process would not have been feasible from an economic point of view because the income would have been half. It is recommended to follow the methodological steps proposed in this research (Figure 1), since, by decreasing the uncertainty of the operational parameters (iteration 2), as previously mentioned, productions B and C reached quality levels above the recommended Sigma level, and the economic impact was reflected on income with a positive total balance (Table 6).
During the performed design and quality analysis, a set of tasks or previous steps were performed, such as influence determination of the operational parameters on the product quality through technological surveillance or experimentation and the capacity estimation when performed following the methodology proposed and validated by (Pérez-Martínez, Benítez-Cortés, Oquendo-Ferrer, Julián-Ricardo, and Galindo-Llanes, 2013; Pérez-Martínez et al., 2012). This methodology is the basis for this research. At the time, it was validated but it did not detail how quality should be analyzed as an aspect in process design. Therefore, by incorporating this preliminary quality analysis (Figure 1), the field is enriched, since not only will it be possible to generate optimal technological alternatives evaluated as economically feasible, environmentally compatible, and technologically feasible as proposed, but it also will contain quality criteria that allow its acceptability.
All this suggests that this type of quality analysis considers the relationship between product development and process design, which can be included in the conceptualization and ideation phases of a project, where it can contribute to the development of base concepts, creation of product lines, or concepts. It represents a new product, whose validation is required through new case studies. It has been recognized that the success of a design depends on the degree of the process specifications and considers it essential that quality indicators are measurable and predictable, since it determines the value of the product and consumer preference (Hadiyanto, Esveld, Boom, van Straten, and van Boxtel, 2008; M. Hadiyanto, 2007).
Conclusions
Quality should be considered both in product and process design for its future implications, which are related to product acceptability and feasibility of the process, elements that are interrelated. This should be valued with the same importance as the economic, technological, and environmental aspects.
The proposed methodology combines mathematical modeling, process simulation, quality, and uncertainty as elements that incorporate information into the decision-making of process design. The use of the GUM methodology reduced the variability of the quality attributes and is a distinctive element of the current project.
The case study shows that there is a relationship between operational parameters and process response parameters. It was shown that a range of operational parameters of pH (3,5-4,5) and Brix degrees (74-78) corresponding to data obtained from experimentation, which generates a Sigma level less of than three and a decrease in income from 30 to 52 % in product sales for the productions of 10,120 and 1560 batches. The decrease in the uncertainty of the operational parameters (pH of 3,79-4,21 and Brix degrees of 75,13-76.88)
guaranteed i) an increase in the Sigma level to a value greater than six; ii) zero percent defects; iii) compliance with product quality specifications; and iv) reduce economic loss due to defective products.

