


 English (pdf)
 Article in xml format
 Article references
 Send this article by e-mail
 Cited by SciELO
  Cited by Google
  Similars in
SciELO
Similars in
SciELO  Similars in Google
 Permalink
Introduction
Additive manufacturing technologies (AMT) or 3D printing are not particularly new, since the basic prototypes emerged in academic laboratories during the 1970's. Embryonic ideas have rapidly evolved, leading to the construction of professional machines during the 1980s (Canesa, Fonda, Zennaro, 2013; Dizon, Espera, Chen, and Advincula, 2018).
However, such machines were limited, and their product was expensive and only useful as a visualization tool without a productive purpose.
The evolution of AMT led to a broad variety of procedures, where inks, resins, plastic polymers, and powdered ceramics/metals have been employed as construction materials. In the beginning, the polymeric Filament Deposition Modeling (FDM) was the leading procedure in AMT. Nowadays, among all the existing procedures on the market, FDM is yet the most employed procedure, covering more than 51 % of the additive manufacturing applications worldwide (Dizon et al., 2018). This is due to the following reasons: the fall of international patents of several technologies, procedures and machines, and the emergence of the REPRAP project in Bath University, as well as very friendly and economical micro-controllers (e.g. Arduino, Sanguino, etc.). All these factors, among others, led to an unsuspected revolution in the construction of 3D printers all around the world, which is today in full expansion and without a prognosis for roof limits, at least for the next 10 years (Wohlers, 2017). Until the appearance of the REPRAP printers, there was scarce interest in determining elastic properties, as well as mechanical and constitutive models, for pieces constructed with AMT. This is due to the fact that products constructed with such machines served as prototype models for preliminary evaluation, as a previous step for constructing the final product through conventional machining procedures. Consequently, knowledge about strength and durability was not taken in to account. However, considering the improvement of production processes, the quality of the materials and the need to replace real parts or to build functional parts for service in real operating conditions, the determination of mechanical properties of parts constructed with AMT under prescribed resistance or strength has become a commandment (Tymrak, Kreiger, and Pearce, 2014). In this context, since the settlement and immediate evolution of the REPRAP project, numerous articles have appeared, covering a wide range of studies on mechanical properties of printed parts. In a basic survey of scientific/technical papers which experimentally analyze or model the material properties of printed specimens, it is possible to find no less than 500 articles in indexed journals (SCOPUS, SCIMAGO, etc.), nearly 80% of them belonging to the last five years (Chacon, Caminero, Garcia-Plaza, and Núñez, 2018; Torrado and Roberson, 2016; Caminero, Chacón, García-Moreno, and Rodríguez, 2018; Balderrama et al., 2018; Valerga, Batista, Salguero, and Girot, 2018). In all the aforementioned studies, the main purpose was to evaluate the influence of diverse constructive and operative parameters (such as temperatures, infill, stain, layer thickness, etc.) in the mechanical response of a given polymer employed for 3D printing. However, a lot of dispersion in the adopted criteria was observed, due to the absence of specific standards for testing printed pieces (Foster, 2015) and the difficulty to reach a consensus regarding the behavior of micro/macro mechanics of 3D printed pieces. Apart from the constructive parameters of AMT, there is a topic that is not commonly taken into account, which plays an important role. This is the case of the criteria and machines employed within the testing procedures according to the equipment available in the institutions that perform the studies. Some authors employed professional automatic testing equipment, including extensometers (Tymrak et al., 2014; Caminero et al., 2018; Chacon et al., 2017), but others used professional machines without them (Lanzotti, Grasso, Staiano, and Martorelli, 2015). Some authors employed academic machines with manual handling without an indication of uniformity in the strain rate (Ahmed, Islam, Vanhoose, and Rahman, 2017), while others developed their own testing criteria or machines, and so on (check Dizon et al., 2018 for a long set of references). A comparison of the material properties obtained in the papers above for the same type of materials revealsan importantdispersion. This leads to the uncomfortable idea of doubtingwhich data to use for prescribing the properties and subsequent response of a printed part.
This article is aimed to complement the previous studies. It presents a compatibility analysis, connected with positioning/locking and testing/measuring singularities of the specimen in given machines, considering accepted variations of applicability of the testing setup (e.g. use of extensometer or not, among others). The elasticity moduli are calculated with data extracted from three testing machines with different features, namely a fully automated professional machine, an academic laboratory test machine (with hand operation) and an ad hoc testing machine built by the first three authors (with automated operation). Tensile tests were circumscribed within the framework of a given standard for injected plastics (ISO 527/1, 1996; ISO 527/2, 1996), which has been used by many other authors (Lechter, and Waytaschek, 2014; Torrado and Roberson, 2016) as the operative and conceptual framework for their studies.
The present work is structured as follows: first, the methodology of the test, materials and probes are described, as well as the main features, differences and similarities of the employed machines. Then, some results are presented and a comparison through the analysis of variance of the processed results is carried out. Finally, conclusions, limitations and future research are outlined.
Methodology and materials
Figure 1 shows three types of machines employed for the comparative tests. Figure 1(a) shows the high precision professional machine; Figure 1(b), the academic homologated machine (employed by many authors worldwide (Ahmed, Islam, Vanhosse and Rahman, 2017); and Figure 1(c), the ad-hoc machine built in the laboratories of the Center for Research in Theoretical and Applied Mechanics of UTN FRBB. For these machines, the procedure described in the ISO 527/2 Standards was proposed (1996). Figure 2 shows the dimensions and characteristic lengths of the ISO 527/2-5A specimen: LG is the gauge-length (where the strain is measured and extensometer placed, if employed) and Lg, is the initial length between grip-heads. The testing machines have differences and similarities between them. Table 1 shows the main features of each one. As it can be seen, INSTROM 33961 has a better quality in comparison to the other two machines.
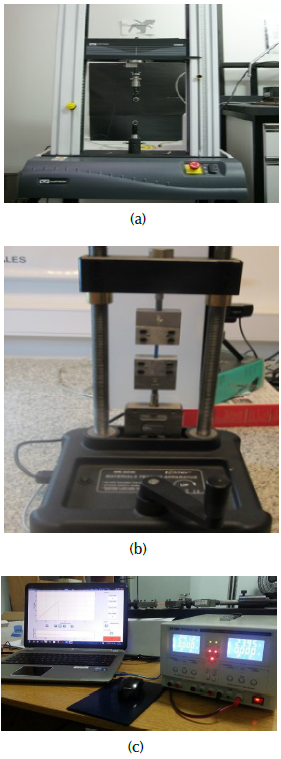
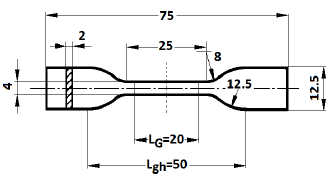
Table 1 Details of the testing machines
| Machine | INSTROM33961 | PASCO ME8230 | CIMTA-MEP02 |
|---|---|---|---|
| Laboratory | PLAPIQUI | UTN-FRRQ | UTN-FRBB |
| Load control | Automatic | Manual crank | Automatic |
| Software control | Instrom® | Capstone® | Matlab® based |
| Strain recording | Difference between grips | ||
| Displ. precision | 0,0001 mm | 0,001 mm | 0,005 mm |
| Load precision | 0,0001 N | 0,001 N | 0,001 N |
| Grips fixing and | Pneumatic | Geometric | Mechanical |
| locking | Toothed clamp | Clamp | Toothed clamp |
Source: Authors
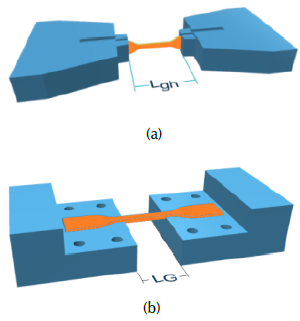
Figure 3 shows sketches of the specimen mounted on the grip-heads. The INSTROM 33961 and CIMTA-MEP02 machines have the same mounting scheme. On the other hand, PASCO ME8230 has grips to hold the bone-shaped end of the specimen. This choice was not awkward, taking into account that the measurement of displacements and strains in all of these machines is based on the difference of distance between grips, an aspect accepted in absence of extensometers, and employed in much of the aforementioned research. Thus, the specimen mounted on the PASCO machine has LG ≈ L gh .
Source: Authors
Figure 3 Sketches of locking devices: (a) INSTRON 33691and CIMTA-MEP02, (b) PASCO ME8230.
In order to help the understanding of this topic, a 3D finite element analysis, performed in FlexPDE® (Backstrom, 2006), is shown in Figure 4, where, it is possible to see the variation of the longitudinal displacement in the axis line of an ISO 527/2-5A specimen under a given extensional tension, according to the typical mounting (in absence of an extensometer) of INSTROM 33691 and CIMTA-MEP02 machines.
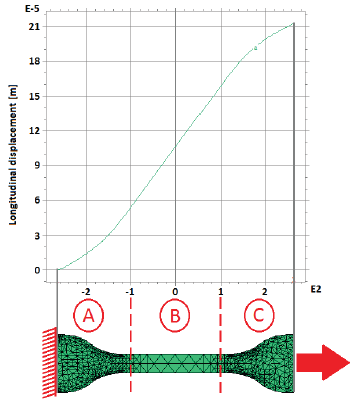
As expected, a linear displacement pattern (i.e. constant strain) along the gauge length LG (path B) is observed. However, in order to avoid mistakes in the calculation of elastic properties, the non-linear displacement (paths A and C) must be considered to correlate the effective strain and displacement of the specimen versus the final distance measured between grips or grip-heads as well. This correction is automatically performed by the control software of the INSTROM 33691 machine, by setting up the type of specimen and gauge-length (this procedure si carried out in absence of an extensometer), whatever the distance between head-jaws. On the other hand, in the CIMTA-MEP-02 machine, the correction factor must be calculated (for definite Lgh) in Matlab routines employing the raw experimental data. This conception implies that parts (A), (B) and (C) must be printed with the same features.
In accordance with ISO 527-2 (1996) regarding the determination of the modulus of elasticity and extensional stress, the following expressions are used:
where σ is tensile stress; F and A are the measured tensile force and the initial cross-sectional area of the specimen, respectively E m is the elasticity modulus; and σ i and Є i (i - 1,2') are tensile tension and strain at the i-th point of the proportionality line of the test. Particularly, σ i (i - 1,2) should be the stress values associated to strains Є 2 - 0,0050 and Є 1 - 0,0025, respectively.
Such strains correspond to values homogenized from the raw experimental data to a common origin within the whole set of specimens (a procedure requested in the standards). This is done to avoid eventual spurious effects at the beginning of the test, such as slippage or other irregularities when the grip may be not firm enough.
Four types of polymers used in 3D printing (other than the commonly tested ABS and PLA) are evaluated: high-impact poly-styrene (HIPS), recycled polyethylene terephthalate (PET), poly-lactic acid with carbon conductive powder (CPLA), and poly-lactic acid with thermo-chromatic additives (TPLA). A standard operating speed of 5 mm/min (Tymrak et al., 2014; Torrado and Roberson, 2016) has been set for all machines. In the case of the academic PASCO machine, some preliminary tests have necessarily been carried out in order to fix the proper rotation speed of the crank, although it has a variability which is intended to be evaluated against the uniform processes.
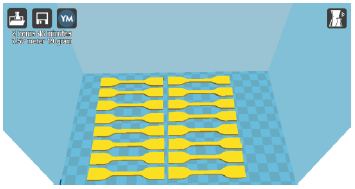
The printing parameters of each set of specimens are shown in Table 2. They correspond to the optimal configurations given or suggested by printer and filament manufacturers, given that they correspond to a machine of Argentinian origin: Far-TecnoART®, which has a nozzle diameter of 0,35 mm and uses 1,75 mm filaments. All of the latter were acquired from the same manufacturer. The whole set of 16 specimens for each material was constructed simultaneously in a multiple part printing process (Figure 5). The CURA V15.04 software was used for slicing and creating the gcode.
Table 2 Printing parameters
| Material | HIPS | PET | CPLA | TPLA |
|---|---|---|---|---|
| Print speed [mm/s] | 25 | 25 | 30 | 30 |
| Nozzle temperature [°C] | 240 | 245 | 225 | 215 |
| Bed temperature [°C] | 80 | 35 | 60 | 60 |
| Thickness of layers [mm] | 0,2 | 0,2 | 0,2 | 0,2 |
| Infill [%] | 100 | 100 | 100 | 100 |
| Raster angle [°] respect Lg | 0 | 0 | 0 | 0 |
| Number of outer loops | 2 | 2 | 2 | 2 |
| Printed number of specimens | 16 | 16 | 16 | 16 |
Source: Authors
Sets of four specimens of each material were selected for testing on each machine. A few of them were spared in case of unexpected failure or inconsistent results. All sets were randomly chosen from the printing platform.
Results and analysis
Figure 6 shows the displacement of the machine-head with respect to the time of a typical test performed in the three employed systems.
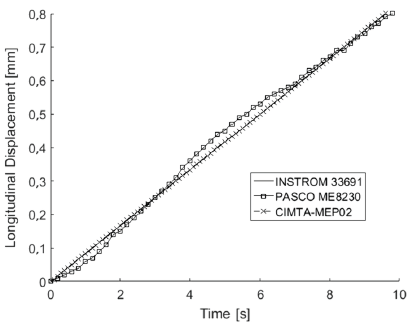
As it is possible to see, the paths of INSTROM 33691 and CIMTA-MEP02 are lines (i.e. motion of uniform speed set in 5 mm/min = 0,0833 mm/s), whereas a variable behavior is observed in the case of PASCO ME8230, which oscillates along the aforementioned linear path. This behavior is consistent with the manual handling of the machine, and special attention was given to the rotation pace of the crank in order to maintain the speed of the machine head as close as 5 mm/min (this was controlled by means of the Capstone software that interfaces the PC and test machine).
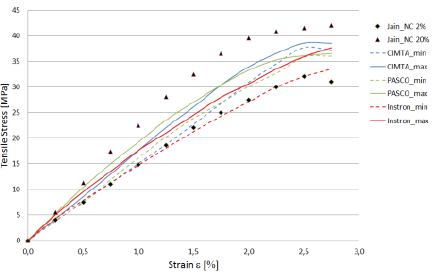
Figure 7 shows the maximum and minimum stress-strain experimental envelope curves of the CPLA tested with the three machines. The present results are compared with the experimental data gathered from the research by Jain and Tadesse (2019), who evaluated the response of their version of carbon conductive PLA (or CPLA) with respect to the percentage of conductive carbon incorporated to plain PLA. As mentioned before, the CPLA employed in the present research is generic (and not completely detailed by its manufacturer). It is possible to see that the present results are contained between the limit cases of the experimental data offered by Jain and Tadesse (2019).
Source: Authors
Figure 7 Stress-strain curves of tests in CPLA compared with data of the literatures (Jain and Tadesse 2019).
In Tables 3 to 6, it is possible to see the elasticity modulus resulting from the tests for HIPS, PET, CPLA and TPLA, respectively. In these Tables, only the mean and coefficient of variation (CoV) of each set of samples are presented. The CoV is defined as the ratio of the standard deviation with respect to the mean. A simple survey of these results reveals that the INSTROM 33961 had the lower dispersion (or lower CoV) in the set of samples of every material. This was suspected a priori, considering that the machine INSTROM 33961 has better quality and superior technology. Nevertheless, the dispersion observed in the samples of the other two machines had a CoV of comparable values in comparison with the ones observed in the INSTROM 33961. The CoV was generally lower than of 5% (an acceptable value for testing materials), except in the case of PET, which, by the way, as a recycled material, can suffer from moderate variability. Moreover, a quick overview of the experimental means of every material reveals an apparently low discrepancy among all machines and their corresponding testing criteria, except in the cases of PET and TPLA, where there was a difference of nearly 5% between two particular testing schemes. However, in order to compare the results of the three machines and their corresponding assemblies, an analysis of variance (ANOVA) had to be performed.
Table 3 Elasticity moduli (MPa) for HIPS specimens
| Machines | CIMTA-MUEP-02 | INSTROM33961 | PASCO ME8230 |
|---|---|---|---|
| Specimen 1 | 944,87 | 915,70 | 920,30 |
| Specimen 2 | 972,36 | 964,42 | 982,39 |
| Specimen 3 | 887,13 | 948,45 | 898,49 |
| Specimen 4 | 902,80 | 895,02 | 929,03 |
| Mean | 926,79 | 930,90 | 932,55 |
| CoV | 0,042 | 0,034 | 0,038 |
Source: Authors
Table 4 Moduli of Elasticity (MPa) for PET specimens
| Machines | CIMTA-MUEP-02 | INSTROM33961 | PASCO ME8230 |
|---|---|---|---|
| Specimen 1 | 934,75 | 1 090,77 | 993,18 |
| Specimen 2 | 1 061,39 | 989,46 | 953,87 |
| Specimen 3 | 1 181,18 | 1 075,86 | 1 132,19 |
| Specimen 4 | 1 107,53 | 998,71 | 1 010,53 |
| Mean | 1071,21 | 1 038,70 | 1 022,44 |
| CoV | 0,097 | 0,050 | 0,075 |
Source: Authors
Table 5 Elasticity moduli (MPa) for CPLA specimens
| Machines | CIMTA-MUEP-02 | INSTROM33961 | PASCO ME8230 |
|---|---|---|---|
| Specimen 1 | 1 533,70 | 1 508,93 | 1 502,07 |
| Specimen 2 | 1 581,67 | 1 593,19 | 1 530,23 |
| Specimen 3 | 1 621,12 | 1 489,49 | 1 580,46 |
| Specimen 4 | 1 495,56 | 1 566,12 | 1 612,32 |
| Mean | 1 558,02 | 1 539,43 | 1 556,27 |
| CoV | 0,035 | 0,031 | 0,032 |
Source: Authors
Table 6 Elasticity moduli (MPa) for TPLA specimens
| Machines | CIMTA-MUEP-02 | INSTROM33961 | PASCO ME8230 |
|---|---|---|---|
| Specimen 1 | 1 572,36 | 1 442,31 | 1 488,35 |
| Specimen 2 | 1 480,13 | 1 495,87 | 1 431,74 |
| Specimen 3 | 1 457,38 | 1 449,61 | 1 517,78 |
| Specimen 4 | 1 500,13 | 1 467,28 | 1 468,12 |
| Mean | 1 502,50 | 1 463,77 | 1 476,50 |
| CoV | 0,033 | 0,016 | 0,024 |
Source: Authors
The ANOVA is a tool for statistical analysis, useful for comparing experimental results, taking into account the influence or significance of several factors or parameters that are imposed to given sets of specimens (for this article, the strain measuring criteria, clamping and motion control).
It is useful for identifying whether two or more sets of experimental data can be accepted to give the same results, provided the factors imposed to the set of specimens. In this study, the one-way ANOVA may be applied to the three sets of data. Then, the ANOVA, by employing the Fisher-Snedecor distribution (or F-distribution), checks the 'null-hypothesis' in which specimens of all groups are taken from populations with the same expected values. For a detailed use and understanding of the ANOVA, the reader is encouraged to consult the book by Cox and Reid (2000). The one-way ANOVA can be performed easily within the data-analysis of Excel®, Matlab®, or Mathematica® spreadsheets.
The null-hypothesis of this ANOVA test implies that, for every material and every subset (one for each machine), the subset behaves in the same manner, independent from the imposed factor. In other words, this implies that the mean values of the elasticity modulus for each independent factor (i.e. machines, clamping arrangement, etc.) are statistically the same, regardless of the presence of small differences between the samples.
Due to space limitations, the results of the ANOVA are condensed in Table 7, where it is observed that, in all cases, F critical = 4,256 because each subset has 4 specimens, and the level of significance was set in 5% (which is typical for this type of analysis). Moreover F critical > F test , and P n > 5% for all cases. This implies that there is no strong evidence to reject the null-hypothesis, that is, the expected values of the E-modulus, calculated with data of the machines, do not differ between them. All values of the parameter P n are quite high, except for TPLA, which is borderline acceptable. However, there is no significant evidence that the results are due to random factors, thus satisfying the null-hypothesis.
Conclusions
This article has addressed a comparison of tensile material properties, specifically E-modulus, of typical polymers employed in 3D printing. This task has been carried out with three testing machines with different features, quality, and assembly, in accordance with standard ISO 527/2 (1996). From these tests, the following can be outlined:
a) Testing methodologies without the use of extensometers can be used to successfully determine the elasticity modulus of printed parts.
b) The differences between machine setups are not a strong factor to influence the sensibility in the calculation of the elasticity modulus in 3D printed specimens.
c) A slight variation in the deformation rate during individual tests (PASCO ME8230) has shown no significant influence in the determination of the E-modulus. However, the variation should be maintained as close as the value prescribed in the standard.
Since this article has shown the compatibility of results in employing different experimental layouts to determine the E-modulus of 3D printed specimens, there is still a wide variability and uncertainty in the behavior of printed pieces dueto other sources, such as material quality and definiteness, material ageing, etc. The study of these topics is the matter of future research.

