


 Inglês (pdf)
 Artigo em XML
 Referências do artigo
 Enviar este artigo por email
 Citado por SciELO
  Citado por Google
  Similares em
SciELO
Similares em
SciELO  Similares em Google
 Permalink
Introduction
From the literature of manufacturing processes, it is widely known that the aerospace and automotive industries, to name a few, are based on metal forming processes such as forging, extrusion, stamping, bending, etc. (Groover, 2019). In order to design these processes, it is necessary to know the elasto-plastic behavior of the employed materials. To this effect, the material must be experimentally characterized. This helps to prevent and correct failure during manufacturing processes or phenomena such as springback of the parts. Plastic behavior is characterized by the curve equivalent of stress against equivalent plastic strain, σ eq vs εP eq (Calladine, 2016). The most frequently used method to obtain this curve are tensile tests, where it is possible to obtain information about the elastoplastic behavior of materials, up to the beginning of the localized necking. This limits the obtained information on the plastic behavior to low levels of equivalent plastic strain, around 30%, in the most ductile materials. However, to properly design a forging or deep drawing process, information must be available up to an equivalent plastic strain around 80%, which is impossible to obtain through a tensile test in the most ductile materials (Rees, 2012). On the other hand, by means of a Bulge test, the phenomenon of localized necking is delayed, and equivalent plastic strain levels can be obtained around 60%, which offers more information about the plastic behavior of materials (Lazarescu, Nicodim, Ciobanu, Comsa, and Banabic, 2013).
In Figure 1, plastic behavior curves for AA5754-O, obtained by means of tensile and Bulge tests, are compared. The maximum value of equivalent plastic strain reached was around 18% for the tensile test, while the Bulge test reported levels of 40%. All the above reflects the need to have an experimental capacity that allows performing this type of test. Therefore, in this paper, the methodological and design processes followed to obtain a device capable of carrying out Bulge test are presented.
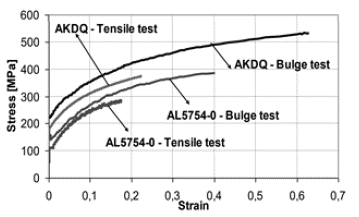
Source: Altan, Palaniswamy, Bortot, Heidl, and Bechtold, 2006.
Figure 1 Comparison between curves σeq vs εeqp obtained by tensile and Bulge tests.
Methods
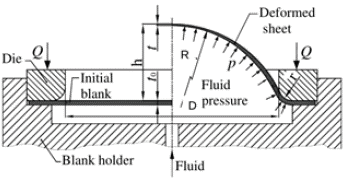
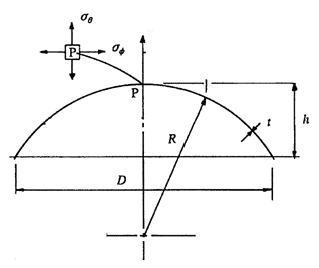
Bulge tests consist of taking a sheet metal with a circular shape, pressing it by means of dies (die and blank holder) and then applying pressurized fluid, which causes the specimen test to deform. As the pressure increases due to a hydraulic pumping system, the specimen continues to deform until it breaks.
Figure 2 shows a test scheme and how a sheet metal adopts a spherical shape that induces a biaxial stress and strain states at the pole of bulge (Lắazắrescu et al., 2013).
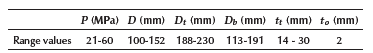
First, a bibliographic review of the literature was carried out, where some experimental prototypes designed to perform Bulge test were found (Lopez-Panal, 2015; Moses and Payam, 2015; Mersch, 2013; Wei Koh, 2008; Vasilescu, 2016). From this review, initial range values were obtained for some design parameters, such as the operating pressure (p), initial sheet thickness (fo), die aperture (D), the outer diameter of the tools (Dt), tool thickness (tt), and drawbead diameter (Db).
A summary of these parameters can be found in Table 1. All prototypes are cylindrical, thick-walled vessels, subject to high pressure, and they have at least 3 pieces, while some have a protective structure for users. All prototypes are designed to test sheet metals for automotive purposes (High Strength Steel (HSS) and Advanced High Strength Steel (AHSS)). These prototypes must induce stresses around 1 200 MPa in the specimens (Davies, 2012). These parameters serve as input for the Quality Function Deployment (QFD), which was used in this work as a methodology to define engineering specifications for prototypes and guide the morphology of design alternatives (Ullman, 2017).
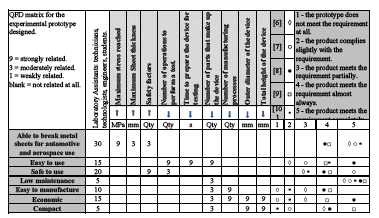
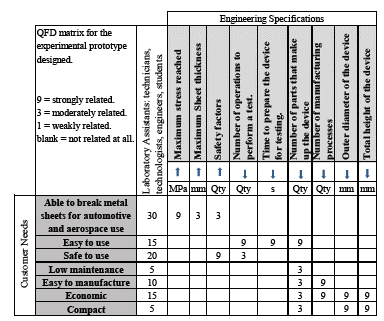
A matrix was obtained by applying the QFD methodology. It is shown in Table 2, where customer needs (7 in total) and their weighting are described, as well as engineering specifications (9 in total), which are generated from customer needs.
Table 2 Matrix generated through the QFD methodology: customer needs vs. engineering specifications
Source: Authors
The percentage weight of the customer's needs must amount to 100% by adding the weights given in the table for each need. For example, for low maintenance, the percentage weight is 5%. Considering the above, the most important need is the ability to break materials with automotive and aerospace applications (30% weight). The main objective of these specifications is to translate the customer's needs into engineering language, thus allowing to quantify needs. To evaluate the adequacy of proposed engineering specifications in relation to the customer's needs, the scale shown in Table 2 was adopted, where the number 9 means that a engineering specification is closely related to the need, and, if it is blank, it means that this specification does not contribute in anyway to satisfy the customer's need. From Table 2, there are four requirements that greatly influence the design: the number of parts in the device, the external diameter of the device, the number of manufacturing processes needed to fabricate the device, and the desired safety factor.
Likewise, another part of the QFD matrix is seen in Table 3. In addition to customer needs, there is the level of compliance with experimental prototypes found in the literature in relation to requirements (1 to 5). This scale allows identifying the flaws and benefits of each design (benchmark). In this case, it can be observed that some prototypes presented in the literature (Mersch, 2013; Wei Koh, 2008) are alternatives that adequately meet most of the requirements. In this work, these designs have been taken as a base to develop the design process and meet the initial requirements.
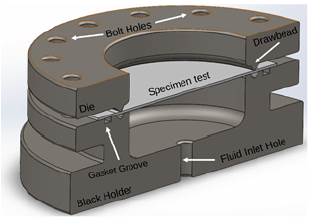
In Figure 10, a CAD model for the proposed design is presented. The device consists of two parts: a die and a blank holder. The die has a drawbead, whose main function is to prevent that specimen from slipping once the test has started, since the working fluid is pressurized, and the specimen starts to deform.
Table 3 Matrix generated through the QFD methodology: customer needs vs. weighting of the experimental designs found
Source: Authors
The blank holder has a hole in its lower part where for the pressurized fluid, as well as a cavity to contain fluid. Finally, the blank holder has a groove to house a gasket in order to ensure tightness during the test.
To achieve the proposed design for the die and blank holder, the following steps were followed:
An initial wall thickness was estimated for a hollow cylindrical container considering safety factors, the material to be used, and thick-walled pressure vessel theory.
The grade, number, and dimension of the bolts necessary for the most critical test conditions were calculated.
Afunctional geometry was proposed (with drawbead, bolt flange, groove, and fluid inlet hole)
Stresses and strains in the die and blank holder were verified using a finite element model (linear and static analysis).
A simulation of the closing stage of tools (die and blank holder) was carried out in the presence of a specimen through a finite element analysis (non-linear dynamic analysis).
Finally, a suitable gasket was selected for the device (this procedure is not presented in this article).
Once all the above was defined, stresses and strains in tools were verified again.
Preliminary design: analytical models
Bulge Test
Having defined the engineering specifications, the construction parameters of device had to be estimated. To achieve this, an analytical model of a Bulge test had to be evaluated. In this work a model proposed by Rees was used (Rees, 2012), where the maximum equivalent stress (σ e q) present in specimen test can be estimated. This stress is a function of fluid pressure during the test (p). Additionally, the maximum equivalent plastic strain (εP eq), present in specimen test can be estimated as a function of the maximum height reached by the specimen during the test (h). The model includes other parameters such as the final thickness of the specimen (t), the radius of curvature for the specimen near maximum height (R), and die aperture (D). In Figure 3, there is a scheme with the most significant model parameters.
As shown above, a sheet metal takes an approximate spherical shape when subjected to hydrostatic pressure, which generates a biaxial stress condition at the highest point (P) of the sheet metal. Additionally, the specimen is very thin compared to its radius (
 ), and it can be considered as a thin-walled pressure vessel (Mott and Untener, 2017).
Therefore, stresses in the material are related to internal pressure through Equation 1:
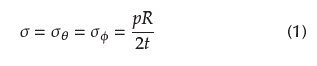
where a is the stress at the highest point of the dome (P), which is equal in all directions, since it is assumed that sheet metal adopts an approximately spherical shape, even though a small error is induced by assuming this (Rees, 2012).
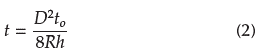
If volume conservation is assumed during the deformation process of sheet metal, the initial material volume can be related to the final material volume. Assuming that the thickness of sheet metal is thinned in the same way (i.e. throughout all of sheet metal), a small error is induced (Djavanroodi, Riahi, and Janbakhsh, 2013). Thus, an expression is obtained for the final sheet metal thickness (t):
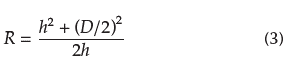
By estimating the final sheet metal thickness, the plastic strain of sheet metal at the highest point (P) of the specimen can be quantified. Similarly, it is necessary to obtain an expression that relates the radius adopted by the sheet metals under pressure (R) and some test parameters such as the height of the dome (h) and die aperture (D). An equation was proposed by Hill (Djavanroodi et al., 2013):
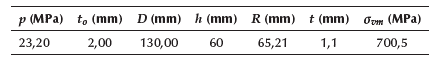
Based on Equations (I) to (3) and taking values in Table 1 as reference (limits), values were defined for the operating pressure (p) and die aperture (D) that allow reaching stress values in the specimens (σ) of around 700 MPa, enough to break most HSS and AHSS. The value of 700 MPa was set for economic reasons, given that, if a higher level of stress is required, a hydraulic unit capable of providing more pressure is needed, and, therefore, the device becomes more expensive. On the other hand, die aperture can be enlarged to achieve a higher stress level for a given system pressure. The problem with this is that it increases the cost of the device and its size.
According to the literature, the maximum possible thickness for sheet metal to be considered thin is 2 mm. Because of this, the maximum initial thickness (t0) to be considered was this value. The maximum height of the dome (h) depends on the ductility of the material. Additionally, during the design process of the device, it can serve as a parameter. In the literature, it is found that, for ductile and automotive materials, the maximum height is in the range of 35-55 mm. Therefore, a maximum design value of h = 60 mm was chosen. This allows the proposed device to test very ductile materials, even if they are not for automotive use. Die aperture (D) was estimated to be the range of 100-152 mm (see Table I). A value was chosen to make the device as small as possible, but without making the operating pressure value too high, thus resulting in a suitable value of D = 130 mm.
Therefore, the design parameters were defined as follows: σ = 700 MPa, to = 2 mm, h = 60 mm, D = 130 mmm. The selected values for maximum dome height (h) and die aperture (D) were then replaced in Equation (3), and the radius of the sphere (R) was obtained. Next, the R value and the initial sheet metal thickness (to) were replaced in Equation (2), and the final sheet metal thickness value (t) was calculated. Finally, the t, R, and σ values were replaced in Equation (1), thus obtaining the system pressure (p). The values selected for the parameters in the proposed design are shown in Table 4.
Blank Holder
The basic design of the device began with the dimensioning of the blank holder. To this effect, the thick-walled pressure vessel theory was used. This part was modeled as a hollow cylindrical vessel subjected to an internal working pressure; tangential (σt) and radial (σr) stresses had to be calculated using the following Equations (Budynas and Nisbett , 2015):
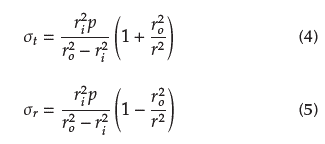
The basic a priori design parameter was the internal radius of the vessel, r; = D/2 = 65 mm, as set out in the methodological design. Additionally, a minimum safety factor was set, n = 4, as advised in literature (Mott and Untener, 2017). SAE/AIS11 020 steel was selected in an annealed state, which has an elastic limit of Sy = 294 MPa and a tensile strength of Sut = 411 MPa. This material was selected due to commercial and economic limitations. Results obtained by using Equations (4) and (5) are shown in Table 5.
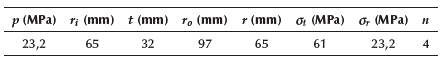
As it can be seen, the safety factor agrees with the values reported in the literature for this type of pressure vessel. For this, the must be a thickness of t = 32 mm on the thinnest wall. At the same time, the outer diameter of the raw material was defined, which in this case must be at least ro = 194 mm (75/8 inches).
Die
To achieve initial sizing of the die, it was modeled as a plate subjected to bending load as shown in Figure 4. It was assumed that Die is fixed near the bolts and that pressure is applied to the die faceup (specimen testing transmits pressure to the die).
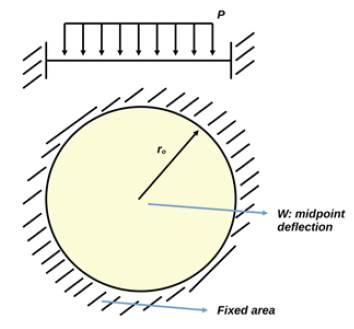
For this configuration, the maximum deflection (wmax) and maximum stress (σmax) present in die were obtained through the following Equations (Young, Budynas, and Sadegh, 2012):
where Z is calculated by:
For the model, the operating pressure (p) was 23,2 MPa, and the die aperture (D = ro) was 65 mm. The usual values of elastic constants for steels were used, E = 200 GPa and v = 0,3 (Young's modulus and Poisson's ratio). The values in Table 6 were obtained using Equations (6), (7), and (8).
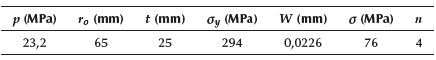
Here, it was observed that a thickness of 25 mm was needed for the die to obtain a safety factor of 4. This configuration generates a maximum stress of 76 MPa in the fixed area.
Bolted joints
Once the basic designs for the tools were defined, the number of bolts needed to provide an appropriate clamping force on the specimen had to be calculated, in order to prevent the bolted joint from separating during testing at maximum design pressure. Furthermore, there had to be enough bolts to avoid failure by tension (Brown, Morrow, Durbin, and Baca, 2008). All the above was quantified using three safety factors: the bolt yielding factor (np), the bolt load factor (nL), and the joint separation factor (n o ). The objective was to define the degree, quantity, and nominal diameter of bolts to be used in device. This was achieved by finding the combination of parameters that satisfied all safety factors mentioned above.
Table 7 shows the most important parameters for the design of bolted joint, such as the maximum design pressure and the number of bolts in the design. SAE 8 grade bolts were selected with a nominal diameter of 1/2 in, since they have a minimum proof resistance of 270 MPa.
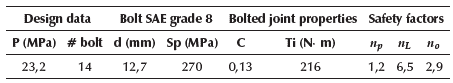
Calculations showed that the stiffness constant for the joints (C) was 0,13, and the tightening torque (T,) was 216 N-m, which resulted in the safety factors shown in Table 7. Finally, the bolted joints would have a total of 14 bolts for maximum design pressure.
Design evaluation: computational tools
FE model for tools (blank holder and die)
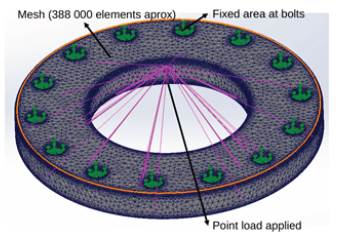
As a result of the process, the design shown in Figure 10 was obtained. As can be seen, this design has sections where stress concentrations occur. It is necessary to propose a finite element model that allows a more accurate evaluation of stresses, strains, and displacements that may occur in the tools. To this effect, CADs, finite element models, and their respective simulations were made with Solidworks® to evaluate mechanical behavior of tools under maximum load conditions. Static-linear analyses were performed, as well as their respective convergence analysis. The material selected for the tools was an AIS11 020 in an annealed state, modeled by an isotropic behavior. A mesh based on curvature was also used.
In Figure 5, the evolution of von Mises stress is shown at critical points vs. the number of elements present in each model. Critical points are presented at point D for the blank holder and at point A for the die (Figures 7 and 9, respectively).
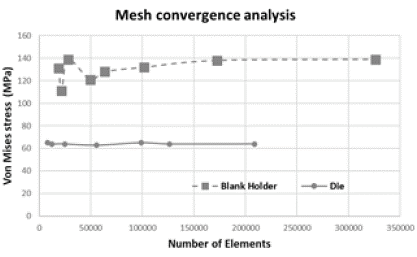
As noted, in the case of the die, at least 100 000 elements had to be used to obtain an acceptable response, whereas the blank holder was quite unaffected by the size of the mesh in the model. This is due to the critical places for tools to occur in different zones. For the blank holder, the critical point is at the bottom of tank, just where fillet radius is quite large. This means that when meshing with curvature control while having few elements in the model, there are few elements in the critical zone. As the number of elements in the model increases, there are more elements in this critical zone. Therefore, the blank holder is sensitive to the total number of elements in the model. As for the die, the critical point occurs in the holes made for the bolts because the fillet radius is smaller, and the meshing control is based on curvature. From the beginning, the critical zone is meshed with many elements. This means that, as the number of elements in the model increases, the critical zone does not necessarily have more elements. Therefore, the die is insensitive to the number of elements in the model.
Blank Holder Analysis
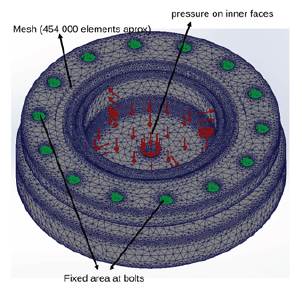
This stage began with the computational evaluation of the detailed design of the blank holder. The model was fixed in the bolt area, and pressure was applied to the internal faces of its blank holder, as shown in Figure 6, where the mesh used for the evaluation of stresses and strains can also be observed.
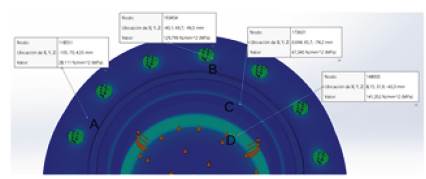
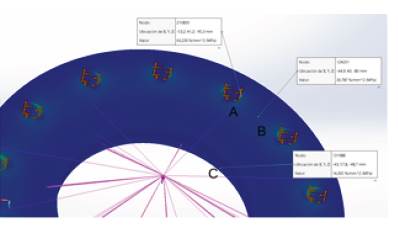
On the other hand, in Figure 7, the stress field on the blank holder is presented. The greatest stress values occurred at the bottom of the blank holder. The critical point was at point D. The largest von Mises stress was around 141 MPa, thus obtaining a safety factor of about 2 (the yield limit was 294 MPa). This value was half of that predicted by the analytical model, but it was still safe because the device would fail at the bolted joint first before breaking the blank holder. The safety factor value in the analytical model was not obtained because stress concentration was not considered, as it was done in the numerical model. It was also observed that, at point C, located at the vessel wall, the stress was 67 MPa. This agrees with the value predicted in Equation (4) for tangential stress.
Die analysis
In Figure 8, the loads and boundary conditions can be observed, as well as the mesh used for the evaluation of stresses and strains. The die is fixed near the bolts. The effect of force exerted by the specimen on the inner face of the die is modeled with a point load applied to its centroid.
In Figure 9, the stress field for the die is presented, where the maximum von Mises stress occurs in a place close to the holes for the bolts and whose maximum value is around 63 MPa (point A in the Figure). This value agrees with the results of the analytical model mentioned in the preliminary design section (Table 6). Therefore, the same safety factor was obtained, which is around 4.
Considering the above, it has been verified that the finite element models proposed for both tools were correctly performed and evaluated since both analytical and numerical models converge in practically equal results.
Bulge test simulation
Figure 10 shows the proposed design of the device and its main features (die, blank holder, bolt holes, gasket groove, drawbead, and fluid inlet hole). The objective of this simulation is to verify that a stress of 700 MPa can be reached in the specimens with proposed parameters (p,D, t o ,h). Additionally, the purpose of this process is to simulate the closing stage of tools to validate aspects of the design such as the drawbead.
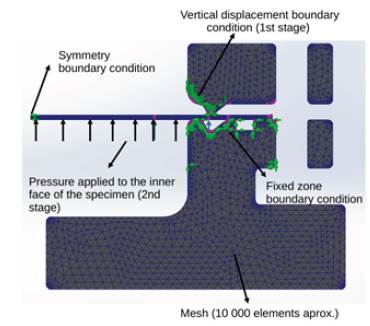
To this effect, a finite element model for the Bulge test (device and test specimen) were made. Computational simulations were performed in the Solidworks® simulation environment. A 2D axisymmetric model of the original 3D model was constructed, which generally reduces the computational cost of simulations. A non-linear dynamic analysis was chosen to simulate the Bulge test. The meshing was performed based on curvature with meshing control on the test specimen, as can be seen in Figure 11. About 10 000 elements were used in the model.
Source: Authors
Figure 11 Mesh used in the simulations and mesh control in the specimen and in the contact area.
Figure 11 shows the boundary conditions and loads proposed in the model. Initially, there is symmetry with respect to the vertical axis in the center of the device. For the blank holder, there is a restriction of zero movement in all directions. All these restrictions were made to facilitate the convergence of the simulations. Also, what happens to the specimen is more important for this study instead of what happens to the tools, which were previously validated. For the die, there is a restriction of movement in the vertical axis of about 1,5 millimeters downward, and horizontal movement is not allowed. This is the first stage of the simulation and is maintained until the end. Finally, pressure is applied on the inner face of the specimen, which is the second stage of the simulation.
For the computational simulations of the Bulge test, a material with tensile strength of about 700 MPawas chosen, which is the maximum stress induced with the proposed device. For this, DP600 steel was chosen. To model the plastic behavior of the specimen, the Solidworks® von Mises plasticity model was used, which allowed modeling the plastic hardening part with a mixed behavior between isotropic and kinematic hardening for flow curve.
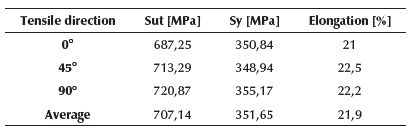
In the first instance, the model (von Mises) selected of the specimen was suitable for modeling materials with isotropic material behavior. However, it is well known that sheet metals exhibit an anisotropic behavior. Therefore, if it is required to consider such behavior, plastic behavior data are needed in three preferred directions, which usually are in the 0°, 45°, and 90° angles with respect to the original rolling direction (Martinez, Martinez, Vallellano, Centeno, and Garcia, 2013). However, since the model receives a single behavior curve, we decided to take an averaged curve of the three previously mentioned directions, which were taken from the work by Ozturk, Toros, and Kilic (2009). The values used are reported in Table 8.
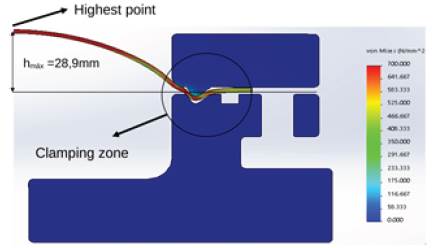
Once the computational simulations of the Bulge test were carried out, it was found that the proposed design can perform the test without problems. One of the usual problems in this type of design is that the drawbead induces premature failure of the test piece in the clamping area, which did not happen in this case. The maximum displacement reached during the simulation was around 28,9 mm at the height ofthe dome. In the literature, dome heights reported for DP600 steels are in accordance with the simulation results (Ramazani, Abbasib, Prahl, and Blecka, 2012).
The stress field in the specimen was also obtained during this stage, which is shown in Figure 12 for the last solution step in the simulation. The maximum stress value that was reported in the highest zone of the specimen (biaxial zone) were 700 MPa, with which the process of failure should begin in the specimen, since fractures occur in the biaxial zone practically at the same time as in the localized necking (Martinez, Martinez, and Vallellano, 2019; Martinez, Martinez, Borrego, Morales, and Vallellano, 2019).
Conclusions
In this work, the QFD methodology was applied, and a relevant matrix was proposed for the process of conception and basic and detailed design of a device that allows performing Bulge tests. Likewise, we found the engineering specifications that the device must have to perform tests on sheet metals for the automotive and aerospace industries. Results show that there are 9 potential customer needs and 7 engineering specifications. The most important engineering specification is the number of parts in the device, which greatly affects its cost. Additionally, size was found to indirectly influence the cost of the equipment by influencing the operating pressure of the system, which can drastically increase the costs associated with the use of the equipment.
Then, the prototype's basic design was proposed, based on analytical models of Bulge test and the theory of thick-walled pressure vessels. From these models, a pre-dimensioning was obtained, conditional on the safety factor of 4 that was used. It was found that a wall thickness of at least 25 mm was required for tools when using AISI 1020 steel to reach a pressure of 23 MPa. This allows inducing a stress of at least 700 MPa during specimen testing. When designing the bolted joint, it was found that it is sufficient to use 14 SAE grade 8 bolts, which affect the structural integrity of the tools. Subsequently, with this pre-sizing, a detailed design was made. It includes a drawbead, a groove for a gasket, and an oil reservoir for fluid testing. This detailed design is computationally valid, and it was found that the radius of agreement of the bottom of the blank holder and the number of holes to accommodate bolts in the die are design constraints and create a strong stress concentration. However, while performing static analysis of stresses and strains, it was verified that the safety factors are below 4. On the other hand, it was found that the curvature-based meshing used in Solidworks is very efficient and allows keeping the number of total elements of a model at low levels while still obtaining adequate stress and strain values.
Finally, the functionality of the proposed design was evaluated, through the computational simulation of the Bulge test, which was performed in the Solidworks® simulation environment through a non-linear dynamic analysis. An isotropic behavior of the material (DP600 steel) was assumed. The results of the simulations allowed the proposed design to be approved since the simulations were carried out completely and without causing failure of the specimen in undesired areas. The simulations consisted of two stages. The first stage was the closing of the tools, and the second stage was the deformation of the specimen under pressure, which caused a deformation ofabout29 mm in height at the center of the specimen, which was validated with experimental information obtained from literature for DP600 steel. During the simulations, no fracture of the specimen was observed outside the ideal fault zone (close to the dome). This demonstrated that, by means of a 2D axisymmetric model, proper functioning of the proposed tools can be verified. These tools will be manufactured and used to carry out a bulge test for future research.

