


 English (pdf)
 Article in xml format
 Article references
 Send this article by e-mail
 Cited by SciELO
  Cited by Google
  Similars in
SciELO
Similars in
SciELO  Similars in Google
 Permalink
Introduction
Every engineering work has its inherent risks, as countless uncertainties are embedded in all phases of its development and execution. For earthworks, the prediction of soil behavior involves several aspects; it is practically impossible to state with absolute certainty if it will perform as expected (Vieira, 2005). As for the estimation of parameters, incorrect choices may ultimately result in localized failures or even general collapse of the structure.
In order to make good decisions in the face of so many unavoidable uncertainties, Silva (2015) says it is essential to understand the variables that influence soil behavior in the best possible way, as well as to conceive mathematical models capable of accurately representing and predicting the field performance of geotechnical structures.
When experimental data is limited, the use of simpler, yet responsive methodologies to assess engineering problems and predict soil behavior should be encouraged, especially if they can be performed in shorter computational times (Silva et al., 2016).
Determining soil compaction parameters in a laboratory is a crucial step in controlling the field compaction of earthworks such as dams and embankments (Farooq et al., 2016). However, during the early stages of a project (e.g., in the preliminary assessment of the suitability of borrow materials), considerable time and effort can be saved through the use of empirical correlations (Gunaydin, 2009; Di Matteo et al., 2009; Tizpa et al., 2015; Gurtugand Siridharan, 2004), which can be extremely helpful, provided that the engineer knows the index properties of the soil. Index properties are those upon which the identification and classification steps of a soil are based; this includes grain-size distribution, Atterberg limits (liquid limit, plastic limit, shrinkage limit, and plasticity index), density, and specific gravity.
The compaction parameters - optimum moisture content (OMC) and maximum dry unit weight (yd, max) - are determined through very time-consuming laboratory tests. This makes prediction models that are based on easily measurable soil properties (such as those described above) highly desirable and remarkably useful (Karimpour-Fard et al., 2019).
Early studies proposing empirical models for estimating compaction parameters based on soil index properties were cited by Wang and Huang (1984), who manually mixed gravel, sand, limestone powder, and bentonite in different proportions, creating 57 samples, compacted with standard Proctor energy. The goal was to develop equations for predicting permeability and compaction parameters based on Atterberg limits and the grain-size distribution curve. The results of the compaction and permeability tests were analyzed along with the classification properties of the samples, which indicated a good response (R2>0,8) in predicting compaction and permeability parameters for the mixtures in the analyzed proportions.
Omar et al. (2003) collected 311 samples of sandy and sandy-silty soils from the United Arab Emirates and performed laboratory tests. They developed a linear regression model to predict soil compaction parameters for modified Proctor energy using fines percentage, liquid limit (LL), plastic limit (PL), and compaction energy. Their model resulted in nomograms capable of predicting max and OMC for granular soils within a 95% confidence interval for the analyzed samples.
Gurtug and Sridharan (2002, as cited in Farooq et al., 2016) presented a correlation for clayey soils, where max was 0,98 times the dry unit weight at plastic limit water content, and OMC was 0,92 times PL. In another study (Gurtug and Sridharan, 2004), the same authors evaluated the effect of different compaction energies on fine-grained compacted soils collected in Turkey and Cyprus, as well as data available in the literature. They found a good correlation between PL and OMC, which showed the best results for standard Proctor energy.
Sridharan and Nagaraj (2005) stated that the relationships available at the time between index properties and compaction parameters were unsatisfactory. They analyzed 10 soil samples (natural and commercial kaolinites) plus data available in the literature, finding that PL had a better correlation with compaction parameters than LL and the plasticity index (PI) for standard Proctor compactive effort.
Sivrikaya (2008) presented multiple correlation equations for fine-grained soils at standard Proctor energy by performing multilinear regression (MLR) analyses and using artificial neural networks (ANNs), assessing 113 samples obtained from the literature and collected in different sites in Turkey. His equations had R2 > 0,75 for yd, max and R2 > 0,74 for OMC, respectively. He concluded that yd, max and OMC had a considerably good correlation with PL, better than with LL and PI.
Saikia et al. (2017) came to similar conclusions; they analyzed 40 samples of natural fine-grained soils collected in Assam, India. Their results showed that LL had higher correlation rates than PL with yd, max and OMC. The root mean square error (RMSE) for the predicted yd,max was 2,1% when compared to laboratory results, and 7,5% when compared to literature values. For the predicted OMC, RMSE was 7,0% in relation to laboratory results, and 17,5-28,2% to literature values.
Thirty samples of clayey soils (18 ≤ LL < 82%; 1 ≤ IP ≤ 51%; and 2,47 ≤ Gs ≤ 3,09)1 were collected in various parts of central Italy by Di Matteo et al. (2009) for laboratory determination of index properties and compaction parameters with modified Proctor energy. Considering these results and other 41 reported in the literature, the authors developed multiple regression models that correlated max and OMC with index properties, and they noticed that the most important variable was specific unit weight, followed by LL and PL.
Toms and Philip (2016) performed regression analysis with multiple variables to predict compaction parameters from Atterberg limits and specific unit weight for 30 soil samples from Kuttanad, India, with LL ranging between 70 and 190%, PI between 26 and 127%, and specific unit weight between 2,3 and 2,5 kN/m3. They concluded that there is indeed a direct linear relationship between index properties and compaction parameters, and that the most important variables were specific gravity and the index properties.
Farooq et al. (2016) analyzed 105 samples of fine soils from Pakistan with various USCS classifications (CH, CL, CL-ML, ML), and, using multiple regression analyses, they proposed prediction curves to estimate compaction parameters from LL and PI for standard and modified Proctor energies, thus eliminating the need for compaction tests in preliminary design stages. The results showed that the variation between experimental and predicted data was within a confidence interval of ± 2,5% for ydmax and ± 9,5% for OMC.
Wang and Yin (2020) developed a model using multi expression programming (MEP), a method of genetic programming, and data comprising a wide range of soil types from previously published studies. Their model was considered reliable (R2>0,85), even for high-plasticity and coarse-grained soils, which did not figure among the soil types analyzed in previous studies; and, although their results were extremely favorable, the required high-end computational tools somewhat lost track of the simplicity present in other models, which yielded as fair predictions and could make a difference in the face of time constraints and the unavailability of a more complex software apparatus.
Regarding soils from Brazil, a study by Karimpour-Fard et al. (2019) analyzed data from 728 sets of granular and finegrained soils, most from 20 literature sources, and 227 of their own, collected in Salvador metropolitan region (State of Bahia, northeastern Brazil). Their approach involved analyses using MLR and ANNs, and the results demonstrated that the ANN model could predict compaction parameters with a zero average error, but it required a lot more of processing time, thus being unsuitable for situations where prompt decision making is mandatory. On the other hand, MLR also yielded fairly precise results at reduced computational and time costs. They noted that the compactive effort level had a low effect on prediction accuracy when compared to other analyzed parameters (LL, PL, fine, sand, gravel content, and specific gravity).
Moura (2019) also analyzed Brazilian soils but from the State of Ceará, which shares the same sedimentary formations present in Bahia, like the Barreiras Formation. Using non-linear regression, he developed models for predicting compaction parameters from index properties, such as Atterberg limits, fines percentage, and void ratio, and finding mean error of 2,3% and R2 of 0,618 for yd,max, and 8,5% and 0,541 for OMC. By comparing laboratory results for yd,max and OMC with outputs of models proposed by Omar et al. (2003) and Gurtug and Sridharan (2004), Moura (2019) noticed that their predicted values differed considerably from laboratory results. This divergence was attributed to the singular mineralogical constitution and genesis context of northeastern Brazilian soils, mostly in the semi-arid domain2.
Considering this gap, a simplified empirical model to predict compaction parameters (yd,max and OMC) for standard Proctor energy was developed using results of index tests as its inputs. The goal was to attain a better statistical performance than that of the model proposed by Moura (2019), using a different initial dataset that comprised laboratory results of characterization and compaction tests of soils classified as CL, SC, SM, and SM-SC (USCS), all from the State of Ceará, located in the semi-arid domain of northeastern Brazil.
This simplified model is intended to be used in the preliminary design stages of earth structures (e.g., initial assessment of borrow materials), when more accurate field investigation and laboratory testing may not be available yet. This can save valuable resources when estimating parameters, especially when there are financial constraints, limited time, or unavailability of test equipment. Also, its use will drastically reduce the computational cost of extensive software modeling, which is mandatory for detailed design.
Materials and Methods
Dataset definition
In this research, 169 results of laboratory tests performed on soil samples collected during the construction of 15 dams located in different municipalities in the State of Ceará were used (Figure 1). Out of these samples, 83 were randomly selected to train the empirical models (development dataset), and 86 were used in the validation step.
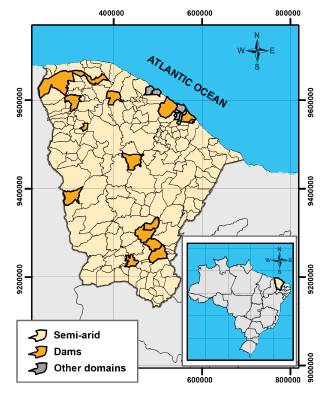
Source: Adapted from IPECE (2018).
Figure 1 Municipalities in Ceará where analyzed soil samples were collected.
The analyzed laboratory data comprised compaction parameters (yd,max and OMC) and the results of soil characterization tests (particle size curve, Atterberg limits, and unit weight), all provided by the Laboratory of Soil Mechanics and Paving (LMP) of the Federal University of Ceará.
Table 1 shows information about the earth dams where the soil samples used in this study were collected. Table 2 presents the descriptive statistics for the soil properties used as input variables in the proposed models, including mean, standard deviation, variance, minimum, maximum, and interval.
Table 2 Descriptive statistics of variables used in development (Dev.) and validation (Val.) datasets
Source: Authors
Among the analyzed samples, there was a casual predominance of clayey soils in the development dataset (52,5%), and of sandy soils in the validation dataset (62,0%). According to Vieira et al. (1996), these soil types are widely used in the Brazilian semi-arid region due to their high occurrence and the characteristics they grant to earth structures, such as: high shear strength, low permeability, and low deformability.
In this study, the initial choice of geotechnical properties employed in the development of empirical models was made based on the works of Omar et al. (2003), Gurtug and Sridharan (2004), Di Matteo et al. (2009), and Farooq et al. (2016). Using nonlinear regression, different expressions involving assorted index properties were investigated and subjected to quick statistical analyses. If the results were not satisfactory, new expressions were tested until the final equations were defined.
The laboratory tests used to classify the soil samples and determine their fit as inputs for the proposed equations included the determination of particle-size distribution, specific gravity, and Atterberg limits (LL and PL). Additionally, laboratory results from standard Proctor compaction tests were used to assess the model predictions for γd, max and OMC. Table 3 shows the technical standards concerning these tests that are valid in Brazil, as well as their equivalent ASTM standards and the befitting soil grain size for each of them.
Predictive model for maximum dry unit weight (MoPesm)
The empirical model to predict the maximum dry unit weight (MoPesm) considered properties that could potentially influence this parameter: liquid limit (LL), plastic limit (PL), percentage of material passing through a No.10 sieve (%P#10), percentage passing through a No. 40 sieve (%P#40), percentage passing through a No. 200 sieve (%P#200), and specific unit weight (ys).
Equation (1) displays the original expression used to develop MoPesm. In the nonlinear regression, the value of 1,0 was initially assigned to coefficients α 0, α1, α2, α3, α4, α 5, and α6, as well as to power coefficients α, β, δ, ε, θ, μ, and ω. They were then defined as variables and subjected to an iterative process, aiming to reach the smallest mean error.
where:
Yd, max: maximum dry unit weight [kN/m3];
LL: liquid limit [%];
PL: plastic limit [%];
%P#10: percentage of material passing through a No. 10 sieve [%];
%P#40: percentage of material passing through a No. 40 sieve [%];
%P#200: percentage of material passing through a No. 200 sieve [%]; and
Y s : specific unit weight [kN/m3].
Predictive model for OMC (MoTuo)
The parameters selected a priori to appear in the empirical model for optimum moisture content (OMC) were LL and PL (due to their close relationship with moisture content), those related to particle-size distribution (%P#10, %P#40, and %P#200), and void ratio (e).
Atterberg limits and particle-size distribution variables were chosen because a little over half of the soils analyzed in this study were clays and silts, and, according to Pinto (2006), the fine fraction has a strong influence on moisture content. Void ratio (e) was also assumed to have a potential influence on moisture content, since fine soils have a large specific surface and really small voids, which increase the effect of capillarity and water retention, and, ultimately, moisture content (Leme, 2015; Fredlund etal., 1994).
Equation (2) was the original expression proposed for MoTuo:
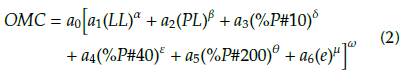
where:
OMC: optimum moisture content [%]; and
e: void ratio [dimensionless].
As described for MoPesm, after carrying out the iterative process, model MoTuo was optimized by means of defining the maximum and minimum acceptable values for the chosen parameters, aiming to eliminate values that were not aligned with field reality.
Results and discussion
Predictive model for maximum dry unit weight (MoPesm)
Some of the coefficients in Equation (1) were nullified at the end of the iterative process, which indicates that the corresponding variables had very little to no influence in determiningthe maximum dry unitweightand could therefore be excluded.
Equation (3) presents the final expression for MoPesm, whose prerequisite is that the soil has 10% < PL < 25%.
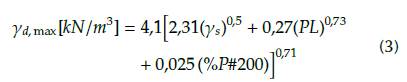
As for compacted soils, Pinto (2006) states that ydmax tends to be higher for sandy and gravelly soils, given that these have a small fine content (pictured in the presented models as variable %P#200) and low PL. The opposite is also true: Yd, max in clayey soils, due to a greater presence of fines (which provides these soils with a higher plasticity), tends to decrease.
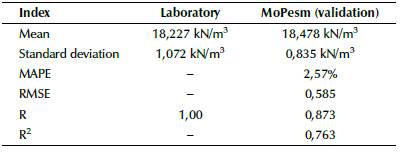
Figure 2 shows two curves: MoPesm predictions and laboratory results (regarding the soils in the validation dataset Table 4 shows the statistical indexes for laboratory results and MoPesm predictions, considering only the samples in the validation dataset, namely mean, standard deviation, mean absolute percentage error (MAPE), root mean square error (RMSE), and the coefficients of correlation (R) and determination (R2).
Source: Authors
Figure 2 Comparison between results obtained with MoPesm and laboratory tests for yd max (validation set).
Table 4 Statistics for laboratory results and MoPesm predictions, considering validation dataset only
Source: Authors
Mean and standard deviation for MoPesm and laboratory tests were similar. MoPesm predictions had a MAPE of 2,57%, a RMSE of 0,585, a R of 0,873, and a R2 of 0,763, a very acceptable performance according to Wang and Yin (2020), to whom a high R2 and low MAPE and RMSE indicate that a model has a higher precision, and to Karimpour-Fard et al. (2019), who considered a R2 above 0,70 as acceptable, labeling such model as "strong".
Predictive model for optimum moisture content (MoTuo)
For MoTuo, at the end of the iterative process, some of the coefficients in Equation (2) were nullified and removed from the final expression, shown in Equation (4), also recommended for soils with PL between 10% and 25%.
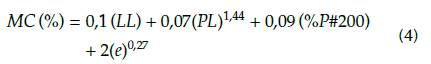
Equation (4) shows that OMC is directly proportional to consistency parameters (LL and PL), fine content, and void ratio (e). This is in line with the typical behavior of clayey soils described by Pinto (2006), which was mentioned in the previous section.
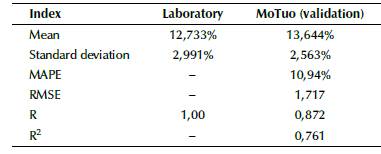
Figure 3 shows MoTuo results in comparison with the results of laboratory tests for OMC, considering only the samples in the validation dataset. Similar to MoPesm, the curve here also tends to follow laboratory results, although its performance was not as satisfactory, since it yielded some outliers. Table 5 shows the parametric analysis for MoTuo predictions, comprising the validation dataset only.
Source: Authors
Figure 3 Comparison between results obtained with MoTuo and laboratory tests for OMC (validation set).
Table 5 Statistics for laboratory results and MoTuo predictions, considering validation dataset only
Source: Authors
MoTuo had a mean of 13,644%, a little above the laboratory dataset, which indicates a slight overprediction. Its standard deviation (2,563%) was smaller than that of the laboratory (2,991%), pointing out that the values were closer to the dataset mean.
MoTuo had a MAPE of almost 11%, a performance that was not as good as MoPesm. However, a R of 0,872 and a R2 of 0,761 denoted a reasonable behavior in predicting OMC.
Comparison with other empirical prediction models
Since there are quite a few empirical models to predict compaction parameters based on index properties available in the literature, the initial dataset used to train and validate the proposed empirical models (MoPesm and MoTuo) was used as the input for the prediction models proposed by Sridharan and Nagaraj (2005), Nagaraj et al. (2015), Noor et al. (2011, as cited in Farooq et al., 2016), Gunaydln (2009), and Sivrikaya (2008).
All of these literature models were developed for Standard Proctor compactive effort, and, in Table 6, Equations (5) to (14) display the expressions proposed by these authors, as well as the prerequisites regarding the inputs.
Table 6 Prediction models for compaction parameters proposed by other authors
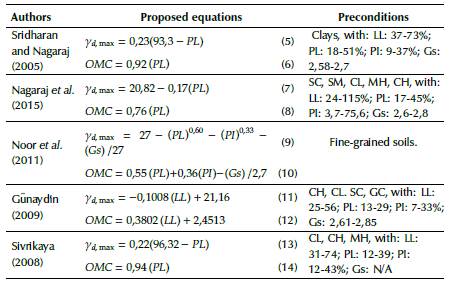
Legend: Gs: specific gravity [dimensionless]; PL: plastic limit [%]; LL: liquid limit [%]; PI: plasticity index [%].
Note: Gs was not measured in Sivrikaya (2008) .
Source: Authors.
Considering the preconditions to apply the five chosen literature models, the data in the development and validation sets were 'filtered' to select only the entries which suited the restraints of each model.
The results obtained with MoPesm/MoTuo and the literature models were then compared with laboratory results for these samples. This comparison aimed to evaluate the performance and accuracy of these models when applied to soils from Ceará, since they were developed for soils from other regions of the world, with quite different genesis and lithology.
The statistical analysis carried out when assessing the prediction models proposed by other authors was similar to that described for MoPesm and MoTuo. Table 7 displays the statistical indexes for compaction parameters obtained from laboratory results, literature models, and the proposed model, MoPesm.
Table 7 Statistical analysis for evaluated literature models, prediction model MoPesm (ydmax), and laboratory results
Source: Authors
It is important to mention that, regarding the parametrical analysis, the number of assessed samples of MoPesm and Motuo corresponded to the validation dataset only (N = 86), and, as for the literature models, the number of soil samples used as inputs actually comprised only the 'filtered' entries selected from the initial datasets (N = 169), that is, those that fell within the range of variability stated in their prerequisites.
As seen in Table 7, MoPesm had a particularly good performance when compared to laboratory results and literature models, with a mean of 18,478 kN/m3, very close to that of the laboratory dataset (18,227 kN/m3), a standard deviation (0,835 kN/m3) a little lower than the laboratory dataset (1,072 kN/m3), and, among the analyzed models, one of the smallest MAPE (2,57%) and highest R2 (0,763).
As for the other models, the one proposed by Noor et al.(2011) had an excellent performance, and the difference in the performances of all six models might be explained by the fact that the literature models were developed for soils from different regions of the planet (United Arab Emirates, India, Cyprus, etc.), with quite different characteristics when compared to Brazilian northeastern semi-arid soils.
Table 8 displays the statistical indexes for compaction parameters obtained from laboratory results, literature models, and the proposed model, MoTuo.
Table 8 Statistical analysis for evaluated literature models, prediction model MoTuo (OMC), and laboratory results
Source: Authors
Table 8 shows that MoTuo also had a reasonable performance, with a mean (13,644%) close to that of the laboratory result dataset (12,733%), and the smallest MAPE (10,94%) and the highest coefficient R2 (0,761) among the analyzed models. Once again, the model proposed by Noor et al. (2011) had a great performance among the evaluated literature models, with indexes quite close to those of MoTuo.
Figure 4 shows a visual comparison between scatter plots for all evaluated literature models for ydmax, and Figure 5, for OMC. In these scatter plots, the offset lines above and below the fitted line represent the 95% confidence interval, and the dashed lines correspond to y = x.
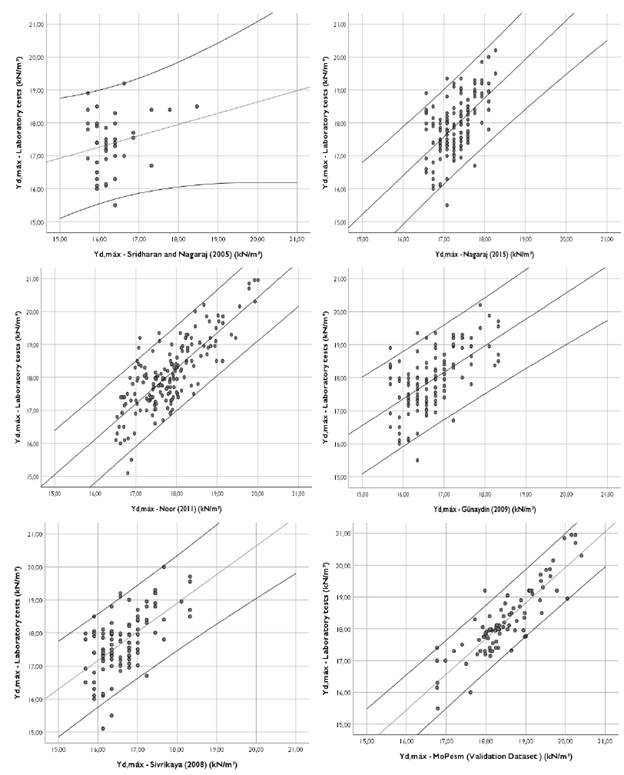
Source: Authors
Figure 4 Scatter plots for γd, max obtained with MoPesm and evaluated literature empirical models.
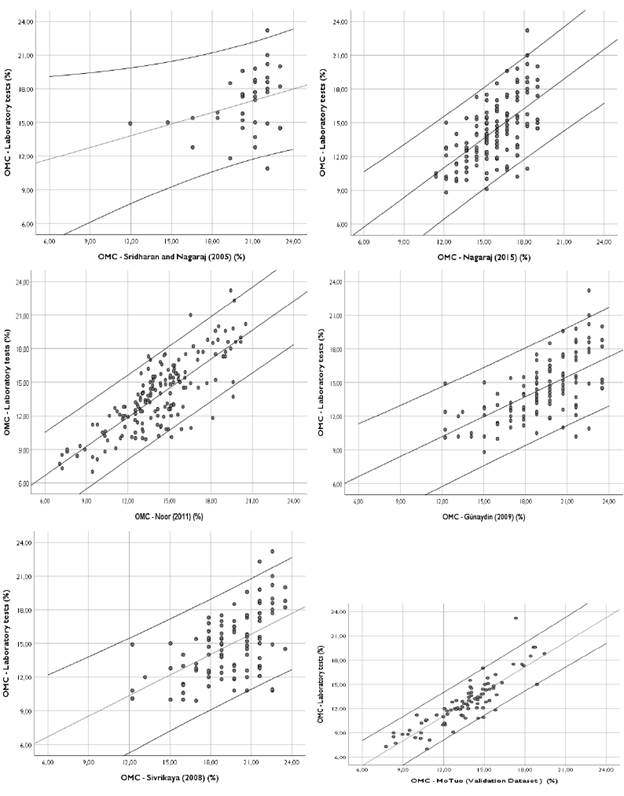
Source: Authors
Figure 5 Scatter plots for OMC, obtained with MoTuo and evaluated literature empirical models.
Based on Figures 4 and 5, it is possible to verify that models MoPesm and MoTuo presented a low data dispersion when compared to the other literature models, and, consequently, a better fit to the regression line. It is worth mentioning also that only the model by Noor et al. (2011) presented a similar statistical performance.
Conclusions
Discerning the properties of a soil is indispensable to anticipate its mechanical peculiarities and field performance (Ortigão, 2007). In this sense, models for predicting soil behavior are essential tools for engineers, as they help rationalize time and costs in preliminary field investigations, which are commonly used to bolster basic design studies (Gurtug and Sridharan, 2004).
This study aimed to evaluate the empirical correlations for different USCS types of soils, correlating basic characterization parameters and index properties with compaction parameters, in order to obtain mathematical models capable of predicting ydmax and OMC for soils compacted with standard Proctor energy.
As seen above, although universal models are highly desirable, empirical correlations developed for a region of the planet do not always correctly portray the attributes of soils from elsewhere. Thus, studies that consider index/physical properties and peculiarities of specific regions are still quite necessary.
About 92% of Ceará's total area is located within the semi-arid domain in northeastern Brazil (BNB, 2005; IPECE, 2018). As shown in Figure 1, most municipalities in Ceará are in this domain, where soil genesis and behavior are very peculiar. This also reinforces the need to develop models which are appropriate for these soils and region.
The modeling process showed that the compaction parameters for the studied soils are mostly influenced by Atterberg limits, fine content (material passing through a No. 200 sieve), and void ratio. The presented results pointed out the advantages of developing specific prediction models for semi-arid soils, like those in the State of Ceará.
Although the performance of empirical models MoPesm and MoTuo was slightly better than that of other literature models, that does not imply that they are the most accurate or reliable. One should always keep in mind that soils are extremely complex materials, and that their physical properties are primarily dictated by the minerals in the constitution of their particles (Das, 2010). Therefore, it is not fully guaranteed that an empirical model trained with soils from one region will have good results for soils from elsewhere, even if they fit the model's prerequisites. Additionally, the outputs of any engineering prediction model - even the most sophisticated and most appropriate for the modeled scenario - should be seen only as good estimates, and not as indisputable ones (Velloso and Lopes, 2011).
Nevertheless, simplified models such as MoPesm and MoTuo are a highly valuable aid for predicting compaction parameters (yd,max and OMC) in situations where there are financial restraints, limited or short timeframes, and/or unavailability of test equipment, especially in early design stages, before appropriate, extensive geotechnical sampling and field investigation can be conducted.

