English (pdf)
 Article in xml format
 Article references
 Send this article by e-mail
 Cited by SciELO
  Cited by Google
  Similars in
SciELO
Similars in
SciELO  Similars in Google
 Permalink
Introduction
In the last decade, the global increase in primary energy consumption has been between 1,5 and 2,2% per year, where the share of fossil fuels was -85% of the 1 3511 Mtoe consumed in 2017 (British Petroleum, 2018; International Energy Agency, 2018). In Colombia, the primary energy mix is composed of oil (39,1%), natural gas (20%), coal (9,4%), hydro (30,4%), and renewable energy (1,0%) (British Petroleum, 2018); whereas the power mix is composed by hydro (63,9%), natural gas (26,3%), coal (4,8%), and cogeneration and others (5,1%) (Unidad de Planeación Minero-Energética, 2015). Currently, the country faces several challenges such as maintaining a rate of economic growth under sustainability criteria and environmental preservation, which implies guaranteeing the energy supply with fewer environmental impacts. Therefore, the finite life span of fossil energy resources such as oil, natural gas, and coal, which represent 68,6% of the Colombian energy mix and have a local reserves/production ratio of 5,4, 10,8, and 55 years, respectively (British Petroleum, 2018), requires exploration to increase the energy resource reserves of oil and natural gas, as well as the development and implementation of renewable energy technologies (Unidad de Planeación Minero-Energética, 2015).
In most developing countries, landfills are the main disposal pathway for municipal solid waste (MSW). This has several disadvantages, such as extensive land use, greenhouse gas emissions, groundwater pollution, and detrimental effects on human health. In Colombia, the average production of MSW was -30 100 t/day in 2017. 83% of the total MSW produced in the country is disposed in landfills. The waste production trends indicate that sanitary emergencies could occur in the largest cities of the country by 2030 because of the end of the landfills' useful life (Superintendencia de Servicios Públicos Domiciliarios, 2017). The thermochemical treatment of MSW for energy uses has been recognized as a promising alternative for efficient MSW management. In this work, the energy recovery from different types of MSW by means of the updraft plasma gasification process to produce syngas as a substitute gaseous fuel was assessed from an economic viewpoint. According to the energy and waste scenarios in the country, this process could contribute to addressing the aforementioned issues while seeking to expand the energy mix by producing a substitute gaseous fuel and using MSW as feedstock (Unidad de Planeación Minero-Energética, 2015). The substitute gaseous fuel could be used as an energy source for residential, hotel, and commercial sectors to produce heat for energy requirements such as cooking tasks, heating water, low-medium pressure steam, and others (Unidad de Planeación Minero-Energética, 2015). Therefore, this work assesses the effect of tax incentives promoted by Law 1715 of 2014 (Colombian law of renewable energies) on the Levelized cost of syngas (LCOS) produced from MSW plasma gasification; the aim is to analyze the pre-feasibility of these projects under the current Colombian regulations. The assessment was conducted based on a previous work, where the plasma gasification model and its validation were presented in detail. Furthermore, the MSW plasma gasification process was thermodynamically characterized, and the operational parameters leading to reach the highest cold gas efficiency as a function of the MSW type were found (Montiel-Bohórquez et al., 2021).
Methodology
MSW as feedstock
The economic assessment of syngas production by plasma gasification (Plasma-G) of MSW was conducted with the five types of MSW produced in Medellín-Colombia. The MSW generation rate of the city was -1 970 t/day (TPD) in 2019 (SGCT-UM, 2015). The residential (74,5 wt%), commercial (11,8 wt%), industrial (7,9 wt%), and institutional (5,8 wt%) sectors make up the city's MSW, which is coded here as 'Mixed'. In Medellín, only -16% of the produced MSW is recycled, and the remaining waste is disposed in La Pradera, a landfill located -57 km from the city (Vélez and Mora, 2016). In general, the chemical composition of MSW is different for each sector (SGCT-UM, 2015). The chemical composition of MSW from each sector that makes up the MSW from the city is presented in Table 1. The calculation of the MSW's chemical composition is presented in detail in previous works (Montiel-Bohórquez and Pérez, 2019; Montiel-Bohórquez et al., 2021). Besides, the HHV of each waste type was estimated using the correlation proposed by Channiwala and Parikh (2002). Herein, inert waste such as as glass, metal, and dangerous wastes were excluded from the MSW stream to be gasified (Couto et al., 2016; Lozano et al., 2017).
Table 1 Generation rate, heating value, and ultimate and proximate analyses of MSW produced in Medellin, Colombia
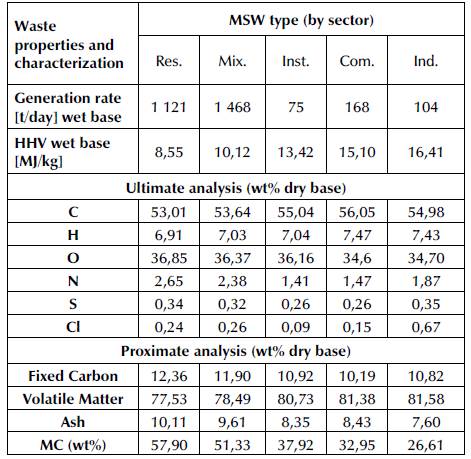
Com: Commercial, Ind: Industrial, Inst: Institutional, Mix: Mixed, Res: Residential
Source: (Montiel-Bohórquez and Pérez, 2019; Montiel-Bohórquez et al., 2021)
Plasma gasification
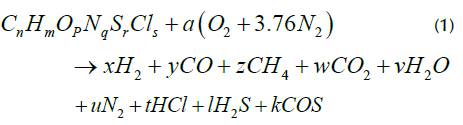
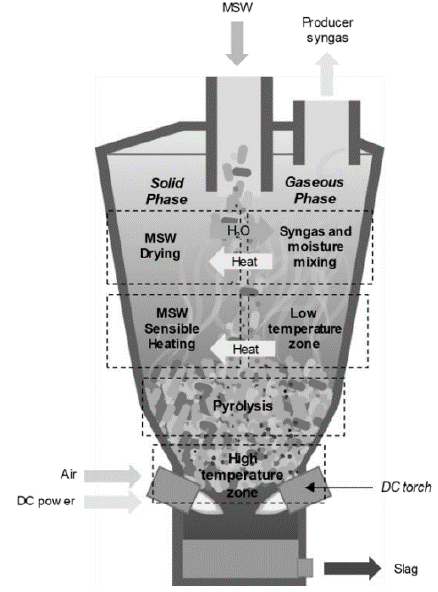
The Plasma-G process was successfully modelled under a thermo-chemical equilibrium approach (Montiel-Bohórquez et al., 2021). There, the syngas composition and torch power consumption associated with MSW Plasma-G, as well as the energy and exergy efficiencies of the process, were estimated. The Plasma-G was modeled by means of a thermochemical equilibrium approach, simulating a moving bed updraft plasma gasifier, which works at atmospheric pressure and uses air as plasma gas in the DC torches (Figure 1). The global gasification equation modelled is presented in Equation (1) (Minutillo et al., 2009).
In the moving bed updraft plasma gasifier, the solid waste is fed through an input port located at the top of the reactor. Thus, the solid absorbs energy from the gaseous phase (syngas) as the waste travels from the top to the bottom, while the syngas flows from the bottom to the top (Figure 1). The drying process of MSW is conducted when its temperature reaches 105 °C, which leads to the evaporation of the moisture that is mixed with the syngas stream (Indrawan et al., 2019; Janajreh et al., 2013; Minutillo et al., 2009). Downstream (from top to bottom), the dried solid continues to be heated by the gaseous phase until the waste reaches the high energy-density stage (plasma), where plasma jet impacts the solid phase, and consequently, it is thermally degraded for producing the syngas and slag.
Source: Authors
Figure 1 Updraft plasma gasifier scheme with considered solid phase-gaseous phase interactions
Montiel-Bohorquez et al. (2020) validated the Plasma-G model with experimental and numeric data from the literature. There, the data reported by Minutillo et al. (2009) and Perna et al. (2016) were used to assess the Plasma-G model's accuracy regarding numeric and experimental results, which was found satisfactory given the low average relative errors of 5,24 and 6,23% for the numeric and experimental validations, respectively. Furthermore, the combination between operational conditions (air flow and plasma temperature) that allowed to reach the maximum efficiency was found through a sensitivity analysis. The power consumption of the plasma torch was one of the main process parameters that affected the energy and exergy efficiencies. Despite the fact that the moisture content of MSW increased from 26,61 to 57,9% (Table 1), the energy and exergy efficiencies increased on average by 1,5 and 5,4%, respectively.
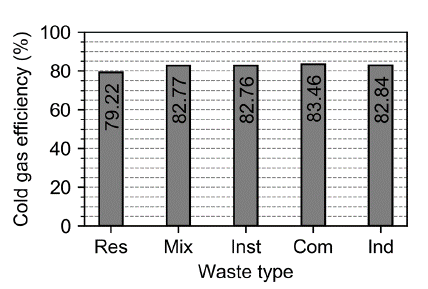
This behavior was ascribed to the updraft technology; when the raw MSW fed to the reactor is dried by the gaseous stream, a high MC leads to a reduction of the dry MSW fraction to be thermally decomposed by the torches, and, consequently, the power torch consumption decreases. On the other hand, when the plasma temperature increased (from 2 500 to 4 000 °C), the energy and exergy gasification efficiencies diminished because the torch power consumption increased by 28,3% on average. The maximum cold gas efficiency (CGE) of the Plasma-G process ranged from 79,22 to 83,46%, highlighting the flexibility of the process in treating MSW (Montiel-Bohorquez et al., 2021). The maximum Plasma-G CGEs reached for each waste type (sector) are considered here to analyze the effect of the renewable energy law (tax incentives) on LCOS from MSW Plasma-G (Figure 2).
Levelized cost of syngas as substitute gaseous fuel
Law 1715 of 2014 includes the energy content of waste as a non-conventional renewable energy source (Article 18), specifically waste without recycling or recovery strategies. Thereupon, given the low recycling and recovery rate in the city of Medellín (~15%), we have proposed that all the generated waste could be used in the plasma gasification plant to produce gaseous fuel as an energy recovery strategy. The LCOS produced by Plasma-G of the five different types of MSW was calculated. These calculations were carried out based on the optimal conditions for each waste found (plasma gasification section), whose development and analysis were presented in detail by Montiel-Bohórquez et al. (2021). The LCOS is the cost per unit of energy that includes all costs of an energy (gaseous fuel) generation project during its lifetime. Therefore, LCOS determines the constant price at which the energy must be sold to guarantee a net present value equal to zero and a minimum acceptable rate of return. LCOS (US$/kWh) considers the investment costs, the fixed and variable costs for operating and maintenance, the fuel costs, and externality costs. It is calculated according to Equations (2) and (3) (Bruck et al., 2018; Castillo-Ramírez et al., 2016; Saldarriaga-Loaiza et al., 2019; Zang et al., 2019).

where, LCOE I (US$/kWh) represents the investment costs per energy unit, LCOE V (US$/kWh) denotes the variable operating and maintenance costs per energy unit, LCOE F (US$/kWh) is the fixed operating and maintenance costs per energy unit, LCOE G (US$/kWh) represents the fuel costs per energy unit, and LCOE E (US$/kWh) denotes the externality costs per energy unit. It is worth noting that, while calculating the LCOS for MSW plasma gasification, the fuel cost was assumed to be zero, since the plant does not pay for the fuel. Meanwhile, the externality costs were considered as the amount of money (USD/t of MSW) that the plant receives for the treatment of MSW.
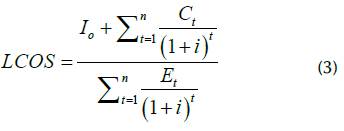
where, I O (US$) represents the initial investment, C t (US$) is the net costs for operating, maintenance, fuels, and externalities in year t, E t (kWh) is the yearly energy production, i (effective annual interest rate, %) denotes the discount rate that is calculated by the weighted average cost of capital (WACC), and n (years) is the lifetime of the project.
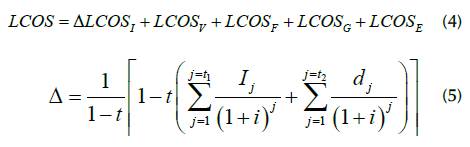
Law 1715 of 2014 encourages investment in projects involving non-conventional energy sources (NCES) through four tax incentives (Ley 1715 de 2014), namely 1) a deduction of up to 50% of the investment through income tax during the first five years of operation (Investment Tax Credit, ITC); 2) exemption from VAT on national or imported equipment, elements, machinery, and services that are destined to the pre-investment and investment of NCES; 3) exemption from the payment of import on the previously named components; 4) an accelerated depreciation of assets, which will not be greater than 20% per year as a global rate. Nevertheless, under the National Development Plan 2018-2022, the ITC can be exercised during the first fifteen years of operation. Therefore, the concept of the tax factor (A) is applied to evaluate the effect of tax incentives on LCOS. Equations (4) and (5) show the modified LCOS considering tax incentives (López-Lezama et al., 2017). Thus, A is a factor affecting the initial investment cost of the project, and it stems from the tax incentives given by Law 1715 of 2014.
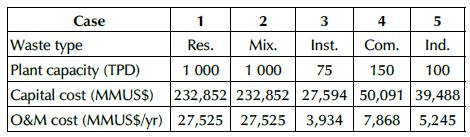
Herein, the five types of waste produced in the city of Medellín have been considered as potential feedstock for plasma gasification plants. The capacity of each plant depends on the production of each waste type. The methodology followed for estimating the capital cost of each plant, as well as O&M cost was presented in detail by Montiel-Bohórquez et al. (2020). Table 2 shows the costs updated to December 2019 for the syngas plants as a function of waste type and its processing capacity (in tons per day, TPD). The energy behavior and technical parameters of each plasma gasification plant were previously calculated and analyzed (Montiel-Bohórquez et al., 2021). It was assumed that the treatment system of the plasma gasification plant completely removes the undesirable compounds from the syngas (H2S, COS, HCl, etc.) (Figure 1), and also that a fraction of syngas is used to produce the torch power requirements by its combustion in an internal combustion engine (ICE) with a thermal efficiency of 36% (Medina-Jiménez et al., 2019).
Results and discussion
The LCOS was calculated for each MSW type (sector) named as 'plant case' considering tax incentives. Thereby, the tax incentives of Law 1715 of 2014 and the benefits of the National Development Plan 2018-2022 were evaluated on LCOS (Congreso de la República, 2018; Ley 1715 de 2014). Table 3 presents additional technical and financial data of the Plasma-G plants for each case, which was used for calculating LCOS. The O&M cost includes the fixed and variable costs. The fuel cost was set to zero because, in the business model proposed here, the plants do not have to pay for solid waste (Lozano et al., 2017; Zang et al., 2019). Furthermore, the cost of MSW transportation was also set as zero since the plant is assumed to be located within the current landfill facility; the transportation cost is assumed to be paid by the waste generators (city residents, companies, commercial centers, and institutions), which is the actual condition of waste management in Medellín. Conversely, the externality costs represent an income ($US$/kWh) for the project from disposal of solid waste. For LCOS calculation, a discount rate of 8,1% was considered, which was estimated according to the WACC.
Additionally, the cash flows were calculated considering constant the following parameters: a lifetime of 20 years, a cost of 8,7 US$/t for solid waste disposal (Empresas Varias de Medellin E.S.P, 2019), a market representative rate of 3 300 COP/US$ (December 29th, 2019), an accelerated depreciation on assets of 10 years, and the constant prices methodology [16].
The LCOS without and with tax incentives is presented in Figure 3 for each plant case. The LCOS, regardless of MSW type, diminished by -4,3% on average when the tax benefits of Law 1715 of 2014 and of the National Development Plan 2018-2022 were applied. Case 2 (mixed wastes) reached the lowest LCOS (14,37 $US$/kWh) because that plant has the highest yearly energy production and the lowest O&M cost, as shown in Table 3.
Table 3 Technical and financial parameters for each plant case
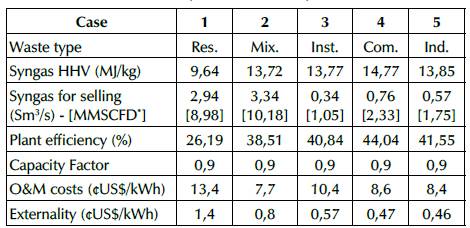
*MMSCFD: Million standard cubic feet per day of syngas produced
Source: Authors
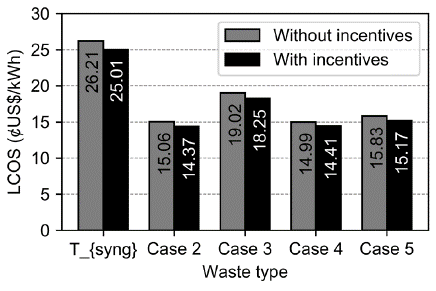
Case 2 has associated the highest investment cost that is compensated by the two mentioned variables (high energy production and low O&M costs). Thereby, case 2 could generate a unity of energy with the lowest cost. This result is highlighted because it represents the mixture of all waste types, which is the main MSW problem due to the increasing production rate (Superintendencia de Servicios Públicos Domiciliarios, 2017).
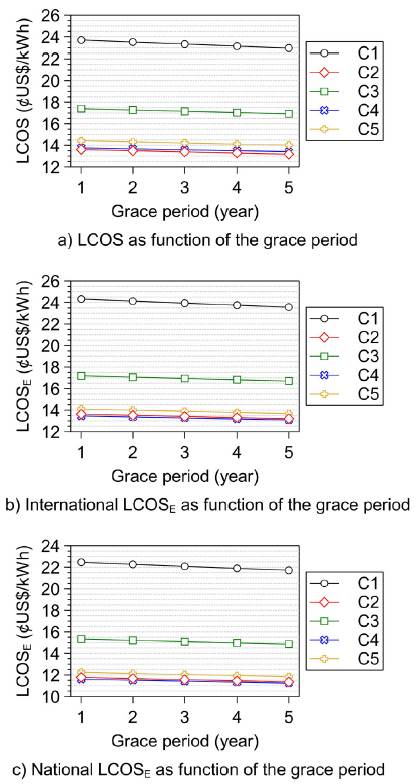
On the other hand, the reduction percentage of LCOS increases if the investment costs and the pre-tax earnings of the plant increase. This is attributed to the effect of tax incentives on LCOS that depends on the ITC, as shown in Equations (4) and (5). Therefore, cases 1 and 2 reached the highest reduction on LCOS (4,59%), which is ascribed to their high investment costs and the pre-tax earnings. According to the highest investment costs for cases 1 and 2 (residential and mixed), these cases can take advantage to reduce the LCOS. The benefits are related to the ITC during the first fifteen years of operation, which allow recovering up to the 50% of the initial investment through the income tax (Congreso de la República, 2018; Ley 1715 de 2014). Seeking to further reduce LCOS of Plasma-G plants, an alternative investment plan is proposed herein, which consists of financing 70% of the initial investment considering different grace periods between 1 and 5 years, as well as the tax incentives. Figure 4a shows the LCOS variation of each plant case with regard to the grace periods.
The LCOS of each Plasma-G plant decreases if the grace period increases (Figure 4a). This behavior is related to the effect of the effective corporate tax income rate on the net present value. LCOS decreases when the financial interests are paid in some periods of the cash flow, where there is no deduction for accelerated depreciation. The LCOS of the five cases (waste types) for a grace period of 5 years is 22,95 $US$/kWh, 13,19 $US$/kWh, 16,92 $US$/kWh, 13,42 $US$/ kWh, and 14,02 $US$/kWh, respectively. Consequently, case 2 reached the lowest LCOS, with a 12,43% reduction with respect to LCOS without tax incentives (Figure 3). For this investment alternative, the effect of the tax incentives will be greater on projects with high investment costs and high pre-tax earnings, as well as within the projects where there is no financing.
Regarding economic pre-feasibility, in the international and national markets, natural gas is traded at 2,3 US$/ MMBTU (LCOS=0,78 $US$/kWh) (US Energy Information Administration, 2020) and 7,72 US$/MMBTU (LCOS=2,6 $US$/kWh) (Unidad de Planeación Minero-Energética, 2017), respectively. Aiming for the syngas to match these levelized costs (LCOS), it is required that the Plasma-G plants receive an income from waste disposal charge that is represented by the LCOS E externality, which is defined as the income per unit of generated energy ($US$/kWh) associated with the waste disposal charge. As the international and national prices of natural gas are different, one value of LCOS E must be calculated for each price of reference, thus finding an LCOS E for the international price and another one for the national price, which are named international LCOS E and national LCOS E , respectively (Figure 4a b, c).
Figure 4b and Figure 4c show the international and national LCOS E considering tax incentives as a function of the grace period. According to these results, and considering a grace period of 5 years as reference, the LCOS E of plant cases 1, 2, 3, 4, and 5 must be equal to 23,56 $US$/kWh, 13,20 $US$/kWh, 16,71 $US$/kWh, 13,1 $US$/kWh, and 13,96 $US$/kWh, respectively, in order to obtain an international natural gas price of 0,78 $US$/kWh (2,3 US$/MMBTU). For a national natural gas price of 2,6 $US$/kWh (7,72 US$/ MMBTU), the LCOS E of the plants must be 21,71 $US$/ kWh, 11,36 $US$/kWh, 14,86 $US$/kWh, 11,25 $US$/kWh, and 11,84 $US$/kWh, respectively. When the national and international prices of natural gas (LCOS) are lower than that of the Plasma-G plants, the waste disposal charge must raise in order to obtain greater incomes from externalities and be able to reduce the LCOS. On the order hand, judging from Figure 4b and Figure 4c, the LCOS E of each plant diminishes when the grace period increases. This behavior stems from the influence of the effective corporate tax income rate on the net present value, since the net present value decreases when the financial interest payment is deferred to a longer time, while the tax incentives are considered. This was previously analyzed in Figure 4a.
Source: Authors
Figure 4 Effect of the grace period on LCOS and LCOS E of each study case associated with the five waste types
The plant of case 4 reached the lowest LCOS E for both scenarios (national and international), since it had the highest ratio between incomes from energy generation and total incomes (sum of incomes from externalities and from energy generation), and, likewise the lowest LCOS without incentives, as shown in Figure 3. Therefore, the incomes from gaseous fuel (syngas) production, together with the low cost of the technology per unit of net power, allow a greater reduction of the cost of solid waste disposal than the other plants. Finally, and according to the cash flows, the plant of case 2 (mixed waste type) showed the highest reduction percentage in LCOS E , which is associated with the highest ratio between pre-tax earnings and externalities incomes, thus allowing it to take greater advantage of the tax incentives by means of the ITC.
Conclusions
The LCOS was estimated and used as an economic indicator in order to assess the economic pre-feasibility of syngas production by means Plasma-G on MSW in the Colombian context. The five plant cases were considered according to the studied waste types: case 1 - Residential, case 2 - Mixed, case 3 - Institutional, case 4 - Commercial, and case 5 - Industrial. The LCOS found without tax incentives were 26,21, 15,06, 19,02, 14,99, and 15,83 $US$/kWh for cases from 1 to 5, respectively. Nevertheless, when the tax incentives of the renewable energy Law 1715 of 2014 and the National Development Plan 2018-2022 were applied, the LCOS were reduced down to 22,95, 13,19, 16,92, 13,42, and 14,02 $US$/kWh for cases from 1 to 5, respectively. These reduced values were reached considering the following conditions: an accelerated depreciation on assets of 10 years, a financing of 70% of the initial investment, and a grace period of 5 years. It is highlighted that the plants 1 and 2 achieved the greatest LCOS reduction percentage (12,43%), which is attributed to their high investment costs and the pre-tax earnings, thus allowing them to exercise the investment tax credit in a greater proportion during the first fifteen years of operation. However, these projects involving syngas production (as a substitute gaseous fuel) from solid waste are not yet financially feasible in Colombia, as the LCOS for each case is higher than the average national price of natural gas 2,6 $US$/kWh (7,72 US$/MMBTU - December 29th, 2019). Therefore, it is necessary to implement new tax policies and incentives to diminish the LCOS, thus ensuring financial pre-feasibility and competitiveness of Plasma-G plants in the country. As it was proposed here, an increase in the waste disposal charge through an LCOS E ranging between 11,25 and 23,56 $US$/kWh (123-259 US$/t) on average contributes to the economic pre-feasibility of these waste-to-energy (WtoE) projects. It is a relevant result since it shows two main facts: first, plasma gasification technology requires further commercial development to overcome the current limitations associated with high technological costs; and second, more policies are required for encouraging the energy recovery of wastes through high-efficiency technologies in the Colombian context. On the other hand, it is worth noting that the high waste disposal charge (123-259 USD/t) also stems from comparing the LCOS with the price of natural gas, which is a fuel with a higher quality and more mature production and distribution chains. Although waste generators should pay a tax for MSW management and treatment, other mechanisms must be considered while seeking to enhance the economic performance of WtoE projects and reduce taxes. For instance, including green bonds and reliability charges. New assessments on WtoE systems could be carried out including these factors in future work.