Inglês (pdf)
 Artigo em XML
 Referências do artigo
 Enviar este artigo por email
 Citado por SciELO
  Citado por Google
  Similares em
SciELO
Similares em
SciELO  Similares em Google
 Permalink
Introduction
Text analysis and natural language processing have emerged as a very useful sub-area of artificial intelligence, which allows extracting valuable information from text and performing a specific task. Some applications of these areas include web page classification (Onan, 2015), text document classification (Onan et al., 2016a; Onan, 2017a), text genre classification (Onan, 2016), text document clustering (Onan, 2017b), and, more recently, topic extraction modeling (Onan, 2019a) and opinion mining (Onan, 2019b). Similarly, one of the most frequent tasks in text analysis is sentiment classification (Onan and Korukoglu, 2015; Onan et al., 2016b; Onan et al., 2016c; Onan, 2018; Onan, 2020). Regarding the most used types of features in text analysis, we found: Bag of Words (BoW) (Onan and Korukoglu, 2015; Korukoglu and Bulut, 2016c), latent topics obtained with Latent Dirichlet Allocation (LDA) (Onan et al., 2016b), five main categories from Linguistic Inquiry and Word Count (LIWC) (Onan, 2018), and, more recently, word embeddings such as Word2Vec, FastText, GloVe, LDA2vec, DOC2vec, and Term Frequency - Inverse Document Frequency (TF-IDF) weighted Global Vectors for word representation (GloVe) (Onan, 2020). Regarding the use of machine learning methods, the following have been widely used in the literature: i) classical learning methods such as Naive Bayes (NB) (Onan, 2015; Onan et al., 2016a), K-Nearest Neighbors (KNN) (Onan, 2016), Support Vector Machines (SVMs) (Onan, 2017a, 2017b), and Logistic Regression (LR) (Onan, 2019b); and ii) deep learning methods such as Convolutional Neural Networks (CNNs), Recurrent Neural Networks (RNNs), Bidirectional RNNs with attention mechanisms (RNNAM), Gated Recurrent Units (GRUs), Long short-term memory (LSTMs) (Onan, 2019b), and a combination of CNNs and LSTMs (Onan, 2020). Ensemble learning methods such as bagging, adaptive boosting, and random subspace have also been used (Onan et al., 2016b; Onan et al., 2016c; Onan, 2018).
Another important task related to text analysis which has emerged in the last decade is the study of personality, which plays an important role in human interaction and is defined as the combination of the various behavioral characteristics, emotions, motivations, and thinking patterns of an individual (Allport, 1937). Personality not only reflects the consistent patterns of behavior, thinking, and interpersonal communication; it also influences important aspects of life, including happiness, motivation to address tasks, preferences, emotions, and mental-physical health (White et al., 2004; Vinciarelli and Mohammadi, 2014; Xue et al., 2017). Nowadays, the increasing amount of information that users publish online allow the study of different personality traits with considerable volumes of data. One of the specific sources of information is the text that people publish in their status updates, tweets, blogs, vlogs (video-blogs), and reviews (Mohammad and Kiritchenko, 2013). From the psychological point of view, one suitable and accepted way of assessing personality traits is the Big Five Factor Model of personality dimensions. This is a well-known scale that evaluates the presence of five personality traits (John et al., 2008). The list below shows the five basic traits included in it and their corresponding social aspects (John et al., 1991; Celli et al., 2014). Note that the resulting acronym is OCEAN, which gives the other widely used name of the model.
Openness to experience: intellectual vs. unimaginative.
Conscientiousness: self-disciplined vs. careless.
Extraversion: sociable vs. shy.
Agreeableness: friendly vs. uncooperative.
Neuroticism (the inverse of emotional stability): neurotic vs. calm.
The automatic classification of personality traits has a wide variety of applications ranging from cognitive-based market segmentation to human health evaluation (Cambria et al., 2017). Different methods to model personality traits from texts directly generated by the person (i.e., social media posts) or from transliterations generated from audio or video recordings have been proposed in the literature. Celli (2012) classified the five personality traits of the OCEAN model considering linguistic features extracted from status updates of a social network called FriendFeed. The author found an average accuracy of 61,3% for the five traits. Similarly, in Hassanein et al. (2018), the authors classified the presence vs. absence of the same five personality traits in posts belonging to the myPersonality dataset (Kosinski et al., 2015). The authors extracted semantic and morphological features and reported an average accuracy of 64%. Different machine learning methods were used in Pratama and Sarno (2015) to classify different personalities from different datasets. The authors created models based on TF-IDF and reported accuracies of up to 60% with data from Facebook posts and 65% with Twitter posts (Tweets). Later, also working with the myPersonality dataset, Mao et al. (2018) used different classifiers, including KNN, NB, and Decision Trees (DT), in order to classify the personality traits. The features considered by the authors include temporal measures (e.g., frequency of status updates per day), social network measures (e.g., network size), morphological features (e.g., frequency of adjectives), and TF-IDF-based features. According to their findings, TF-IDF features are suitable for classifying personality traits and the best reported F-measure was 79% for the 'openness to experience' trait.
In the same year, da Silva and Paraboni (2018) presented a study where different features were extracted, including BoW, psycholinguistics, Word2Vec (600-dimensional Continuous BoW and Skipgram embedding models), Doc2Vec, and LSTM (600-dimensional Keras-based embedding layer) to recognize the personality of approximately one thousand Facebook Brazilian users. The highest F1-score reported by the authors was 61% for the 'extraversion' trait. According to them, there is no single model capable of providing the best results for all five traits, which may suggest that not all personality traits are equally modeled from text. They also noticed that word embeddings seem to outperform other models based on lexical resources.
Among the works about language model features, Mehta et al. (2020a) used language model embeddings obtained from Bidirectional Encoder Representations from Transformers (BERT) models, as well as psycholinguistic features obtained with Mairesse, SenticNet, NRC Emotion Lexicon, and other methods to predict the personality traits of the Big Five model in the Essays dataset (Pennebaker and King, 1999). In their fine-tuned setup, they experimented with LR, SVM, and Multilayer Perceptron (MLP). Their results showed that language modeling features (based on BERT embeddings) consistently outperformed conventional psycholinguistic features for personality prediction. In another work with the same dataset (Kazameini et al., 2020), the authors used the BERT linguistic model to extract contextualized word embeddings from textual data and psycholinguistic features obtained with Mairesse for automatic author personality detection. Their extensive experiments led them to develop a new model that feeds contextualized embeddings along with psycholinguistic features to a bagged-SVM classifier for personality trait prediction. Their model outperformed previous results in the state of the art by 1,04% while being significantly more efficient. Similarly, Jiang et al. (2020) analyzed the Essays dataset using the pre-trained contextual embeddings obtained from BERT and RoBERTa while also using different linguistic features obtained with LIWC. The authors tested several types of neural networks: HCNN (Hierarchical CNN model), ABCNN, and ABLSTM, which represent CNN and Bidirectional LSTM models with attention mechanism and HAN (Hierarchical Attention Network). They concluded that, in comparison with LIWC-based models and different Neural Networks (HCNN, ABCNN, ABLSTM), their model improved the performance by approximately 2,5% for the five traits on average when using BERT embeddings: 'agreeableness' by 2,2%, 'conscientiousness' by 2,8%, 'extraversion' by 2,5%, 'openness to experience' by 3,1%, and 'neuroticism' by 1,6%. With RoBERTa, the authors achieved the best accuracy in four out of the five traits: 59,7% for'agreeableness', 60,6% for 'extraversion', 65,9%for 'openness to experience', 61,1% for 'neuroticism', and 60,1% for 'conscientiousness'.
In addition to the studies mentioned above, there are works where transliterations obtained from YouTube videos are considered as the input to the model in order to evaluate different personality traits. Our work is focused on the automatic evaluation of personality traits based on the transliterations provided in Biel et al. (2013) (see the Data subsection for further details). The authors that originally introduced the dataset extracted features from the texts using LIWC and TF-IDF features, which were extracted from bi-grams and tri-grams. The authors proposed an approach based on a Random Forest (RF) regressorto predict the label of each trait. The authors report coefficients of determination of 0,04, 0,18, 0,13, 0,31, and 0,17 for each trait in the OCEAN model, respectively. Later, also working with the same dataset, Sarkar et al. (2014) considered each trait as a separate bi-class problem (i.e., they performed the automatic classification of presence vs. absence of each trait). Their model was based on uni-gram BoW and TF-IDF features, and the classification was performed with a LR classifier. The average F1-score reported for the OCEAN traits was 60,1%, and the highest value was obtained for the 'agreeableness' trait (65,8%). A similar study was presented in Alam and Riccardi (2014), where the best result was obtained with part-of-speech (POS) tagging features, and the classification was performed using an SVM for each separate trait. In this case, the authors reported an average F1-score of 60,2% for the five traits in the OCEAN model, and the highest F1-score was 69,6% for 'agreeableness'.
Das-Kumar and Das-Dipankar (2017) considered transliterations from the same dataset and used 69-dimensional LIWC vectors to represent the texts. The authors reported accuracies of up to 62,3% to classify different traits of the OCEAN model. Sun et al. (2019) started to approach the problem of personality detection based on unsupervised learning methods. The authors reported RMSE values of 0,68, 0,69, 0,89, 0,77, and 0,69 for the OCEAN traits, respectively. More recently, also working with unsupervised methods based on the skip-gram algorithm, Guan et al. (2020) reported MAE values of 0,58, 0,57, 0,72, 0,67, and 0,60 for the same traits. In the same year, also working upon the same dataset with transliterations from YouTube vlogs, Salminen et al. (2020) considered 300-dimensional embedding vectors obtained from the Google-News Word2Vec pre-trained model. The authors created a neural network architecture that combined convolutional and recurrent layers to perform the classification of the traits.
The reported average F1-score value for the OCEAN traits was 54,74% .
Other works have addressed the study of personality considering different biosignals and also merging information in a multimodal approach. For instance, Mehta et al. (2020b) reviewed different machine learning methods according to the input modality, including text, audio, video, and multimodal. For the specific case of modeling personality through text, the authors mentioned that the labels are usually created through questionnaires and surveys. The authors also highlight the importance of data pre-processing to find better models that are more robust and stable. The authors also mention that open vocabulary methods (e.g., Word2Vec, GloVe, BERT) are more robust and have a better generalization capability than others based on a prior judgment of words or categories such as those that rely on lexicons or dictionaries (e.g., LIWC, SenticNet, or NRC Emotion Lexicon). Finally, the authors criticize the use of machine learning methods as the only way to model personality through text, given that those methods highly depend on the data used to train them.
Aiming to make progress in the field of automatic recognition of personality traits, in this study, we focused on extracting information from transliterations of the YouTube database presented in Biel et al. (2013). The proposed approach considers two classical word embeddings, namely Word2Vec and GloVe and state-of-the-art word embeddings obtained from the BERT-base and BERT-large language models. Machine learning systems based on support vector regression and support vector machines are used to estimate and classify the personality traits. Different performance metrics are included in the results. The rest of this paper is organized as follows: first, the methodology and database used in the paper are described; later, the experiments and the discussion of the results are presented; and, in the final section, conclusions and future work are presented.
Methodology
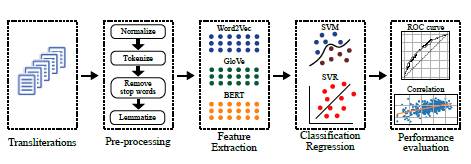
Figure 1 illustrates the main components of the implemented methodology. Details are included in the next subsections.
Data
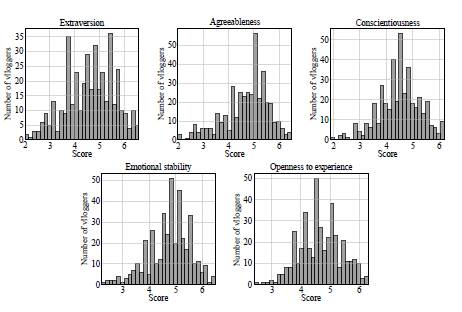
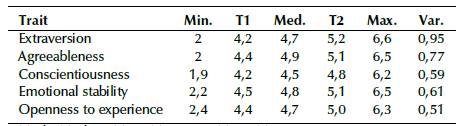
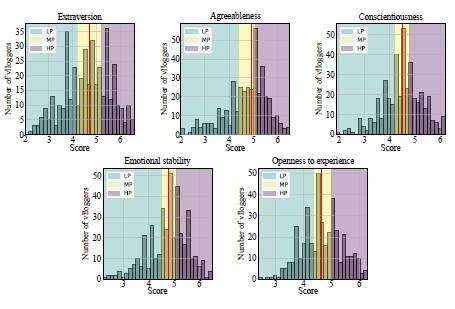
The dataset consists of manual transliterations of audiovisual recordings generated by 404 YouTube vloggers that explicitly show themselves in front of a webcam talking about a variety of topics including personal issues, politics, movies, and books. The corpus was originally presented in Biel et al. (2013). There are no content-related restrictions in the videos, and the language is natural, diverse, and informal. The transliterations contain approximately 10 000 unique words and 240 000 word tokens. The data is gender-balanced (52% female). The transliterations were originally produced in the English language, and the videos in the database were automatically labeled according to the five traits of the OCEAN model. The labeling process was performed using the Amazon Mechanical Turk (Buhrmester etal., 2016) and the Ten-Item Personality Inventory (Gosling et al., 2003). Figure 2 shows histograms with the scores assigned to each trait. Some statistical information on the scores is also provided in Table 1.
Pre-processing
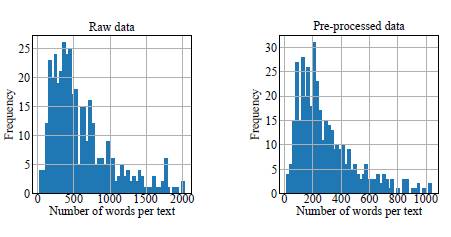
Before feature extraction, the data need to be cleaned and standardized in order to remove the 'noise' and prepare them for analysis. The steps followed during the text preprocessing include: i) removal of non-content words like 'xxxx', 'um', 'uh', and others; ii) conversion of all texts to lower case, removal of punctuation, numbers, and stop-words; and iii) lemmatization, which is applied to transform words into their root form. Figure 3 shows the number of words per text before and after pre-processing.
Feature extraction
One of the goals of Natural Language Processing (NLP) is to mathematically represent words of a text in a vector space. This vector representation is such that similar words are represented by nearby points. In this work, we consider three different techniques to create said vectors: Word2Vec, Global Vectors (GloVe), and BERT. Details of each model are presented below.
Word2Vec: Word2Vec considers information from nearby words to represent target words with a shallow neural network whose hidden layer encodes the word's representation (Mikolov et al., 2013). The network contains one hidden layer, whose dimension is equal to the embedding size, which is smaller than the one at the input/output vector. A softmax activation function is applied at the output layer, so that each element of the output vector represents the probability of a given word appearing in the context. Word embeddings are obtained from the hidden layerfollowingthe Continuous Bag of Words (CBoW) method, which considers information from the neighboring words to model the probability of the target word appearing in a given context. In this case, the input is the words around in the given context and the output is the target word. For example, assuming a context of 2 and 'drink' as the target word, in the sentence 'I will drink orange juice', the input would be 'I', 'will', 'orange', and 'juice', while the output would be 'drink'.
All inputs and output data have the same dimension and are coded as one-hot vectors. The length of the vector is equal to the size of the vocabulary in the corpus, which considers unique words. Typically, these unique words are coded in alphabetical order, that is, one-hot vectors for words beginning with 'a' are expected to have the target '1' in a lower index, while words beginning with 'z' are expected to have the target '1' in a higher index. Figure 4 shows the structure of the network for the CBoW method, where W Є ℝ VxN refers to the weight matrix that maps inputs Xi to the hidden layer, and W Є ℝ NxV is the weight matrix that maps outputs of the hidden layer to the final output layer. The neurons in the hidden layer copy the weighted sum of inputs to the next layer (i.e., linear activation function).
Source: Modified from Bellei (2018)
Figure 4 CBoW topology used in Word2Vec. x: one-hot vectors; V: size of the vocabulary; C: number of context words; h: hidden layer with N neurons, where N is also the number of dimensions to represent the word; y: one-hot vector for target word.
GloVe: The Global Vectors for Word Representation (GloVe) model creates word vectors by examining the cooccurrences of words within a corpus (Pennington et al., 2014). Before the model is trained, an X co-occurrence matrix is created, where each element Xij represents the frequency for the i-th word to appear in the context of the j-th word. The corpus is traversed only once to create the X matrix, and these co-occurrence data are then used instead of the corpus. Once X is created, the task is to generate the vectors in a continuous space for each word of the corpus. Vectors with a smooth constraint will be produced for each pair of words (w i , W j ):
where w i and Wj are word vectors and bi and bj are scalar biases associated with the i-th and j-th word, respectively.
This model creates word vectors with relevant information about how each pairof words coexist. The objective function of the optimization problem is called J, and it evaluates the mean square error of Equation 1, weighted by the function f:
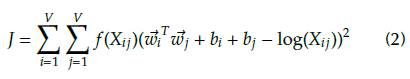
From Equation 2, f (Xij) is chosen in such a way that common word pairs are not considered (those with large Xij values) because they would deviate too much from regular words:
In Equation 3, xmax refers to the maximum co-occurrence value between the i-th and j-th word. When common word pairs are found (such that Xij > xmax), the function limits its output to 1. For all other word pairs, a weight in the range 0 - 1 is computed. The distribution of weights depends on a, which is a hyper-parameter that controls the sensitivity of the weights to increased co-occurrence counts.
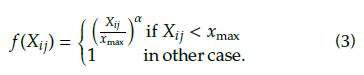
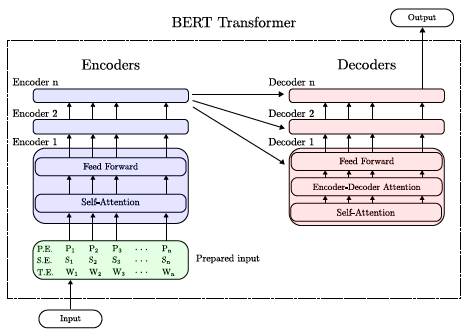
BERT makes use of transformers, which are attention mechanisms that learn contextual relations between words (or sub-words) in a text (Devlin et al., 2018). In its general form, a transformer includes two separate mechanisms: an encoder that reads the text input and a decoder that produces a prediction for the task. BERT allows both left and right contexts to influence many language representations that include word predictions (Devlin et al., 2018). To effectively train a bidirectional transformer, BERT uses two techniques called Masked Language Model (MLM) and Next Sentence Prediction (NSP). The transformer architecture comprises a stack of encoders and a stack of decoders, where the encoders are composed of a self-attention layer and a Feed-Forward Neural Network (FFNN). Encoders are identical in structure and are connected to decoders, which include all the elements present in an encoder, in addition to an encoder-decoder attention layer between the self-attention layer and the feed-forward layer. Figure 5 shows the architecture of the transformer in BERT.
Source: Modified from Alammar (2018)
Figure 5 Architecture of the transformer used in BERT.T.E: text embedding; S.E: segment embedding; P.E: positional embedding.
Pre-trained models were used for Word2Vec, GloVe, and BERT. For Word2Vec and GloVe, we considered the Python gensim module (Rehurek and Sojka, 2010). In the case of Word2Vec, the word2vec-google-news-300 model was employed, which was trained with Google News, with a corpus of around 100 billion words and a vector dimension of 300 (Mikolov, 2015). For GloVe, the model glove-wiki-gigaword-300 was employed, which was trained with the Wikipedia 2014 + Gigaword 5 corpus. In this case, there are 5,6 Billion tokens, a vocabulary of 400 000 words, and a vector dimension of 300 as well (Pennington, 2014). To obtain word embeddings based on BERT, we used the WEBERT Toolkit (Perez, 2020), which is a Python tool typically used to obtain pre-trained BERT embeddings in English and Spanish. To train the BERT word embeddings in the English language, the Multi-Genre Natural Language Inference corpus was used. We considered two different pre-trained BERT models: (i) BERT-base and ii) BERT-large, where the last layer (768 units for BERT-base and 1 024 units for BERT-large) was taken as the word-embedding representation.
Vector representations for each transcript are created per word, so that x Є ℝ 300 for Word2Vec and GloVe, x Є ℝ 768 for Bert-base, and x Є ℝ 1024 for Bert-large. Since texts correspond to spontaneous speech, they have a different number of words per individual. To obtain vectors of a fixed dimension per text, six statistics are computed along the vectors: mean, standard deviation, skewness, kurtosis, minimum, and maximum. The resulting feature matrix is given by X Є ℝ Nx1800 for Word2Vec and Glove, X Є ℝ Nx4608 for BERT-base, and X Є ℝ Nx6144 for BERT-large. Where N is the number of transliterations (N = 404).
Classification and regression models
Since Support Vector Machines (SVM) are one of the most used classification methods in the state of the art, and considering their robustness regarding high-dimensional representation spaces (Scholkopf et al., 2002), we decided to adopt this as our main framework for the classification and regression experiments. The following subsections provide some details of the mathematical background of the methods. However, we recommend that the reader refer to Scho lkopf et al. (2002) for a more comprehensive description of the methods.
Bi-class classification: In this case, the goal is to discriminate data samples by finding a separating hyper-plane that maximizes the margin between classes. Soft-margin SVMs allow errors in the process of finding the optimal hyper-plane. These allowed errors are data samples located on the wrong side of the hyper-plane but within the optimal margin. An example of a soft-margin SVM is shown in Figure 6.
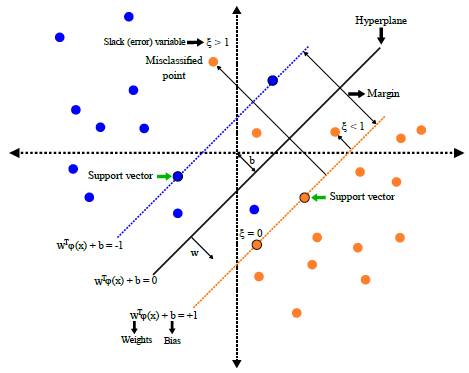
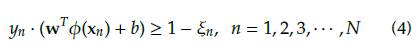
The decision function of a soft-margin SVM is expressed according to Equation 4, where ξn is a slack variable that penalizes the number of errors allowed in the optimization process; yn Є {-1, +1} are class labels; ϕ (xn) is a kernel function that transforms the feature space x into a higher dimensional space, where a linear solution to the problem can be found; and the weight vector w and the bias b define the separating hyperplane.
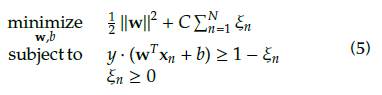
The optimization problem is defined in Equation 5, where the hyper-parameter C controls the offset between xn and the margin width. Samples xn that satisfy the condition of equality in Equation 4 are called 'support vectors' (xm).
Tri-class classification: We adopted the One vs. All approach (OvA, also called One vs. Rest, OvR). This method consists of building one SVM per class, which is trained to distinguish the samples of one class from the samples of all the other classes. The decision is made according to the maximum output among all SVMs (Milgram et al., 2006). This approach requires that each model predict a probability score per class. The max argument of these scores (class index with the highest score) is then used to predict a class.
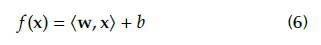
Regression: We implemented a Support Vector Regressor (SVR) to predict the value of each label assigned to the personality traits. An SVR is an extension of an SVM, where, instead of integer-valued labels, real-valued labels are predicted. Particularly, an ε-SVR aims to find a linear function f (x) where only samples outside the ε-radius 'tube' are penalized (Smola and Schölkopf, 2004) (Figure 7). The linear regression function f(x) is represented in Equation 6 as:
Source: Modified from Smola and Schölkopf (2004)
Figure 7 Linear SVR with ε-insensitive loss function
where (•, •) denotes the dot product and b Є ℝ. The resulting optimization problem is written as follows:
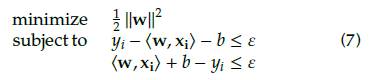
The assumption in Equation 7 is that the function f(x) exists and that the convex optimization problem is feasible. However, this is not always the case. Thus, similarly to the soft-margin SVM, one can introduce slack variables ξi and ξi* to cope with otherwise infeasible constraints of the optimization problem in Equation 7. The resulting optimization problem is as follows (Vapnik, 1995):
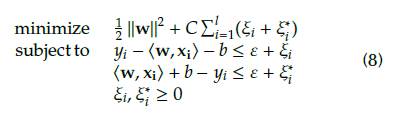
In Equation 8, the constant C > 0 determines the tradeoff between the flatness of f and the maximum allowed deviation ε. This corresponds to the so called ε-insensitive loss function |ξ|ε, which is described in Equation 9:
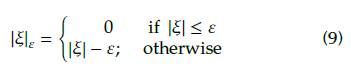
Figure 7 illustrates the concept. Note that only points outside the region between the dotted line (the 'tube') contribute to the cost. Deviations are linearly penalized, although it is possible to extend SVM to nonlinear functions (Smola and Schölkopf, 2004; Ranković et al., 2014).
Parameter optimization: For both SVM and SVR, Gaussian kernel and linear kernel were considered in our preliminary experiments. However since the results with the first one were better in most of the cases, only results with the Gaussian kernel are reported (see Appendix with results for the linear kernel). The hyper-parameters C, y, and £ were optimized through a grid-search up to powers of ten between 1 X 10⁻⁴ and 1 X 10⁴. A subject-independent 10-fold Cross-Validation (CV) strategy was followed in the training process, i.e., the data were divided into 10 groups (randomly chosen, but data from the same subject were never included in the train and test fold simultaneously). The CV strategy was repeated 10 times to evaluate the generalization capability of the model (Kohavi, 1995). The reported metrics correspond to the average and standard deviation of the ten repetitions.
Performance evaluation
The classification systems used in this work were evaluated with typical performance metrics including the confusion matrix (Powers, 2020). For the particular case of a two-class classification problem, the matrix is as shown in Table 2.
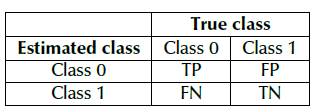
According to this matrix and taking class 0 as the target one, the following terms are defined:
True positive (TP) refers to the number of samples in class 0 that are correctly classified as class 0.
False negative (FN) corresponds to the number of samples in class 0 that are incorrectly classified as class 1.
False positive (FP) is the number of samples in class 1 that are incorrectly classified as class 0.
True negative (TN) is the number of samples in class 1 that are correctly classified as class 1.
Derived from the aforementioned terms, different performance measures are defined and taken into account, including accuracy (ACC), sensitivity (SEN), specificity (SPE), and the Fl-score (F1). Apart from the aforementioned measures, the receiver operating characteristic curves (ROC) were used as a graphical representation that summarizes the performance of binary-classification systems. The performance of the multi-class classification systems was evaluated with the Unweighted Average Recall (UAR) and Cohen's kappa coefficient (k).
The regression systems of this study were evaluated according to Spearman's correlation coefficient (p).
Additionally, to allow comparisons with different works in the literature that report results with different measures, we decided to include other metrics such as the Mean Absolute Error (MAE), the Root Mean Square Error (RMSE), and the coefficient of determination, R2.
Experiments, results, and discussion
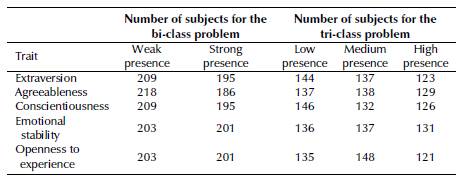
This section presents the three main experiments performed in this work: i) personality trait estimation according to the scores of the OCEAN model; ii) classification between weak presence vs. strong presence of each personality trait; and iii) classification of three levels in the manifestation of each personality trait (low, medium, and high). Before providing details of each experiment, the next subsection presents the details of the strategy followed to distribute the data, together with statistical analyses that evaluate the suitability of the proposed approach prior to training the classifiers.
Data distribution and statistical analyses
The personality trait estimation considers the values assigned to each sample for each trait. Their distribution per trait is presented in Figure 2, and the corresponding statistics are presented in Table 1. For the binary classification scenario, the scores of each trait are divided around their median, i.e., samples with values below the median are considered weak, while those above are labeled as strong. This distribution criterion allows for a balanced number of samples per trait. The median threshold is shown in Figure 8 as a red dotted line. The distribution of the data for the tri-class classification problem is made according to the tertiles of the distribution of the scores per trait. This strategy guarantees balance among the three resulting subgroups. The distribution of these three subgroups is shown in Figure 8 as the three shadowed regions. The number of samples per class and subgroup (two for the bi-class problem and three for the tri-class problem) is summarized in Table 3.
Source: Authors
Figure 8 Score thresholds for the bi-class and tri-class classification problems. LP: low presence; MP: medium presence; HP: high presence.
Two statistical tests were performed. The first one was the Kruskal-Wallis test regarding the feature matrices extracted per sample and trait. This test was performed for the two scenarios: weak vs. strong presence of each trait, and the three levels of manifestation of the traits. In all cases, the null hypothesis was rejected with p << 0,01. The second statistical test aimed to evaluate whether the gender of subjects biased the distribution of the extracted features. We performed x2 tests for both the bi-class and the tri-class scenarios. A possible bias regarding gender was discarded for the 'extraversion', 'conscientiousness', 'emotional stability', and 'openness to experience' traits, whereas a possible bias was found for the 'agreeableness' trait.
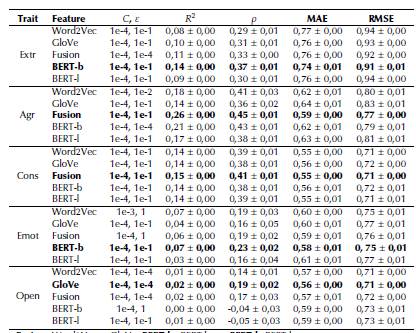
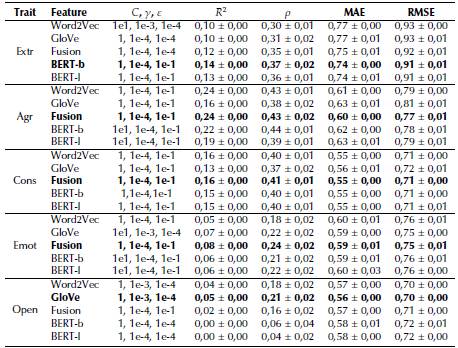
Experiment 1: personality trait estimation
This experiment was mainly based on SVR systems with Gaussian kernel. Experiments with linear kernel were also performed, and the results can be found in the Appendix. As mentioned before, to allow comparisons with respect to other works in the literature that use the same corpus as this study, the results are reported in Table 4 regarding the four metrics mentioned in the performance evaluation subsection, where the results in bold letters correspond to the best for each trait. Note that, in three out of the five traits, the best result was obtained when merging the Word2Vec and GloVe embeddings, except for the 'extraversion' trait, whose best result was obtained with the BERT-base embeddings, and 'openness to experience' whose best result was obtained with GloVe embeddings. When observing R 2 and p, the best result was obtained for the 'agreeableness' trait (R2 = 0,24 and p = 0,43), followed by 'conscientiousness' (R2 = 0,16 and p = 0,41). The worst result was for the 'openness to experience' trait, with R2 = 0,05 and p = 0,21. The lowest MAE = 0,55 was obtained with 'conscientiousness', and the lowest RMSE value was obtained with 'openness to experience', with a value of RMSE = 0,70.
Experiment 2: weak vs. strong presence of each trait
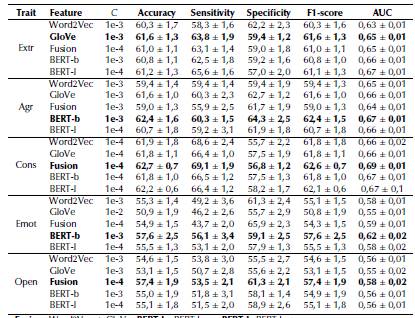
In this case, SVM classifiers with Gaussian kernel were used, and the results are reported in Table 5, where the results in bold letters correspond to the best for each trait. Note that four out of the five traits (all except 'openness to experience') obtained the best result when considering word embeddings based on BERT, three of them with the base model ('extraversion', 'agreeableness', and 'emotional stability') and the remaining one ('conscientiousness') with the large model. Furthermore, note that three out of the five traits exhibit accuracies above 60%. The best result was obtained for 'extraversion', with an accuracy of 64,7%, followed by 'agreeableness', with an accuracy of 64,3%, and 'conscientiousness', with 63,9%. As seen a few lines below, these results are similar to most of the results reported in the literature. The results also show that there is no a clear model that leads to the best results. This means that there is still a lot of work to be done in this field, which, apart from the challenge of extracting information from text, imposes an additional constraint due to the consistency of the labels, i.e., the evaluation of personality is very hard task for both humans and machines.
Table 5 Results for bi-class system: weak presence vs. strong presence of the trait
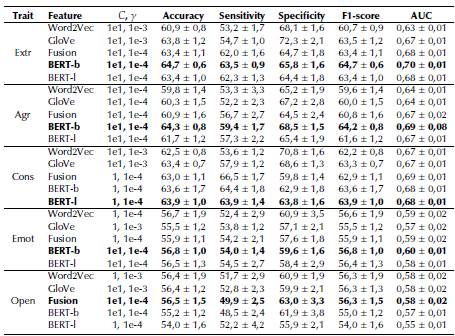
Fusion: Word2Vec + GloVe, BERT-b: BERT base; BERT-l: BERT large.
Source: Authors
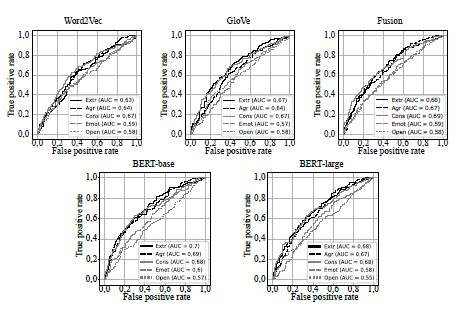
Results are shown more compactly in Figure 9, where the ROC curves resulting from the bi-class experiments are included. Each panel in the figure includes the results obtained with the three feature extraction approaches. The AUC values show that, in the majority of the cases, better results are obtained for 'extraversion' and 'conscientiousness', and also that the best AUC values are obtained by the Fusion of Word2Vec and GloVe embeddings, as well as by embeddings based on BERT.
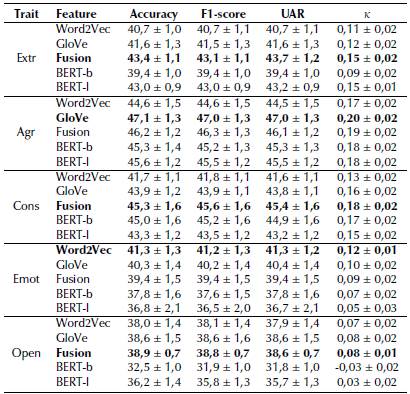
Experiment 3: classification of personality traits into three levels
Three groups were created according to the scores in the personality traits, as it was explained in the data distribution and statistical analyses subsection: LP (low presence), MP (medium presence), and HP (high presence). The results of the tri-class classification are presented in Table 6 in terms of accuracy, F1-score, UAR, and k, where the results in bold letters correspond to the best for each trait. Note that, in four out of the five traits, the best results were obtained with the Fusion of Word2Vec and GloVe embeddings. Only in the case of 'conscientiousness' was the best result obtained with Word2Vec. It can also be observed that the models trained with BERT embeddings did not improve the performance of the models in comparison with the classical word embeddings (Word2Vec and GloVe) in any of the OCEAN traits. However, with a close look at the numbers, one can notice that the difference among different approaches is not that high, and the results are similar across different traits, i.e., between 40 and 46%.
Table 6 Tri-class classification results
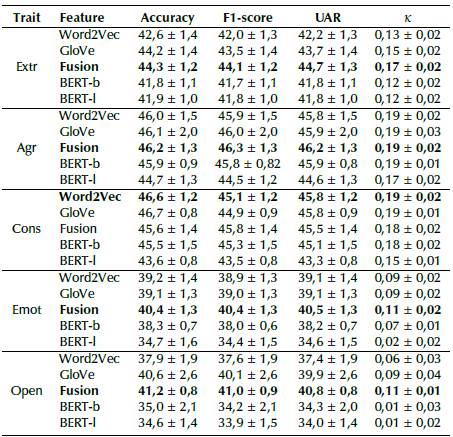
Fusion: Word2Vec + GloVe; BERT-b: BERT base; BERT-l: BERT large.
Source: Authors
To facilitate a detailed look at the results, confusion matrices are presented in Table 7, where, again, the results in bold letters correspond to the best for each trait. The results do not show a clear pattern when comparing the three trait levels. One would expect to see a relatively clear separation between LP and HP samples. However, in all cases, the target class shows the largest percentage, but the remaining portion is almost always equivalently distributed between the other two classes. Even though the models presented in this study could be improved, while also acknowledging that the addressed problem is very challenging, the behavior of the observed results may reflect possible labeling problems. We believe that there is a big gap in the study of personality traits based on linguistic patterns, which makes it necessary to work on collecting and labeling data considering the knowledge of expert psychologists and psycholinguists (Sun et al., 2019; Guan et al.,2020).
Table 7 Confusion matrix for the classification of personality traits into three levels (results in %)
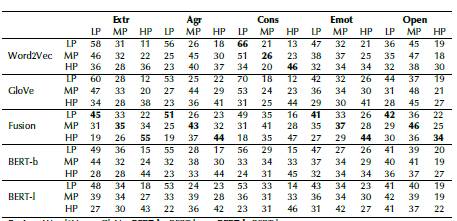
Fusion: Word2Vec + GloVe; BERT-b: BERT base; BERT-l: BERT large.
LP: Low presence; MP: Medium presence; HP: High presence.
Source: Authors
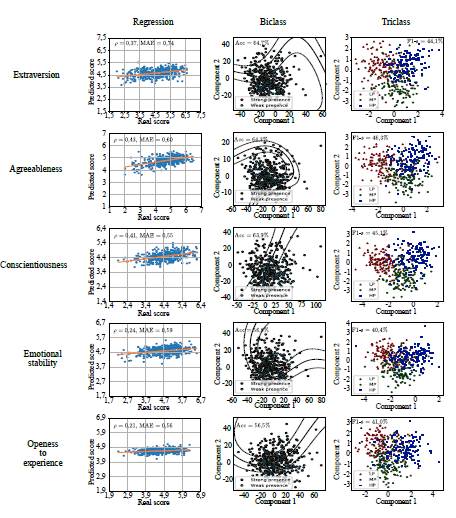
The best results obtained throughout the regression and classification experiments are summarized in Figure 10. The first column of sub-figures shows the regression results. It can be observed that the regressor is doing a good job, especially in the first three traits, where Spearman's correlation is above 0,35. In the second and third columns, the resulting representation spaces from the bi-class and tri-class scenarios are shown, respectively. Note that, in these two cases, the Figures illustrate the result of applying a dimensionality reduction based on Principal Component Analysis (PCA). In the bi-class scenario, the hyper-planes shown in the Figure correspond to those found with the optimal parameters of the SVM, i.e., using the parameters reported in Table 5. Notice the high dispersion of the samples along the representation space. This is one of the reasons for the low accuracies found in the classification experiments. Finally, the tri-class scenario is shown in the third column of sub-figures, where three different colors are used to represent the three classes (LP, MP, and HP). These are also representations resulting from the PCA projection of the feature space. Even though the results appear to be low, the representation spaces show that the three sub-groups are found. These results, as well as the summarizing Figures, motivate us to continue working on this topic considering other approaches from fields such as language features and deep learning.
Comparison with recent works
The results reported in this study were compared with respect to different works in the state of the art. We did not find any study working on the tri-class classification problem, so comparisons are only reported for regression and the the bi-class results.
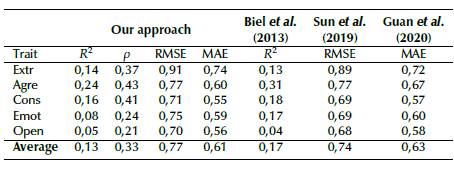
The summary of our regression results and those reported by others in the literature are included in Table 8. According to the average results reported in the last row of the table, our approach shows similar performance to others reported in the literature. Our results are in fact better with regard to the MAE value in about 0,02. Now, in the case of RMSE, our results are 0,03 below (worst) and 0,04 below (worst) with respect to the previous result reported for R2. Although other works in the literature did not report results for Spearman's correlation, we decided to examine it because this measure is more intuitive, especially when the 'actual vs. predicted' plot is shown (Figure 10).
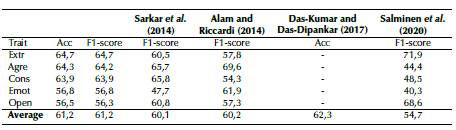
The comparison regarding the bi-class classification scenario is reported in Table 9. Note that, on average, our results are slightly better than the other works, except for those obtained by Das-Kumar and Das-Dipankar (2017). Unfortunately, the authors of that work only report the average accuracy along with the five traits, which does not allow for direct comparisons in specific traits. If we consider the average performance in terms of the F1-score compared to the performance reported by Salminen et al. (2020), we were able to improve the performance by 6,5%, which is relevant considering that we did not use neural networks. This gives us an idea that, for certain traits ('agreeableness', 'conscientiousness', and 'emotional stability'), classical methods such as those used in this paper (SVM with Gaussian kernel) yield better results than those found with other methods like the one reported by Salminen et al. (2020).
Conclusions and future work
This work considered the transliterations of multimedia recordings obtained from YouTube and explored the use of three word embedding methods (Word2Vec, GloVe, and BERT) to model the five different personality traits included in the OCEAN model. Standard regression and classification methods were considered to facilitate the analysis regarding the embedding methods. Three different evaluation scenarios were presented in this work: i) estimation of the personality scores by creating a regression system, ii) automatic classification of the strong vs. weak presence of each personality trait, and iii) the classification of three levels of personality traits. According to our findings in the regression experiments, Spearman's correlation coefficients ranging from 0,21 to 0,43 were obtained between the predicted personality scores and the ones assigned by the labeling system. Other performance measures such as MAE, RMSE, and R 2 were also reported to allow comparisons with respect to other studies in the state of the art. The classification between strong vs. weak presence of the traits shows that the accuracy and F1-score of the proposed approach are in the same range as those reported in the literature, and, in some traits ('extraversion', 'conscientiousness', and 'emotional stability'), our results outperform those of previous works in terms of the F1-score metric. Finally, the classification of three levels of personality traits (low, medium, and high) shows accuracies between 40,4 and 46,6%.
In general terms, our findings suggest that Word2Vec and GloVe embedding methods may be combined to obtain better results, and that the addition of the BERT-base and BERT-large models did not improve the performance in regression or in tri-class classification experiments. However, they considerably improved the performance in the two-class classification experiments with respect to the performance of the models based on Word2Vec, GloVe, or a fusion of both. It can also be concluded from the results that models based on word embeddings obtained with BERT-base generally outperform models based on word embeddings with BERT-large, which is in line with the work by Mehta et al. (2020a), who found that the use of a larger linguistic model does not always result in a better performance. Further research is required to increase the results. Additionally, although the use of the data and labels considered in this work is relatively standard, we believe that there is also a big gap that needs to be filled in the labeling process. We are aware of the fact that these processes are expensive, time-consuming, and require sophisticated knowledge (especially from psychologists); joint efforts are required to create realistic databases labeled with more natural personality scores.