


 Inglês (pdf)
 Artigo em XML
 Referências do artigo
 Enviar este artigo por email
 Citado por SciELO
  Citado por Google
  Similares em
SciELO
Similares em
SciELO  Similares em Google
 Permalink
Introduction
Cocoa beans are the main raw material in chocolate manufacturing. The beans originate as seeds in fruit pods of the tree Theobroma cacao, which is cultivated in plantations in tropical regions around the world (Ardhana and Fleet, 2003). The quality of the cocoa beans determines their price: the better the quality, the higher the price. This quality is defined by a set of physical, chemical, and hygienic qualities, as well as those perceived by the senses (sensory qualities, such as the flavor and odor of the beans), which make them acceptable to the chocolate Industry and the consumers (Aguilar, 2016).
The fermentation of cocoa beans consists of heaping them together for several days in order to allow microorganisms to decompose the mucilage (the white sweet pulp surrounding the beans), increasing the temperature to produce the death of the embryo and initiate the biochemical changes and enzymatic reactions inside it, which will be responsible for the formation of the precursor compounds of chocolate flavor (Cubillos et al., 2008). The higher the percentage of fermented beans and the lower the number of violet, slaty, and over-fermented beans, the better the flavor of the cocoa, which will also be more pleasant. This results in cocoa that is less acidic, less astringent, and less bitter or free of undesirable flavors (Aguilar, 2016). To evaluate the degree of fermentation and determine the percentage of fermented beans (FB), a cut test is carried out. 300 beans are opened or cut lengthwise through the middle, so as to expose the maximum cut surface of cotyledons. Both halves of each bean are visually examined in full daylight or equivalent artificial light. Each defective type of bean is counted separately, and the result for each kind of defect is expressed as a percentage of the 300 beans examined (INACAL, 2016). This test identifies beans that are visibly moldy, slaty (i.e., unfermented), infested, germinated, or flat (i.e., containing no nib or cotyledon) (Beckett, 2017). However, the cut test is considered to have a low precision, as it depends on lighting quality and the evaluator's knowledge and visual perception of color. In addition, the color can change due to factors that favor oxidation such as storage time and prior moniliasis attacks (Aguilar, 2016).
Several methods to measure the degree of fermentation of cocoa beans have been proposed, such as the use of spectrophotometry (Gourieva and Tzerevitinov, 1979; Afoakwa et al., 2012), the application of 1H NMR spectroscopy combined with chemometrics (Caligiani et al., 2014), the determination of ammonia nitrogen contents by near infrared spectroscopy or NIRS (Hue et al., 2014), and a cocoa quality index (CQI) based on adaptations of the quality index developed for soils (Araujo et al., 2014).
Electrical conductivity through an ionic solution is determined by means of the movement of ions. There are different factors that may affect electrical conductivity tests, namely the seed moisture content, which influences the leakage rate of the compounds; the soaking temperature, which greatly influences the amount of solutes leaking from seeds soaked in water; the length of the soaking period, since the leakage from the seeds first increases rapidly and then levels off; and the presence of empty seeds, given that abnormal seeds leak as much (or as little) as normal ones (Sorensen et al., 1996). Some reports and conditions to measure electrical conductivity (EC) in seeds are: Ricinus communis L. with 220 µS/cm using distilled water with a 20-hour soaking time (Cárdenas-Ruiz, 2020); Chenopodium quinoa Wild from 227,8 to 298,0 µS cm-1g-1 using 50 ml deionized water with a 2-hour soaking time (Farias-Menegaes, 2021); and Solanum melongena L. with electrolyte releases of 0,48 µScm-1g-1 per hour for 100 seeds with a 6-hourimbibition time (Aramendiz-Tatis et al., 2017).
This method can be adapted because it is based on checking the level of integrity of the cell membranes in the tissues that constitute the seeds. As the fermentation of the cocoa beans progresses, electrolytes develop, and these suffer a loss of cellular content when exposed to an aqueous medium, which produces an increase in the EC of the leachate.
To justify the use of the EC test, the main objective of this research was to determine whether there is a relationship between the EC values of cocoa bean leakage and their fermentation index.
Methodology
Ripe and healthy cocoa pods of the CCN 51 cultivar were used. These samples were obtained from the Uchiza district of the Tocache province in the region of San Martín. The ripe cocoa pods were harvested manually by making a clean cut through the stalk with a well sharpened blade. Then, the harvested pods were carefully cut with a machete while avoiding damaging the cocoa beans. The wet beans were removed from the cut pods by hand, separating the damaged beans. The healthy wet cocoa beans were placed in plastic containers and transported to wooden boxes, covering them in order to avoid external contaminants (dust, soil, leaves, insects, etc.)
The fermentation was carried out by filling a wooden box with 300 kg of wet cocoa beans, covering them with banana leaves and leaving them to ferment for six days. The bean mass was turned by transferring it from one box to another at 48, 72, 96, and 120 hours. 2 kg samples of beans were taken for each day of fermentation. The fermentation temperature was controlled by placing a thermometer 10 cm deep into the bean mass. The end of the fermentation was determined by measuring the pH of the grain (final pH = 5,5) which, added to the decrease in the fermentation temperature, indicated the end of the process (Portillo et al., 2011). The fermentation was carried out in triplicate for each lot.
After each sampling time, the cocoa bean samples with 0, 1, 2, 3, 4, 5, and 6 days of fermentation were dried in the sun using wooden pallets with a polypropylene cover in order to avoid direct sunlight exposure. The thickness of the cocoa bean layer was 5 cm, and it was stirred with a wooden rake once every hour (so that the beans would not stick together) until the moisture content was between 6 and 7% (5-7 days). The samples of the dry cocoa beans with 0, 1, 2, 3, 4, 5, and 6 days of fermentation were packed in polyethylene bags and labeled, indicating the duration of fermentation and lot number.
Percentage of fermented beans (FB)
The FB was determined via the cut test, according to the Peruvian Technical Standard NTP - ISO 1114: 2011 (INACAL, 2016). A total of 300 beans were cut lengthwise through the middle in order to expose the maximum cut surface of the cotyledons. Both halves were examined in full daylight and placed in one of the following categories: purple, pale purple, brown, slaty, germinated, and moldy. The value of the FB that represents the ratio of well-fermented (brown) beans with respect to the 300 beans analyzed in the cut test was calculated by means of Equation (1).
Electrical conductivity (EC)
The EC test, adapted from Sorensen et al. (1996), was conducted on two presentations (whole and cut) and three quantities (15, 20, and 25) of cocoa beans. Cocoa beans were weighed in an analytical balance with a 0,01 g precision. Then, the beans were washed in deionized water for 10 s, placed into containers holding 400 ml of deionized water, and left to soak for a period of 24 h at 25 °C. As for the cut beans, a longitudinal cut was made with a scalpel before soaking. A control with 400 ml of deionized water accompanied each battery. The containers were covered during soaking in order to avoid the evaporation and contamination of deionized water. After soaking, the solution was homogenized, and the EC was measured with an Inolab Cond Level 2P conductivity meter. Finally, the EC of the cocoa beans was determined via Equation (2):
where EC B is the EC of cocoa bean (µ.S cm-1g-1), EC L is the EC of the soak solution (µ.S cm-1), EC C is the EC of the deionized water (µ.S cm-1), and w is the weight of the beans in grams.
Statistical analysis and experimental design
Statistical analysis was performed using the Statgraphics® Centurion XVII software. In the first phase, the effect of the duration of fermentation on the FB and EC of cocoa beans was studied. For FB, a randomized complete block design (RCBD) was used, where each lot (1, 2, and 3) represented a block. The study factor was the fermentation time (0, 1, 2, 3, 4, 5, and 6 days). Three replicates were carried out with a p-value < 0,05. The study of the EC of whole and cut beans was performed using a 3 x 7 x 3 factorial design with experimental factors such as the number of beans (15, 20, and 25), the days of fermentation (0, 1, 2, 3, 4, 5, and 6), and the lot number (1, 2, and 3). Three replicates were carried out with a p-value < 0,05. The data were subjected to the Tukey test for comparing the means between the number of beans, the days of fermentation, and the production lots.
In the second phase of this research, the data obtained for 15, 20, and 25 whole and cut beans of the three lots were studied, analyzing the correlation between the FB and EC of the cocoa beans. Here, the FB was defined as an independent or predictor variable, and the EC as a dependent or response variable. The EC values of the cocoa beans were subjected to an analysis of variance (ANOVA) in order to verify the existence of a statistically significant relationship with the FB, using a p-value < 0,05.
Results and discussion
The FB values of cocoa beans for each day of fermentation are presented in Figure 1. It can be observed that the FB increase has two stages. The first one stands out for a rapid increase from 0,00 to 46,37% in beans fermented for two days, possibly because the first two or three days of fermentation are characterized by a successive growth of various microorganisms (Ardhana and Fleet, 2003), whose intense metabolic activity causes biochemical reactions leading to a considerable increase in the percentage of fermented beans (Rivera et al., 2012). The second stage was characterized by a slow increase in the FB, from 46,37 to 89,70%, as the beans were fermented for more days. According to Schwan and Wheals (2004), on the third day of fermentation, the high temperatures reached by the cocoa mass cause the inhibition of acetic acid bacteria, resulting in a decrease in microbial activity.
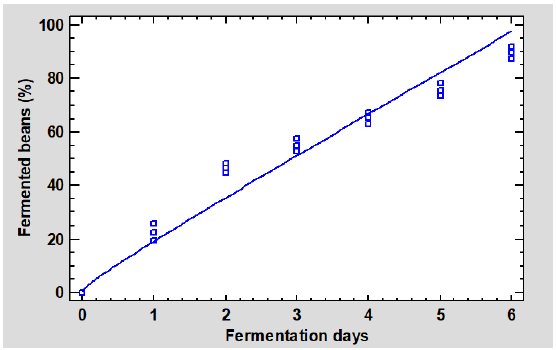
The beans fermented for four or more days reached a FB above 60%, which guarantees a good cocoa flavor development (Afoakwa et al., 2012). Otherwise, the products made with these beans would be bitter, astringent, or lacking the chocolate flavor (Jalil and Ismail, 2008).
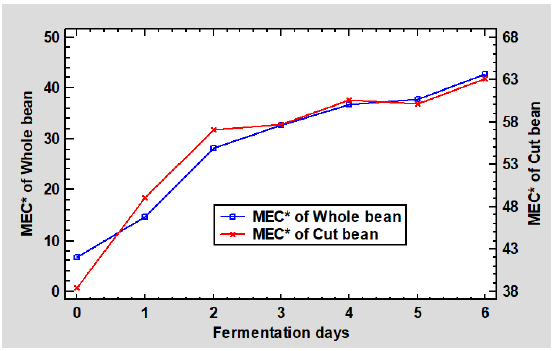
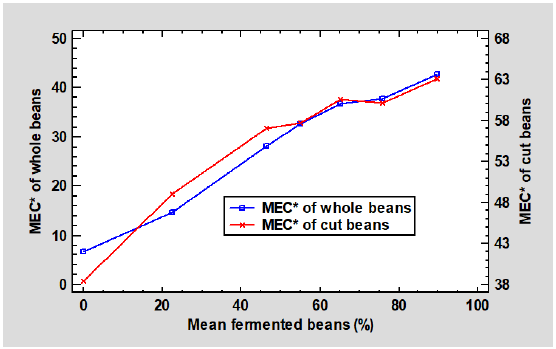
The effect of the duration of fermentation on the EC value of cocoa beans, either whole or cut, was also evaluated. As seen in Figure 2, the EC of cocoa beans showed significant differences according to the duration of fermentation. In whole beans, the EC value increased from 6,86 µS cm-1 g-1 (unfermented beans) to 42,73 µS cm-1 g-1 (six days of fermentation), while, in cut beans, this value increased from 38,45 µS cm-1 g-1 (unfermented beans) to 63,16 µS cm-1 g-1 (six days of fermentation). Figure 3 shows a relationship between the EC of whole and cut cocoa beans and the FB. As the beans absorb water during imbibition, there is a rapid release of solutes such as sugars, organic acids, ions, amino acids, and proteins into the surrounding medium (Ouyang et al., 2002; Fessel et al., 2006). In this sense, the amount of leached ions is inversely proportional to the integrity of the grain cell membranes (Arámendiz et al., 2017). Therefore, the increase in the EC of cocoa beans indirectly reflects the extent of the damage caused to the cell membranes of the beans as a result of deterioration (Abreu et al., 2011).
Source: Authors
Figure 2 Variation of the EC of whole and cut cocoa beans for each day of fermentation. MEC* = Mean Electrical Conductivity (µS cm-1 g-1).
Source: Authors
Figure 3 Variation of the EC of whole and cut cocoa beans regarding the FB. MEC* = Mean Electrical Conductivity (µS cm-1 g-1)
The deterioration of the cotyledon of cocoa beans is a consequence of fermentation, since it contributes to structural changes such as the removal of the compartmentalization of enzymes and substrates with notable swelling and key changes in cell membranes which facilitate enzyme and substrate movements through the cocoa cotyledon (Afoakwa et al., 2008). During drying, intracellular spaces (pores) previously occupied by water are replaced by air or are compressed as result of shrinkage (Zabalaga et al., 2016), thus causing an increase in the number of damaged cells (de Brito et al., 2000). Koua et al. (2017) report an increase in cocoa bean porosity from 15,82 to 24,67% with a decrease in moisture content. In other words, the volume of water removed was greater than the cocoa bean volume reduction during drying.
Everything seems to confirm that the increase in the EC value of cocoa beans is due to the rupture of the cotyledon cell walls as the fermentation progresses, which is consolidated with the increase in porosity during drying. As reported by Zambrano et al. (2010), regardless of whether it is a Criollo, Trinitario, or Forastero cocoa bean, if it is well fermented, the cotyledon will have cracked, which implies an increase in its permeability, and therefore in the number of leached electrolytes (dos Santos and de Paula, 2005).
The EC values of the cut beans were higher than whole beans since the maximum surface of cut beans cotyledons were exposed to deionized water. In addition, splitting cocoa beans in halves implies the rupture of their shell, which plays a fundamental role, given that its microstructure, thickness, and number of pores may affect the levels of leakage during imbibition, and therefore the value of EC (Borji et al., 2007).
The effect of the number of beans used in the EC test was also evaluated for the same fermentation days (0 to 6). As shown in Table 1, the ANOVA demonstrated that there are statistically significant differences between using 15, 20, and 25 whole or cut cocoa beans. According to the results, increasing the number of beans slightly reduces the EC value. In fact, Brouwer and Mulder (1982) assure that, in a conventional conductivity test, a bean was surrounded by other leaching beans, which increased the local concentration of the leachate to high levels, thus slowing down the leaching process. Artola and Carrillo-Castaneda (2005) evaluated the effect of the number of birdsfoot trefoil seeds on the EC value without finding conclusive results, as increasing this number from 50 to 100 seeds caused an increase in the EC. However, when increasing the number from 200 to 1 000 seeds, there was a reduction in EC.
Table 1 Variation in the EC of whole and cut cocoa beans according to the number of beans used
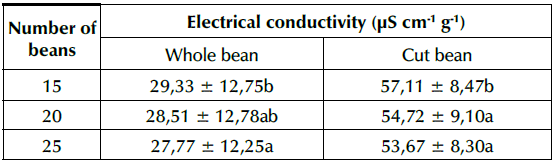
Different letters in each column indicate significant differences (p < 0,05)
Source: Authors
By means of Tukey's HSD test, it was determined that using 20 whole beans in EC test is statistically (p<0,05) equal to using 15 or 25 beans. In the case of cut beans, no statistically significant differences (p<0,05) were found between using 20 and 25 beans, unlike using 15 beans.
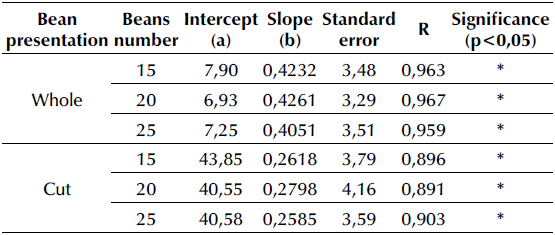
It has been shown that the FB and EC of beans are influenced by the duration of fermentation. With the objective of obtaining a general model for each presentation (whole and cut) and the quantity of beans (15, 20, and 25) the reported values of the three lots were integrated. The linear models obtained for whole and cut beans are presented in Table 2. The relationship between FB and EC was significant in all cases (p<0,05); it was strongly positive (0,8 < r < 1) according to the classification established by Nieves and Domínguez (2009). The models describe a different increase in the EC of whole and cut beans as the fermentation progresses, perhaps because whole beans have a relatively intact husk at the beginning of the process, which limits the migration of ions to the solution, and, as deterioration progresses, the number of ions in the solution increases. In the case of cut beans, the migration of ions to the solution is more accentuated because the interior is more exposed, which results in a high EC value.
Table 2 Models of the correlation of the FB and the EC of cocoa beans with each presentation and number of beans
Source: Authors
The standard statistical error obtained in whole bean models is lower (3,29-3,51) than that of cut bean models (3,594,16). Moreover, it expresses the deviation that the EC can have for an FB value in upper and lower limits.
It is worth mentioning that the variability left explained by the regression models is due to chance or the existence of hidden variables that influence the response variable (Nieves and Domínguez, 2009). In this research, the difference in the proportion of slate and purple beans at the same FB, as well as the difference in the degree of fermentation of each bean, could constitute some of these hidden variables.
There is a linear relationship between the EC of the beans and the FB, being stronger in the case of whole beans, which have a higher correlation coefficient and a lower standard error. Thus, the existence of a mathematical relationship between these two variables represents an opportunity to develop a quick and more analytical method to evaluate the degree of fermentation of cocoa beans.
Conclusions
Finding the number of whole and cut cocoa beans necessary for the determination of electrical conductivity in aqueous solutions -as well as the relationship between this electrical property and the percentage of fermented beans- opens the possibility of establishing a more effective method to determine the degree of fermentation reached, which surpasses the current cutting method.

