


 Inglês (pdf)
 Artigo em XML
 Referências do artigo
 Enviar este artigo por email
 Citado por SciELO
  Citado por Google
  Similares em
SciELO
Similares em
SciELO  Similares em Google
 Permalink
Introduction
Knowing the current situation of Colombia with regard to the available energy resources and the need to supply an energy basket that tends to increase over time, with rates ranging between 1,50 and 4,10% (Cortés and Londono, 2017), the electrical energy demand would theoretically become greater than the supply of the electrical energy in 2021 (Ministerio de Minas y Energia - Unidad de Planeación Minero Energética, 2017). In this regard, the development of versatile and flexible energy systems that can guarantee energy availability is required. One option that may be useful is the integration of energies from renewable sources to the National Interconnected System (NIS).
In line with the above, the Colombian energy plan contemplates the diversification of the energy matrix with renewable energy resources, ensuring a timely, reliable, safe, and efficient supply to the entire society and, in turn, contributing to the reduction of greenhouse gas emissions and the mitigation of the climate change. In the country, despite the fact that there are capabilities for generating electricity from non-conventional sources of renewable energy (NCSRE), mainly systems that take advantage of wind and solar energy, the interest of the national government is to increase the participation of NCSRE in the energy matrix in order to improve the resilience to climate variability events such as El Nino phenomenon and the natural cyclical periods of rains and droughts (Rueda-Bayona et al., 2019; Gómez-Navarro and Ribó-Pérez 2018). For this purpose, the Ministry of Mines and Energy (MME) of Colombia, through Resolutions 40590, 40591, and 40725 of 2019, put the Mining and Energy Planning Unit (UPME) in charge of carrying out the implementation and execution of the auction of long-term energy contracts CLPE No. 02-2019, in which only generation projects from NCSRE could participate.
According to the aforementioned auction reports, the total energy allocated was 10 186,00 MWh/day out of the 12 050,50 MWh/day of the target demand, and responsibility was assigned to seven companies generating energy with eight NCSRE projects, out of which five were wind projects and three were solar. 17,39 and 82,61% of the total assigned energy corresponded to the generation from photovoltaic solar energy and wind energy, respectively. A maximum sale price of $110,00/kWh is expected. After the inclusion of the new NCSRE projects, in 2022, the country will go from less than 60 MW to more than 2 250 MW of the installed capacity in renewable energy. Currently, Colombia has an installed wind capacity of 19,50 MW through the Jepirachi project. However, given the fact that the Energy and Gas Regulation Commission (CREG) issued Resolution 060 of June 20th, 2019, by which the operating regulations for solar and wind energy projects were modified, the Jepirachi project was found to not comply with the new quality specifications. Under this scenario, in January 2020, the project suspended the delivery of energy to the NIS. Nevertheless, in July 2020, Jepirachi resumed its operation because Empresas Públicas de Medellin (EPM) issued a requirement to the National Government for enabling the project to continue generating energy temporarily until the end of the park's useful life, which is estimated to be in 2023.
Considering that, in Colombia, 15,00%, of the energy will be expected to come from NCSRE to provide flexibility and complementarity to the NIS by 2030, the identification of potential sites where generation projects could be developed is of utmost importance in order to contribute to the mitigation of the risks related to deficits in the energy basket. Even though the Colombian wind resource is not characterized by being one of the best ones in terms of energy density, the wind resource available in certain areas located in the department of La Guajira, as well as in a large portion of the Caribbean region, in the department of Norte de Santander, and in the coastal strips can be adequately used to increase the installed capacity of the country with regard to renewable energy. In the case of La Guajira, trade winds have average velocities close to 9,00 m/s and a prevailing east-westward direction (Rueda-Bayona et al., 2019; Gómez-Navarro and Ribó-Pérez, 2018). Although the department of Antioquia has lower wind velocities, it can be also attractive to increase the installed capacity, taking into account that it has the necessary electrical infrastructure to distribute the produced energy to the consumption centers. Therefore, this work aims to determine the potentially available wind energy in the department of Antioquia, specifically in the Gulf of Urabá, in order for it to be used in the generation of electricity. In this regard, by involving non-conventional sources, the risk of an energy deficit, as foreseen in the projections made by the UPME, would be mitigated.
In the literature, there are different approaches to study the wind energy potential of a specific area, such as the wind atlas analysis and application programs, as well as Rayleigh and Weibull distributions. However, the most used method for assessing the wind energy potential is the Weibull distribution of wind speed data studied within multiple temporal scales (Chandel et al., 2014; Solyali et al., 2016; Dayal et al., 2021; Mohamadi et al., 2021). This assessment is an imperative step in the prediction of the annual electrical energy production from the wind energy in potential areas in order to verify whether there are enough wind resources within the area to justify further site-specific investigations, determine initial feasibility and cash flow projections, and obtain representative data for estimating the performance and/or the economic viability of the selected wind turbines.
For this reason, in this study, the wind energy potential of the Gulf of Urabá is assessed using the Weibull method, particularly at a specific location in the maritime area, by utilizing detailed wind variables such as the direction, speed, availability, and continuity of the wind resource.
Methods and materials
Wind velocity distribution
The wind is an intermittent renewable resource (both geographically and temporally), i.e., it fluctuates due to weather patterns and cloud presence, and it cycles from day to night depending on many factors. Among them, it is important to note that the wind velocity varies with altitude and is a function of the nature of the soil over which the air masses move (Nedaei et al., 2018; Li et al., 2016; Ohunakin, 2011; Boopathi et al., 2021 ). Consequently, the production of electricity is variable and does not follow the same pattern as the demand. For example, in the case of wind energy, electricity generation is sometimes higher at night, when the demand for electricity is lower. Therefore, the incorporation of these systems requires the development of auxiliary systems of energy use and/or storage.
Depending on the intensity and periodicity of the wind, the technical and economic feasibility of using wind energy to generate electricity can be estimated. Some locations are not profitable enough for the development of an electric power generation project with the available wind resource (Nedaei et al., 2018; Li et al., 2016). In this regard, the development of a technical and economic study is of utmost importance in order to evaluate whether the projects are competitive in comparison with conventional generation sources. In this regard, choosing a proper site for the installation of wind farms must be conducted. In many cases, potential installation sites are often located in remote areas, far from large consumption centers. Thus, transmission lines must be built to transport electricity from the wind farm to the consumption centers, a situation that can result in increased production costs and financial infeasibility for the generation project.
Even though there are initiatives by entities, such as the UPME and the Institute for Hydrology, Meteorology, and Environmental Studies (IDEAM) in Colombia to provide information on the characterization of the wind resource as a first approximation for investors interested in its use, few public studies detailing this resource and other NCSRE that can help plan its adequate applicability are reported. In line with this, this research evaluates potential sites in the department of Antioquia, where electricity generation projects can be developed from the wind potential.
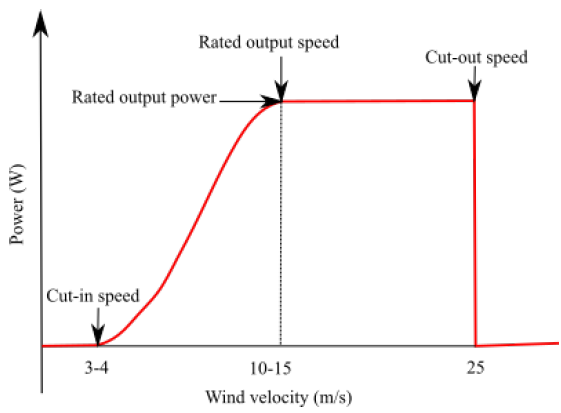
The ideal cut-in wind velocity of wind turbines is typically between 3,00 and 4,00 m/s. Nevertheless, a nominal wind velocity (rated wind velocity) is required for the turbine to generate electricity at its own maximum or nominal capacity. This velocity ranges from 10,00 to 15,00 m/s. Finally, at the cut-out wind velocity, which is in the order of 25,00 m/s, the turbine turns off to avoid damage. When the cutting velocity is exceeded, the controllers place the blade in the flag position to enable the wind to pass through and brake the rotor hub. The wind generally has to return to a much lower velocity -the so-called cut-back wind velocity in wind turbines- for a certain time before the turbine restarts. This velocity is about 20,00 m/s (Abdulgalil et al., 2019; Tummala et al., 2016). The change of the power output of a wind turbine along with the wind velocity is represented in Figure 1.
To initially identify potential sites in Antioquia, the wind velocity maps made available by IDEAM identify the areas with average wind velocities equal to or greater than 5,00 m/s, where wind turbines could be installed in order to transform the wind kinetic energy into rotational mechanical energy and, subsequently, into electrical energy (Siabato-Benavides, 2018). Thus, the annual average distribution of wind velocities in the department of Antioquia, according to the IDEAM interactive atlas, is illustrated in Figure 2. As it can be observed in said Figure, there is only one area in Antioquia where the annual average velocities exceed 5,00 m/s, and it is located in the coastal and maritime zone of the Urabá region.
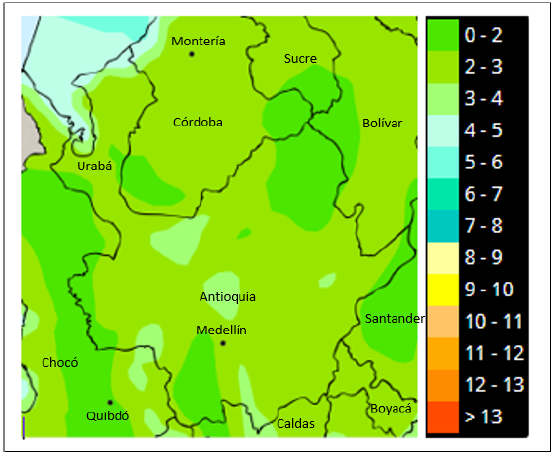
Source: Gómez-Navarro and Ribó-Pérez (2018)
Figure 2 Map representing the annual average of the wind velocity distribution (m/s) in the department of Antioquia for 2015
The area value of this region estimated using Google Earth Pro software is 7 684 338 660,59 m2. In Figure 3, the annual average velocities are found to vary between 7,00 and 8,00 m/s in some locations of the coastal region, whereas these velocities are ranged between 8,00 and 9,00 m/s in other areas. The same can be observed for the maritime zone.
In order to carry out a more accurate estimation of the wind resource in the coastal and maritime areas of Antioquia, wind data generated by a meteorological station are necessary, preferably from a long period of time (greater than 1 year). These data must include at least the wind direction and velocity (Nagababu et al., 2015). To determine the wind resource, a point (P) very close to the coast was selected in the area of interest, as shown in Figure 3. In the current case, the P coordinates were 8,713280° latitude and -77,075274° longitude.
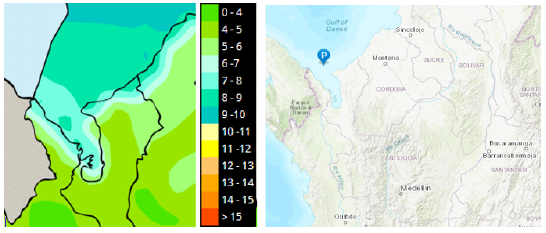
Source: Gómez-Navarro and Ribó-Pérez (2018)
Figure 3 Map representing the annual average of the wind velocity distributions (m/s) at 100 m of altitude in the area of interest for 2015
Since no meteorological stations are installed at the selected point, the information published by NASA (Prediction of Worldwide Energy Resource) was used to evaluate the wind resource. This information source reports a large database of meteorological parameters such as wind velocity, temperature, and radiation, among others. In this database, from the location of the site, it is possible to obtain the maximum, mean, and minimum wind velocities. In Tables 1 and 2, the monthly average of the mean daily wind velocities at altitude values of 10,00 and 50,00 m at the selected point are correspondingly compiled. The monthly average wind velocity
(
 ) can be estimated with Equation (1).
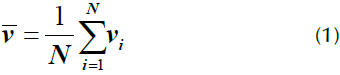
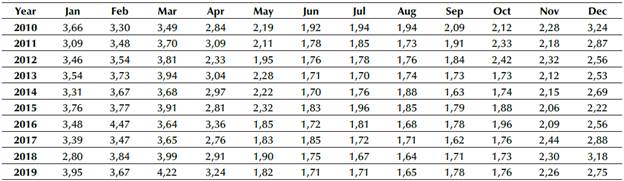
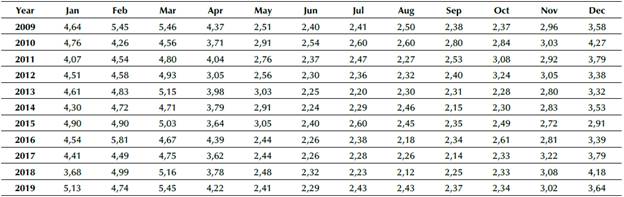
where N is the data number, and v,- refers to the recorded data of the daily average wind velocity. It is highlighted that the wind velocity is measured as an international meteorological standard at an altitude of 10,00 m (Ohunakin, 2011). To estimate the wind resource at the selected point, a statistical analysis of the wind velocity data from the last 10 years was carried out (between 2010 and 2019). From the database, the daily average maximum and minimum velocity values at the indicated altitudes were obtained.
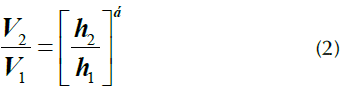
The wind velocity, as previously mentioned, depends on the altitude and the nature of the soil over which the air masses are moving. The wind velocity variation can be represented by Equation (2) (Ali et al., 2017; Manwell et al., 2010; Gul et al., 2019):
where V
1
< V
2
represents the wind velocities at altitudes h
1
< h
2,
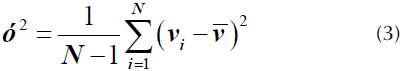
respectively. In turn, α is an exponent that depends on the average surface roughness and the average atmospheric stability in the considered location. This parameter can take a value between 0,08 and 0,12 for smooth surfaces (ice, snow, sea, lagoons, etc.); between 0,13 and 0,16 for a slightly uneven terrain and grazing and cultivating areas; in the range from 0,20 to 0,23 for a rough terrain, forests, and sparsely inhabited areas; and between 0,25 and 0,40 for an uneven terrain (Ali et al., 2017; Manwell et al., 2010). From the available data for the minimum, mean, and maximum velocity at 10 and 50 m in the NASA database and using Equation (2), α was estimated for each pair of daily records. From the data reported at 50,00 m (minimum, mean, and maximum velocity) and the previously determined α, the wind velocity was estimated at 100,00 m at the point of interest. Table 3 shows the  values of the records corresponding to the daily minimum, mean, and maximum velocity at 100,00 m of altitude. Table 3 also details the standard deviation (σ) of the data set, which can be obtained using Equation (3) (Fazelpour et al., 2015).
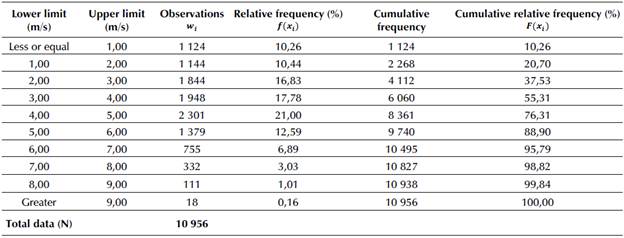
In order to estimate the wind potential at the site of interest, a classification of recorded velocities was performed according to the frequency in which they occurred from 2009 to 2019. The data were classified by intervals, so that they start at values whose velocities were between 0,00 and 1,00 m/s and are followed by velocities between 1,00 and 2,00 m/s. The sequence continues to be increased by 1,00 m/s until velocities greater than 9,00 m/s are finally acquired. This was required to improve the characterization of the data and determine the optimal wind frequency for power generation.
The classification of the frequencies of the daily wind velocities (minimum, mean, and maximum) at 100,00 m is presented in Table 4. The average data corresponding to the minimum, mean, and maximum velocities were 2,25, 3,67, and 5,05 m/s, with a values of 1,71, 1,45, and 1,33 m/s, respectively. Finally, the average of the data set (minimum, mean, and maximum velocities) was 3,66 m/s, with a α value of 1,89 m/s.
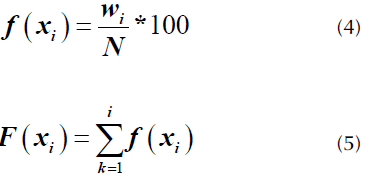
It should be noted that the frequency f(x 1) of a measure x 1 is the ratio between the number of observations (w 1 ) and the total number of measures or records (N). f(x 1) can be calculated using Equation (4). The cumulative frequency F(x 1 ) is defined as the sum of the frequencies from k=1 to i. F(x 1 ) can be determined using Equation (5).
When analyzing Table 4, velocities of less than 3,00 m/s are observed to be only 37,53% of the analyzed data, which means that the remaining 62,47% of the data exceeds 3,00 m/s. 61,29% of the data show velocities from 3,00 to 8,00 m/s, with 1,18% of velocities exceeding 8,00 m/s. Beyond 3,00 or 4,00 m/s, depending on the turbine manufacturer, the wind has enough strength to overcome the internal friction of the wind turbine and, consequently, to deliver power to the grid. This means that the wind turbine would be delivering electrical power to the grid for more than 62,47% of the time analyzed.
Table 3 Monthly average of the daily wind velocity (m/s) data set (minimum, mean and maximum) at an altitude of 100,00 m
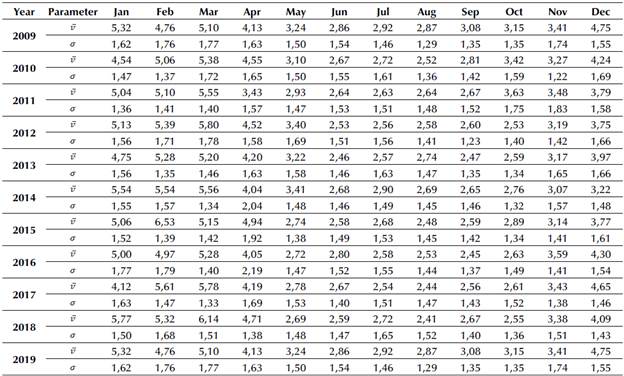
Source: Authors
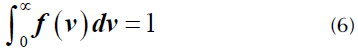
In order to determine the wind potential, it is more relevant to establish a continuous mathematical function of wind velocity frequencies, rather than to use a table of discrete values such as the ones shown in Table 4 (Nedaei ei al., 2018; Li ei al., 2016; Wais, 2017). Therefore, if f(y) is a function representing the probability that the wind velocity is within an interval between v and v + dv, the area under the probability function f(v) is the unit and can be determined using Equation (6).
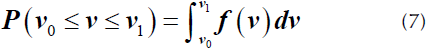
On the other hand, the probability that the wind velocity was between v 0 and v 1 is given by the expression described by Equation (7).
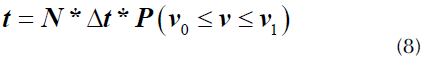
When JV is large and a measurement has been made in the time interval Δt, the time at which the wind is blowing at a velocity between v 0 and v 1 can be calculated via Equation (8).
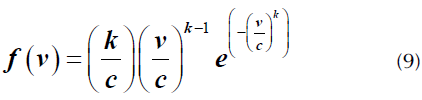
To estimate the variation of the mean wind velocity for a large period of time, the cumulative distribution function or wind duration curve was used. This function provides information on the probability that the velocity (v) exceeds a limit value for a given period of time (Nedaei ei al., 2018; Wais, 2017). In the literature, there are several functions f(v) that can be used to describe the frequency of the wind velocity distribution. Among these functions, the most commonly used ones are the Rayleigh and Weibull functions (Wais, 2017; El Khchine et al., 2019). Therefore, to estimate the wind potential, the parameters of the Weibull distribution equation must be determined, which are the с scale (m/s) and the /c-shape parameters. The с value represents the average wind velocity at the site of study. In turn, the к value indicates the degree of dispersion of the records. With the referred parameters, the frequency by which a given velocity is obtained can be calculated using Equation (9) (Nagababu et al., 2015; Wais, 2017; El Khchine et al., 2019). For the following equations, the mathematical models by Manwell et al. (2010) and Fazelpour et al. (2015) were used.
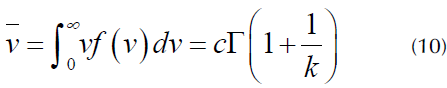
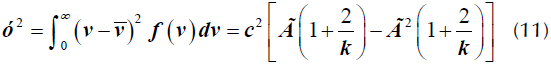
The variables  and σ of the dataset can be calculated using Equations (10) and (11), respectively.
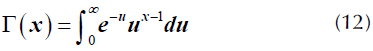
The variable Г(х) is known as the gamma function and is defined by Equation (12).
Г(х) can be numerically determined through the series showed in Equation (13).

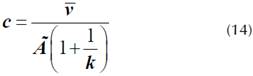
From Equation (10), the c parameter can be estimated using Equation (14).
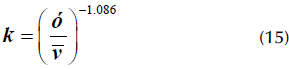
Similarly, the parameter к can be predicted by Equation (15).
On the other hand, the cumulative distribution function ( F(y)) may be calculated using Equation (16).
Therefore, the probability that v is within the interval defined by v 0 and v ± is given by Equation (17).
Finally, F(v) can be calculated via Equation (18).
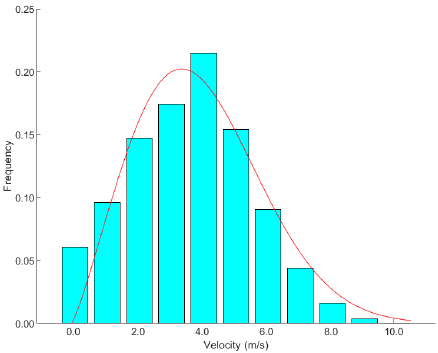
The values of the к and с parameters must be obtained from the wind measurements taken at the wind turbine installation site. To estimate the к and с parameters of the Weibull equation, a nonlinear adjustment was made from the set of wind velocity data (minimum, mean, and maximum) to an altitude of 100,00 m. From the nonlinear adjustment, the с parameter was obtained to be equal to 4,51 m/s. In turn, the к parameter turned out to be equal to 2,19. The frequencies and the Weibull function for the data from the minimum, mean, and maximum velocities at 10,00 m/s between 2010 and 2019 are represented in Figure 4.
The wind distribution function for the study area that is represented by Equation (19) was defined with the parameters found.
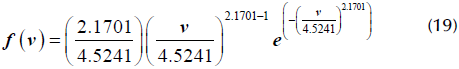
Equation (19) allows calculating the occurrence probability of wind velocities higher or lower than a given velocity. For example, Equation (18) enables the determination of the probability that a reference velocity (v,) will occur. Equation (20) was used to determine the velocities higher than v i .
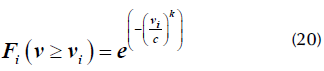
In this regard, the reference values ranging from 0,00 to a maximum of 12,00 m/s were selected for the entire set of wind velocity intervals, which were taken as reference, also using Equation (21). Thus, the probability of obtaining wind velocities greater than v; could be determined. These results are presented in Table 5. According to said Table, the probability of having velocities equal to or greater than 3,00 m/s, which is the minimum velocity required for wind turbine start-up, was found to be 66,36%.
When this probability was multiplied by 8 760,00 (annual hours), the equivalent hours were obtained, which corresponded to the number of hours in which the velocity of 3,00 m/s is exceeded within a year. In the studied site, these hours were equal to 5 813,14 h.
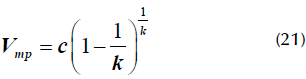
The most likely wind velocity (V mp ), expressed in m/s, can be determined by using the Weibull к and с parameters. This velocity is the most common for a given wind probability distribution, and it can be expressed via Equation (21) (Jamil, 1994).
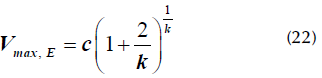
In addition, the velocity with the highest energy production from the Weibull distribution can be determined through Equation (22) (Jamil, 1994).

Power density
The wind potential at a site can be broadly characterized by the average wind velocity. However, the available power density in the wind provides a proper indicator of the wind power potential of the place of interest. The power density is proportional to the product of the air density and the cube of the average wind velocity (Nedaei et al., 2018; Nagababu et al., 2015; Wais, 2017). By using the general power equation, which is labeled in this paper a Equation (23), the available power density (P/A) can be determined as expressed in Equation (24).
where ρ refers to the air density at the place of study, which depends on the pressure and the temperature; the cross-section A is ΠR 2 (m2); and R is the radius of the wind turbine blades (m). In turn, V is the average wind velocity (m/s) of the application site. The power density can also be determined from the Weibull distribution via Equation (25) (Jamil, 1994).
The average wind power density (WPD) for a wind velocity dataset can be calculated using Equation (26) (Fazelpour et al., 2015).
Once the power density is calculated, the energy density for a desired duration (T) is determined through Equation (27).
For calculations, an air density at sea level is assumed, with an average temperature of 15 °C and an atmospheric pressure of 1 atm (1,23 kg/m3) (Arrambide et al., 2019).
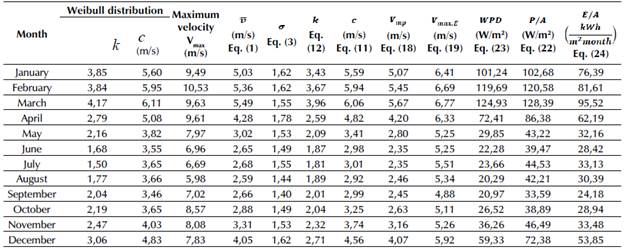
Table 6 contains the analysis of the wind potential of the selected site in the department of Antioquia. The K-values obtained from the nonlinear fit of the Weibull distribution are observed to range from 1,50 to 4,17 with an average of 2,63, while the c-scale parameter ranges from 3,55 m/s to 6,11 m/s, with an average of 4,45 m/s. Comparing the mean values of k and С with respect to the k and С values obtained from the nonlinear fit of the dataset results in an error of 20,08 and 1,43% for k and С , respectively.
Figure 5 shows the values of the annual average wind power density in the area of interest. The power distribution turned out to be greater than the one found through analyzing the selected point data, annually varying between 33,59 and 128,39 W/m2. This difference was due to the distribution of the power density presented in Figure 5, where the data correspond to an altitude of 80,00 m for 2015. In the same year and for an altitude of 80,00 m, the annual average velocity reported was between 7,00 and 8,00 m/s depending on the source from which Figure 5 was extracted. Additionally, only the year 2015 was analyzed, although a longer period of time was considered during the data analysis. According to the categorization of the wind resource informed by Ambrosini et al. (1992), the wind resource potential is between marginal and poor for the analyzed data. In Ambrosini et al. (1992), the resource is considered to be poor and marginal when P / A < 100,00 W/m2 and 100,00 W/m2 < P / A < 300,00 W/m2, respectively. In turn, the resource is good when 300,00 W/m2 < P / A < 700,00 W/m2 and excellent when P / A >700,00 W/m2. For a better wind resource estimation, making a systematic collection of wind data at the site where a possible wind farm can be installed is required. Hence, the installation of weather station towers at several points in the area of interest is necessary.
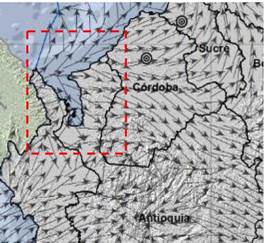
During the analysis of the wind potential, identifying the dominant directions of the wind is also relevant for establishing the correct location of the wind turbine, since it must be placed at a site where there is a minimal number of obstacles in said directions. The annual wind direction in the area of interest is depicted in Figure 6. As it can be seen in the Figure, the predominant wind direction is the northeast (NE) in the coastal region outside the Gulf of Urabá. When there is indeed a predominant wind direction, a distribution in aligned rows with cross-sectional separation between turbines from 3 to 5 times the rotor diameter and from 5 to 9 times the rotor diameter in the direction of the dominant wind is recommended.
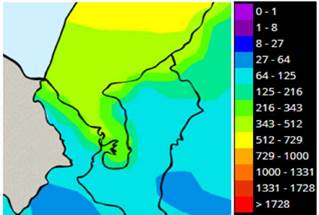
Source: IDEAM (2019)
Figure 5 Map representing the annual average of the wind power density distribution (W/m2) at an altitude of 80 m in the area of interest for 2015
Results and discussion
Wind turbines to take advantage of the wind resource
Type of wind turbine: The different types or classes of wind turbines, in terms of wind velocity and turbulence parameters, are defined in the IEC 61400-1 international standard (Sirnivas et al., 2014; Roach et al., 2020). In this regard, the wind turbine class is established according to the reference velocity, which can be determined via Equation (28). It is highlighted that the class of the turbine determines its suitability for the normal wind conditions of the site where it will be installed.
where V avg is the annual average wind velocity in the area intended for exploiting the wind resource. In Table 7, the different wind turbine classes according to the IEC 61400-1 international standard are presented (Sirnivas et al., 2014; Roach et al., 2020).
Table 7 Classes of wind turbines according to the IEC 61400-1 international standard
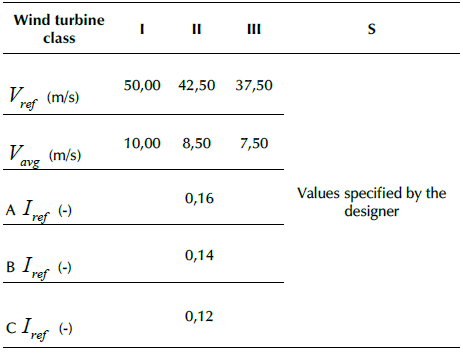
Source: IEC 61400-1 international standard (Sirnivas et al., 2014; Roach et al., 2020).
In Table 7, A, B, and C correspond to the categories for upper, mean, and lower turbulences, respectively. In turn, I ref is the expected value for the turbulence intensity at 15,00 m/s. The AI design class is stronger, and the IIIC design class is weaker. By finding the right design according to the wind conditions at the site of interest, the wind turbine selection process is facilitated by limiting the number of possible turbine models. Selecting an incorrect wind turbine design class could increase the costs of generation projects. For example, the selection of a design class that is too weak leads to an increase of the turbine failure risk by decreasing the service life. On the other hand, when a design class that is too strong is selected, it may result in higher capital costs and lower economic project feasibility. Classes I, II, and III are not intended to cover marine (offshore) installations or wind conditions experienced in tropical storms such as hurricanes, cyclones, and typhoons if the generic parameters of the design classes are exceeded. These conditions may require a class S, user-defined wind turbine design that allows for unique conditions. The IEC standards for the design of fixed offshore wind turbines at the bottom and for floating turbines are IEC 61400-3-1 and IEC 61400-3-2, respectively (Sirnivas et al., 2014; Roach et al., 2020).
The turbulence index (I) is defined as the ratio between the mean sample velocity and the standard deviation of the sample. This index allows defining the variation in wind velocity in a relatively short time. It can be calculated as described in Equation (29).
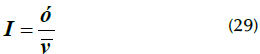
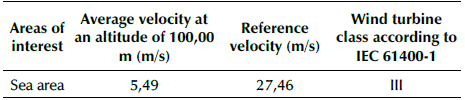
Table 8 presents the wind turbine class to be used in the area of interest according to the monthly average velocities. For the selection, as the average velocities range from 2,59 to 5,49 m/s, the highest value corresponding to March was taken in order to ensure that the wind turbine supports the most critical turbulence conditions.
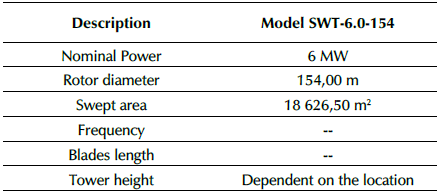
For velocities lower than 13 m/s, wind turbines from the manufacturer GAMESA, a worldwide technology leader in the wind industry and a pioneer in offshore wind turbine production, tend to be more efficient than those from NORDEX (Rueda-Bayona et al., 2019). Therefore, for this study, the wind turbine models from GAMESA were considered. It is noteworthy that, in the portfolio provided by GAMESA, only generators for class I as described in IEC 61400-1 are presented. Thus, the class III generator, which had been previously defined for the maritime zone, was replaced with a class I generator. Note that this change was not a problem since a wind turbine designed to operate under class I conditions was used instead of one intended for class III conditions. Additionally, the conditions established for the design of class I wind turbines are considered to be more aggressive than those established for class III. The selected wind turbine model was the SWT-6.0-154. The main technical characteristics of said wind turbine are listed in Table 9.
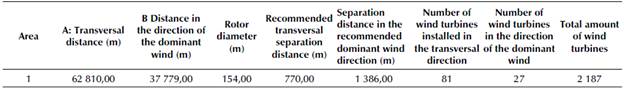
The selected wind turbines can be installed in zone 1, which is detailed in Figure 7. The Figure shows the values of the transversal distances and the wind direction where installation would be attainable.
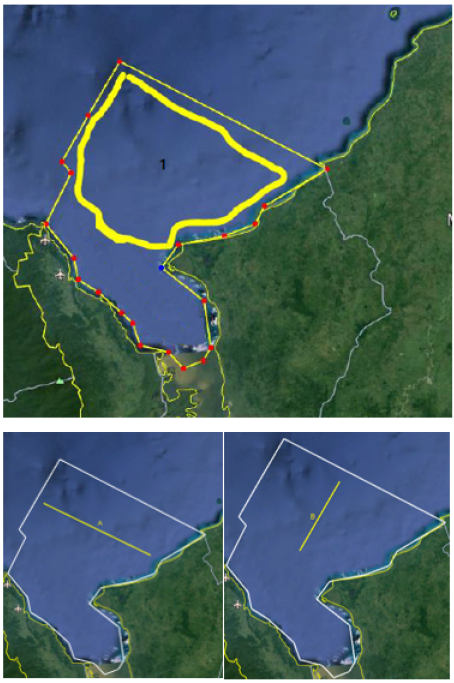
Following the recommendations of the separation distances of the wind turbines in the predominant transversal and wind directions, the number of offshore wind turbines that could be installed at the site is presented in Table 10. From the analysis, the installation of 2 187 offshore wind turbines in the area is found to be feasible. Since the area is an air and sea traffic zone, 40,00% of the possible amount of turbines to be installed was assumed, thus resulting in a total of 875 wind turbines.
In Table 11 and for a wind turbine swept area (A) of 18 626,50 m2, the energy that could be generated with a wind turbine is presented, which is equivalent to 10 808 218,27 kWh/year.
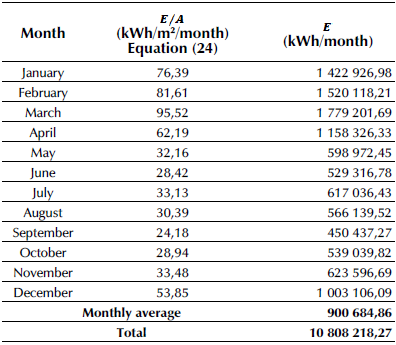
In Table 11 and for a wind turbine swept area (A) of 18 626,50 m2, the energy that could be generated with a wind turbine is presented, which is equivalent to 10 808 218,27 kWh/year. In this regard, if 875 wind turbines are installed, the energy that could be produced is equivalent to 9 457,19 GWh/year. Nevertheless, since the probability of having wind velocities greater than 3,00 m/s is 66,36%, as detailed in Table 5, the energy that can be generated with the wind turbines per year and on a monthly basis would be equal to 7 172 333,64 kWh/year and 597 694,47 kWh/month, respectively. Therefore, the energy that could be produced with the 875 wind turbines would only be equal to 6 275,79 GWh/year. Knowing the amount of wind turbines and the nominal power, if the turbines operate at the rated capacity, the value of the power generated could be obtained. For the 875 units of SWT-6.0-154 wind turbines (offshore), the power would be 5,25 MW or 45,99 GWh/year. To generate the same amount of energy that is produced in one year with the available resource (6 275,79 GWh/year), the selected wind turbine model would have to work 1 195,39 h at the rated capacity. According to the annual report for 2019 presented by XM, a firm specialized in the management of real-time systems, the electricity demand in Colombia was around 71,93 TWh/year. Thus, the potential of the site in the Gulf of Urabá would be around 8,72% of the national demand value in 2019. On the other hand, according to the same report for 2019, the demand for electricity in Antioquia was around 9 409 GWh/year, so the potential of the site in the Gulf of Urabá is about 66,7% the value of the energy demand in the department of Antioquia.
Flexible energy systems based on the wind resource in the department of Antioquia
In many developing countries such as Colombia, energy system networks are traditionally structured and designed to effectively regulate the effects of uncertainty and variability in terms of energy demand and resource availability (Babatunde et al., 2020). In order to transform the current generation system into another one where NCSRE have higher participation, it is necessary to increase the flexibility requirements in the power system grid, given that the incorporation of more variable energy resources, such as wind and solar energy, is not predictable due to their intermittent and variable nature, which is due to climatic conditions. Both solar and wind energies have three main common characteristics: variability, uncertainty, and location dependence. These have effects on distribution and transmission networks. Increasing the flexibility of the grid for the integration of large amounts of energy from NCSRE leads to some technical and economic challenges that must be solved in order to ensure the satisfaction of the energy demand and the stability of the energy system (voltage and frequency regulation). System flexibility means increasing the capacity of an energy system to reliably and cost-effectively manage the demand, supply variability, and uncertainty across all relevant timelines (Babatunde et al., 2020; Akrami et al., 2019; Alexopoulos et al., 2021; Ebrahimi et al., 2022).
Power system networks achieve flexibility by using thermal power plants (gas turbines) that can be quickly connected and disconnected. The integration of NCSRE in the country requires strengthening distribution and transmission facilities, as well as developing auxiliary energy harvesting or storage systems. Currently, hydroelectric pumping systems, thermal storage, and compressed air energy storage can be named among the most common examples of large-scale energy storage technologies (Kougias and Szabó, 2017). In turn, on a decentralized scale, super-capacitors, batteries, electrolysis, flywheels, and fuel cells are some of the available energy accumulators (Ogbonnaya et al., 2019).
The energy potential at the analyzed site is considerable, which is due to the fact that, in the maritime area of the Gulf of Urabá, there is a large area in which offshore wind turbines could be installed. Nevertheless, given the energy fluctuations at the installation site, when a high energy production in the area occurs, surplus energy could be generated. For this reason, the following alternatives are proposed as flexible energy systems to prevent the energy excess from being lost or compromising the stability of the grid:
Harnessing the energy surplus to desalinate seawater and bring drinking water to communities around the area of interest. On average, the specific energy consumption including water pre-treatment and post-treatment processes can be between 3,50 and 4,50 kWh/m3 (Kim et al., 2019) for a water desalination plant with a properly installed technology.
Because there are large hydroelectric plants in Antioquia, the NCSRE excess could be stored through the development of pumping plants. The excess energy can be used to generate hydrogen by means of electrolysis and provide it to the local industry. Additionally, the generated hydrogen can be converted into synthetic natural gas through the methanation process (power to gas) before providing it to the grid (Mazza et al., 2020).
If electric mobility becomes more prevalent in the future, the storage possibilities within home systems could increase the chances of flexible demand (Pilpola et al., 2019).
Flexible energy systems can be useful in overcoming the challenges related to NCSRE penetration into the country's generation system in the future. In Colombia, it is important to improve the energy transmission and distribution systems, as well as to increase the storage capacity and manage the demand in order to ensure a sustainable future with regard to energy. Several research questions can be defined: To what extent could different flexibility measures be used in a cost-effective way to integrate large-scale wind power in developing countries? How does the existence of hydroelectric plants affect wind integration? What is the appropriate combination of different flexibility technologies for wind power integration? Could the combination of gas and power or heat and power form a barrier to a cost-effective wind power integration?
Conclusion
To assess the wind resource at the site with coordinates 8,713280° latitude and -77,075274° longitude, the Prediction of Worldwide Energy Resource NASA database was used, which includes meteorological data for a long period of time. Data analysis reveals poor to marginal wind potential. The energy potential annually ranged from 24,18 to 95,52 kWh/m2/month with a predominant NE direction. The average velocity of the analyzed dataset was 3,86 m/s. The maximum velocity recorded during the observed period (2009 to 2019) was 10,53 m/s at a 100,00 m altitude. Given the conditions of the site and the nominal capacity of the selected wind turbines, the equipment was seen to operate most of the time under conditions below the nominal design, and, therefore, the energy potential produced would be actually lower. The energy that could be produced out of the installation of 875 SWT-6.0-154 wind turbines (offshore) would be equal to 6 275,79 GWh/year.
For the economic feasibility study, carrying out a comprehensive analysis of wind potential from the weather information collected on the installation site over a long period of time is recommended. To this effect, installing measurement towers with the proper instrumentation is crucial. In addition, further analysis considering the oceanic crust and its conditions for the installation of offshore wind turbines is required, so that more accurate results can be obtained according to the approximate number of this type of wind turbines that could be installed.
It is important to advance in the development of flexible network systems to adequately support the operation of the distribution system in the event of large penetrations of NCSRE into the national energy matrix. Power to heat and power to gas, energy stores (mechanical, electrochemical, and electromagnetic energy storage), and smart charging of electric vehicles are main flexibility technologies to integrate wind power into energy system networks.

