


 English (pdf)
 Article in xml format
 Article references
 Send this article by e-mail
 Cited by SciELO
  Cited by Google
  Similars in
SciELO
Similars in
SciELO  Similars in Google
 Permalink
Introduction
The 1 000 kV ultra-high voltage (UHV) power grid has high transmission capacity and efficiency with small losses, which is consistent with the aims of the power industry to promote sustainable development and meet its strategic needs. However, the impact of natural disasters on the UHV power grid may be very serious. For example, transformer frames, which have characteristics common with high-rise (Music and Soto, 2021) and long-span structures, are susceptible to ice and earthquake loads (Gong et al., 2020a, 2020b, 2021, 2022), as well as to wind loads, and they are prone to vibration fatigue damage and collapse under extreme conditions.
Wind engineering research methods include theoretical analysis (Shiotani and Iwatani, 1980; Solari, 1983; Davenport, 1967; Balendra et al., 1989), field measurement, and wind tunnel testing. Wind tunnel tests, widely used in long-span space structures and high-rise structures, include the model multi-point synchronous pressure test (Zou, 2013), the aero-elastic model test (Wang, 2011), and the high-frequency force balance (HFFB) test (Bernardini et al., 2013). The HFFB test allows calculating the wind-induced response of a structure by measuring the bending moment and force on the model under a wind load by using a highly sensitive balance installed at the bottom. Put forward in the 1980s, the HFFB method has been widely used to study wind-induced vibration responses of high-rise structures. Xiao and Li (2011) carried out HFFB tests to investigate the complex characteristics of wind-induced vibration responses of UHV DC transmission towers. Their results suggest that an HFFB-based modified vibration method reliably and conveniently calculates wind-induced vibration responses and equivalent wind loads on a transmission tower (Xiao and Li, 2011). Gu et al. (2000) used the HFFB technique to study the dynamic responses and equivalent wind loads of the Shanghai Jin Mao Building. Their test results show that the vibration response to crosswinds is larger than that to winds in the downwind direction. Moreover, the interference caused by surrounding buildings reduces the average aerodynamic coefficient while increasing the pulse dynamic coefficient (Gu et al., 2000). Yu (2007) investigated the three-dimensional (3D) wind load of the He'nan Broadcast and TV Tower based on the HFFB test and analyzed the characteristics of the wind-induced vibration responses and frequency spectrum of the structure in all wind directions (Yu, 2007). Huang and Gu (2005) studied the interference effects on wind-induced torsional loads between two tall buildings with square cross-sections. Using the HFFB technique, they presented the values of the interference factor of the mean, root mean square (RMS), and peak torsional loads for various configurations (Huang and Gu, 2005).
The numerical method offers low-cost and high-efficiency research advantages. Therefore, it has been extensively used by many scholars to study the wind-induced vibration responses of high-rise structures. Kapania and Yang (1984) analyzed the random wind responses of a cooling tower using the Monte Carlo simulation approach and compared the time-domain responses of the structure for five wind models (Kapania et al., 1984). Xiao (2009) studied the 3D wind-induced vibration response of a transmission tower using the wind tunnel aero-elastic model test method and the finite element buffeting analysis method (Xiao, 2009). Guo et al. (2006) analyzed the wind-induced dynamic response in the time domain of the Zhoushan long span transmission tower using the finite element method (FEM) and conducted wind tunnel aero-elastic model tests. They found that the system response can be divided into background and resonant responses, as long as the influence of transmission lines is considered (Guo et al., 2006). Lou et al. (1996) carried out the wind tunnel aero-elastic model test on a 183 m high self-supporting tower. They also performed numerical computations on the buffeting response in the frequency-domain based on quasi-steady theory and the space truss model (Lou et al., 1996). Yu (2018) investigated the wind-induced vibration responses of a single-column lightning rod, a single span, and three spans of the lightning rod structures in the time domain. They proposed a simplified calculation method for the wind-induced vibration response of the lightning rod structure (Yu, 2018).
Altogether, the abovementioned research shows that wind-induced vibration analysis has been successfully used in high-rise buildings, and that significant progress has been made in the field of transmission towers. However, there have been few similar efforts on the UHV transformer frame, and there are currently no provisions in the design code specifying the values of wind loads. Hence, in order to propose a complete, wind-resistant design method for the UHV transformer frame, this research studied the wind-induced vibration characteristics of a 1 000 kV transformer frame (TF1000) based on the HFFB test. First, the general features of the HFFB test are introduced, including the experimental equipment and design, the construction of the experimental model, and the test plan. Then, the test data were analyzed carefully to obtain the shape factor. Futhermore, the wind-induced vibration response of the TF1000 was numerically analyzed using the FEM.
Experimental conditions
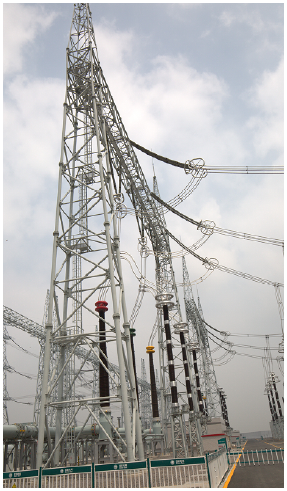
A UHV TF1000 in the Shandong province, China, was selected as the analytical model to perform the wind tunnel test and numerical studies. A 70 m high prototype TF1000 spanning 49 m was assembled using two columns with a variable cross-section and one equal section beam made of Q355 steel tubes, as shown in Figure 1. The designation Q355 means a nominal yield strength of 355 MPa. In the basic design, the wind pressure of the structure is 0,56 kPa. The influence of the transmission lines and electrical equipment under wind loads on the wind-induced vibration response of the TF1000 was not considered in this study.
Test equipment
The HFFB test on the TF1000 was performed in a small test section at the Wind Tunnel and Water Flume of the Harbin Institute of Technology (WTWF-HIT). The laboratory is a closed reflux wind tunnel with two test sections. The dimensions of the small test section are 4 x 3 x 25 m. The wind speed can be adjusted continuously, and the maximum wind speed in the empty tunnel is 44 m/s. Moreover, the turbulence, the mean velocity deviation, and the flow deflection angle of the wind field are less than 1,0, ±2,0, and 1,0%, respectively. Furthermore, the wind tunnel is equipped with an automatic turntable system 2,4 m in diameter, which can be adjusted in a counterclockwise direction to any angle from 0 to 360° with a maximum error of 1°.
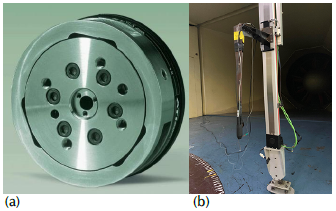
The experiment involved the test equipment and a data acquisition system, which included the HFFB, an anemometer, and a signal analysis system. The HFFB (ATI delta ip68 si-660-60, ATI Industrial Automation, Inc., Apex, North Carolina, USA) is a six-component force sensor that can simultaneously provide force information in a 3D space, which consists of the forces and torques in three directions (Fx, Fy, Fz, Tx, Ty, and Tz) (Figure 2a), whose sampling frequency is 1 kHz. A Cobra probe 3D pulsating wind speed meter was used to measure the wind speed in different wind fields. Its sampling frequency is more than 2 kHz, and it can measure turbulence within ±45 degrees of wind direction. This meter is highly suitable for situations involving high turbulence and an unknown wind direction (Figure 2b).
Source: Authors
Figure 2 Test equipment: a) multi-axis force/torque sensor, b) Cobra probe 3D pulsating wind speed meter
Source: Authors
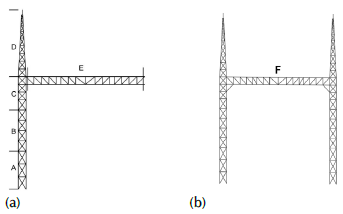
Figure 3 Experimental model designations: a) A, B, C, D, and E correspond to section models of the OLF1000; b) F corresponds to the whole model of the TF1000
Design and construction of the experimental model
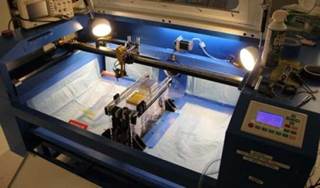
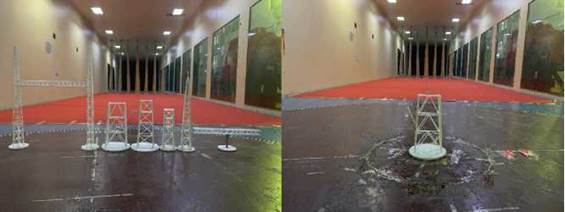
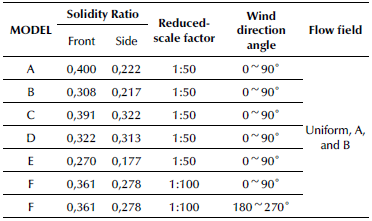
In this experiment, five section models (A, B, C, D, E) and one whole model (F) were designed for testing, as shown in Figure 3. In a HFFB test, if the reduced-scale factor of the experimental model is too large, then its structural stiffness is very poor; and, if the factor is too small, then too many measurement errors will occur. A reduced-scale factor of 1:50 was selected for test models A, B, C, and D, and a factor of 1:100 was selected for models E and F. The frontal and lateral windshield areas measure 0,0495 and 0,0249 m2, respectively, and their corresponding solidity ratios are 0,4 and 0,2%, respectively, which meets the requirements of the wind tunnel test. Furthermore, due to the complex layout of the TF1000, 3D printing technology was used to construct the experimental models. Stereolithgraphy apparatus (SLA) photosensitive resin was selected as the printing material because of its light weight, high strength, and rigidity. The 3D printing equipment (iSLA550, ZRapid Tech, Suzhou, China) and experimental models are shown in Figures 4 and 5, respectively.
Test plan
TF1000s are mostly located in landforms that offer few sheltered structures. These correspond to Landforms A and B in the Chinese code (China Architecture and Building Press, 2012). Landform B has rougher terrain than Landform A. The experimental flow fields used in the HFFB test consisted of one uniform flow field and two turbulent flow fields corresponding to Landforms A and B. The turbulent flow fields were set up using Ding's method, which was thoroughly presented in a study on passive simulation test technology of near-earth turbulence (Ding, 2013).
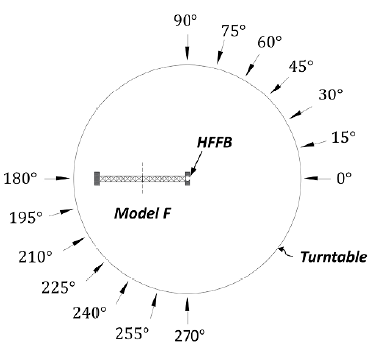
The highest position of the experimental model was selected as the reference height, and the wind speed was set to 12 m/s in the HFFB test. To ensure the stability of the test data, the initial test data points were discarded. Three samples were collected for each test condition, and each sampling lasted for 90 s. Moreover, before the test, the HFFB was adjusted to align its x axis positive direction with the incoming flow direction, i.e., the initial state to which the experimental model was fixed. The initial state was set as the wind direction 0° angle. From this point, every 15° change in the wind direction angle was set as a test condition. The HFFB test of models A~F under three flow fields and different wind directions was planned according to Table 1. Because the height of Model E is low (it is the crossbeam of the TF1000), the wind speed at each point is the same. Thus, only a uniform flow field was applied to model E. Model F (i.e., the whole TF1000) is symmetrical; only half of the structure was placed on the force balance. The other half was also placed in the wind field to simulate the real wind field environment, as shown in Figure 6.
Source: Authors
Figure 5 Experimental models constructed by 3D printing: (a) Experimental models; (b) Model A in testing
Experimental data analysis
Experimental data processing method
The aerodynamic coefficient is the ratio of the actual wind load on the structure to the theoretical value of the average wind load obtained from the average test wind speed and the reference area. It reflects the influence of the aerodynamic shape of the structure on the distribution of the wind load. To convert the test data into a wind load time history applied to the real structure, the test data obtained by the wind tunnel test were expressed by the dimensionless aerodynamic coefficient, which is calculated as follows:
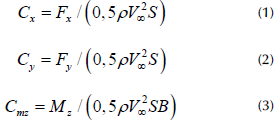
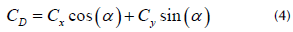
where B is the bottom width of the structure perpendicular to the wind direction; V : is the wind speed; p is the air density; S is the projected area of structural members along the wind direction; Fx, Fy, and M z are the forces and torque along the x, y, and z axes, respectively, as obtained by the HFFB test; and C, C, and C are the aerodynamic coefficient components along the x, y, and z axes, respectively.
The wind factor of the structure can be divided into the drag (i.e., shape factor) and lift coefficients. Since the lift coefficient has little effect on the structure, this study focused on analyzing the drag coefficient, which is obtained by combining the aerodynamic coefficients along the x and y axes, as shown in Equation (4), where a is the wind direction angle.
Experimental results
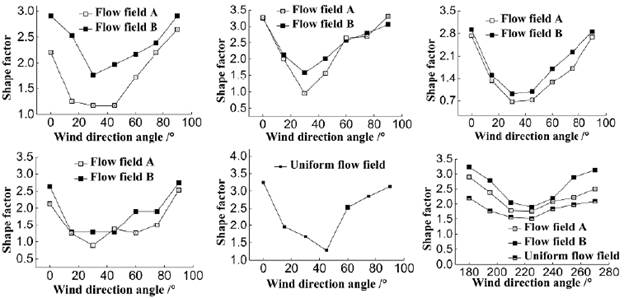
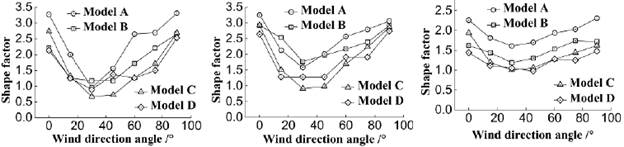
Figure 7 shows the shape factors of models A~F under different wind direction angles. As the wind direction angle changed from 0~90°, the shape factor of each experimental model initially decreased and then increased as the wind direction angle increased. The wind direction angles corresponding to the minimum shape factor of each model were slightly different, assuming values between 30 and 45°. Moreover, the shape factor decreased in flow fields A and B, as well as in the uniform flow field, and it changed gradually with the wind direction angle in a uniform flow field. Therefore, the type of flow field affects the wind load distribution of the TF1000. Figure 8 compares the shape factor of four section models in flow fields A and B, as well as in the uniform flow field. The results show that the shape factor of Models A, B, C, and D decreased under the same wind direction angle, which indicates that this factor is mainly related to the windshield area (Table 2).
Source: Authors
Figure 7 Shape factors: a) Model A, b) Model B, c) Model C, d) Model D, e) Model E, f) Model F
Source: Authors
Figure 8 Shape factors of models A~D under same flow field: a) flow field A, b) flow field B, c) uniform flow field
Table 2 Windshield area of section models (cm2)
| Section model | Model A | Model B | Model C | Model D |
|---|---|---|---|---|
| Downwind | 71,12 | 61,04 | 59,24 | 52,60 |
| Crosswind | 81,68 | 73,48 | 63,72 | 52,60 |
Source: Authors
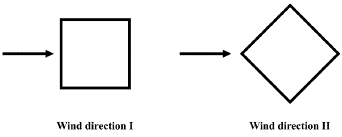
Figure 9 illustrates that the shape factor measurements obtained in the HFFB test are larger than the Chinese code's recommended values (China Architecture and Building Press, 2012). This is because the code only considers the solidity ratio and the shape of the member section in determining the shape factor of a high-rise tower structure (Table 3). According to the wind direction defined in Figure 10, the TF1000 columns and crossbeam members are too complex and diverse to rely on the code method in determining its shape factor.
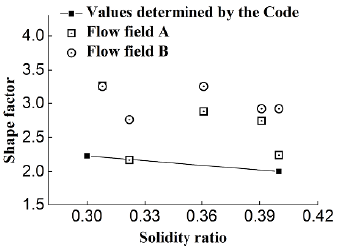
Table 3 Specifications for the shape factor of tower structures
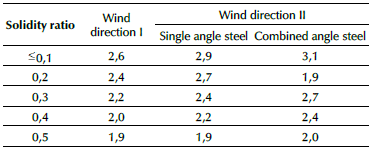
Source: China Architecture and Building Press (2012)
Analysis of wind-induced vibration response based on the FEM
The wind-induced vibration analysis of the TF1000 based on FEM is presented in this section. The wind load distribution of four section models measured via the HFFB test is used to solve the corresponding wind load time history of the TF1000 nodes, which is applied to the TF1000's finite element model (FE model) in order to perform a nonlinear calculation of the wind-induced vibration responses along and across the wind direction.
FE model
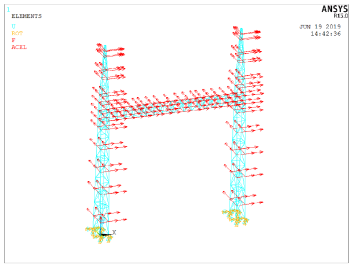
The FE model used in the wind-induced vibration analysis aimed to simulate the members of the TF1000 with 16 kinds of pipe section sizes, whose maximum and minimum values were 0377x12 mm and 089x6 mm, respectively. Members with the same node were connected rigidly, while members of the TF1000 columns were fixed to the ground. Additionally, the ideal elastic-plastic constitutive model was adopted for the analysis. Its modulus of elasticity was 206 GPa, its Poisson's ratio 0,3, its steel density 7 850 kg/m3, and its yield strength 345 MPa. Rayleigh damping was used for dynamic analysis with a ratio of 0,02. The established FE model is shown in Figure 11.
Wind loads
The TF1000 was divided into five section models (i.e., A~E) in HFFB test, and the aerodynamic coefficients of each section model were transformed into the wind load time history at different heights via the force formula, a function of the aerodynamic coefficient, wind speed, and windshield area. The detailed steps to obtain the wind load time history are as follows:
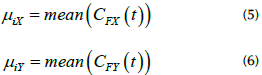
i) HFFB tests were carried out on experimental models A, B, C, D and E to obtain aerodynamic coefficients. Then, the mean values of the aerodynamic coefficients in the x and y directions were determined through Equations (5) and (6), where i = A~E.
ii) The wind load actually borne by the TF1000 was then assumed to be composed of the loads on five section models. Equations (7) and (8), which are applicable at any time, were solved, where F(X) total and F(V) total are the forces of Model F in the x and y directions, respectively; u hi is the wind speed at the corresponding height of section model i; and A ix and A iY ave windshield areas in the x and y directions of section model i, respectively.
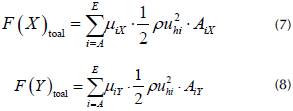
iii) Wind loads on the whole model F were distributed to each section model, and then the total load time history of each section model was distributed to each node according to Equations (9) and (10), where λ L and λ v are the reduced-scale factors of length and wind speed, respectively. The load distribution is shown in Figure 11.
It should be noted that the effect of turbulence on the vertical distribution of the wind load is ignored in this study because the wind-induced response of the TF1000 is mainly caused by the superposition of the wind load horizontal distribution.
Wind-induced vibration analysis
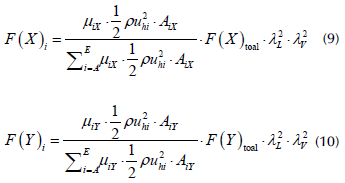
Wind-induced vibration response:Figure 12 shows the changes in the average displacement at different heights of the TF1000 with the wind direction angle in different flow fields. The results show that, as the height on the TF1000 increases, the nodal displacement increases continuously under the action of the wind load at the same wind direction angle, and the displacement at the top of the column reaches the maximum value. Moreover, regardless of the flow field (A or B), as the wind direction angle increases from 0 to 90°, the displacement in the x and y directions initially increases and then decreases. In addition, when the wind direction angle is 60°, the average displacement reaches the maximum value, thus suggesting that the most unfavorable wind direction for the TF1000 is 60°.
Source: Authors
Figure 12 Wind-induced vibration responses: a) displacement along the y axis under flow field A, b) displacement along the x-axis under flow field A, c) displacement along the y axis under flow field B, d) displacement along the x axis under flow field B
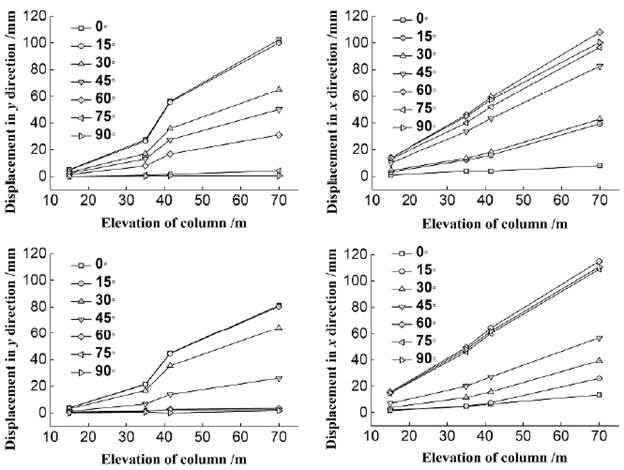
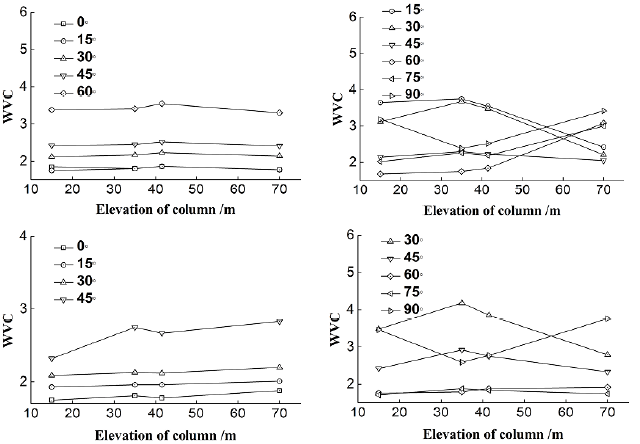
Wind-induced vibration coefficient (WVC):Figure 13 shows the WVCs of the TF1000 under different wind direction angles. The results suggest that the WVC in the y direction increases along with the increase in the height of the TF1000 column that is subjected to the same wind direction angle. The WVC also increases as the wind direction angle increases within a certain range. In the x direction, two WVC trends at various heights and different wind direction angles are apparent: one trend involves an initial increase, followed by a decrease; and the other one is the reverse of the first. Additionally, under flow field B, the WVC values are greater than those under flow field A, which indicates that the flow field has an effect on the WVC. Finally, the WVC values of the TF1000 range from 1,7 to 3,9. This range may be a useful reference for engineering design.
Conclusions
This work studied the experimental and numerical responses of the TF1000 under different wind loads. Five section models and one whole model of the TF1000, designed and constructed by means of 3D printing, were evaluated under multiple loading cases in the wind tunnel via the HFFB test. The test data were used in the FEM to conduct wind-induced vibration analysis. The key findings and conclusions are summarized below:
i) The wind direction angle corresponding to the minimum shape factor of each model is between 30 and 45°. The shape factor measurements obtained in the HFFB test are generally larger than those determined by the Chinese code (China Architecture and Building Press, 2012). This significantly indicates that the method mentioned in the code underestimates the design wind load, and the results in this paper can provide a reference for improving it. The shape factor distribution is influenced by the flow field and windshield area, and the larger the windshield area, the larger the shape factor.
ii) As the wind direction angle increases from 0 to 90°, the displacements in the x and y directions initially increase and then they decrease. When the wind direction angle is 60°, the average displacement reaches the maximum value, indicating that the most unfavorable wind direction for the TF1000 is 60°.
(3) The WVC values under flow field B are greater than those under flow field A, which indicates that the flow field affects the WVC. The WVC values of the TF1000 range from 1,7 to 3,9, which may be useful reference values in engineering design.

