


 Inglês (pdf)
 Artigo em XML
 Referências do artigo
 Enviar este artigo por email
 Citado por SciELO
  Citado por Google
  Similares em
SciELO
Similares em
SciELO  Similares em Google
 Permalink
Introduction
Radiofrequency absorbance quantifies the physical and chemical properties of samples from controlled measurements of the perturbed electromagnetic (EM) field (Wlodarczak, 2017). These methods are increasingly being used for monitoring, testing, and quantifying productive processes in different industries (Xia et al., 2019; Lu et al, 2019; Pu et al., 2020). Industrial applications tend to avoid high-energy fields that compromise sample integrity (El-Mesery et al., 2019) while aiming for portable, cost-effective technologies that mitigate time-consuming processes (Lindon et al., 2017).
Characterizing EM properties is an ongoing task that has drawn considerable attention. Most of the work is aimed at estimating complex permittivity (e) (Bindu et al., 2006; Kaatze, 2013; Wlodarczak, 2017) as a way to describe the differences and characteristic patterns. This quantifies the measurable impact on field displacement (
 ) of an electric field (Ē) in the presence of intrinsic polarity (
 ):
):

There is a similar equation for magnetic permeability (μ), which relates the magnetic field (
 ) and the magnetic flux density (
 ), but requires higher power. Maxwell's equations connect these fields with geometries and interfaces etc., and provide the means to derive different techniques that serve multiple applications (Choi and Kim, 2009; Brovoll et al, 2014; Naishadham et al, 2016).
The coefficient Є = ЄrЄ0, with Єr being the relative media-specific permittivity, describes how the traversing field is attenuated and delayed at different frequencies depending on the material, the state of the matter, the geometry (Kaatze, 2013), or the transmitted power level, according to (Agilent Technologies, Inc., 2006; Heileman et al, 2013):
Temperature: it affects atomic but mostly subatomic mobility, microstructures, and state (e.g., solid);
Mechanical properties, viscosity, etc.: macroscopic properties are ultimately related to existing molecular and atomic structures, interactions, and bonds;
Electro-static and electro-dynamic properties are affected due to bonds and interactions at a chemical level, polarity, size, weight, and structure of molecules, radicals, or ions.
Therefore, changes and differences in the media at the molecular, atomic, and subatomic levels produce characteristic responses in the EM field at different levels and bands.
Depending on the specific method and the excited bands, one can evaluate the presence of different substances, estimate the geometry of the underlying structures (at molecular and microscopic levels) or collect evidence on the inner state of matter (e.g., temperature) (Meng, Wu, and Gray, 2018). Although complex interactions still pose a challenge, there is certainly room for improvement with respect to instruments, setups, and indicators for field tests.
Different frequency ranges have been inspected. The visible spectrum can be used for nondestructive spectrophotometry or destructive spectrometry. Adjacent bands, such as UV or IR, have gained attention and are now standard (Becker et al, 2020). High energy bands (e.g., X-ray and above) were initially used for internal structure inspection and diagnosis (Maier et al, 2018; Torres Castellanos and Rodríguez-Torres, 2019). In recent decades, spectrometry has reached these bands (Lindon et al, 2017), and dielectric spectrometry has gained attention (Pirola et al, 2007; Agilent Technologies, Inc., 2006) regarding the characterization of the physical properties of substances (Konings et al, 2019) or complex interactions (Yao et al, 2022).
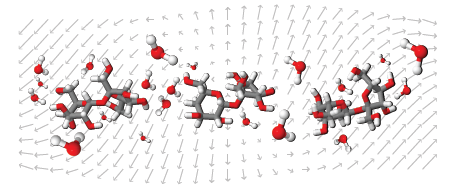
Nondestructive dielectric characterization using radiofre-quency measurements requires sensitive instrumentation and subtle perturbations. It has been introduced to evaluate highly conductive substances (Liu and Brady, 1996; Periasamy and Ravi, 2020) and more challenging nonconductive aqueous solutions such as sucrose in water (Gennarelli et al, 2013; Harnsoongnoen and Wanthong, 2017, 2016), where differences in the properties and sizes of the polarity of the molecules (Figure 1) cause distinct and less prominent effects.
Source: Authors
Figure 1 Schematic of sucrose-in-water solution. One may identify both sucrose and pure water molecules under an externally induced EM field (gray). Molecules, ions, and radicals change their locations and orientations as the EM field is perturbed.
The detection of sucrose concentration is critical for the food and beverage industries to adjust the sweetness of the final product (Harnsoongnoen and Wanthong, 2016), as well as for the improvement and monitoring of crops (Kennedy et al, 2007). The continuous request for non-intrusive, portable, non-contact, and easy ways of measuring has received limited attention. Gennarelli et al. (2013) use a resonant cavity and a 6 MHz bandwidth to measure sugar/water concentrations starting at 500% wt in steps of 5 Kg/L. In (Harnsoongnoen and Wanthong, 2016, 2017), the authors used coplanar open waveguides, achieving a 1 GHz and 600 MHz bandwidth, respectively, reporting on 20% wt mixes in steps of 0,2 g/mL, and from 4% in steps of 4 g/mL.
This paper aims to present a novel method for radiofrequency absorbance evaluation that provides a novel concentration indicator. It uses non-contact, portable, low-cost, and wideband microwave Software-Defined Radio (SDR) technology to compute amplitude and phase contributions. It avoids costly, time-consuming procedures and provides reliable measurements. This work tested it on sucrose-in-water solutions, but it could be used on other aqueous solutions.
Materials and methods
For our experiments, sugar was mixed in water at concentrations of 0, 5, 10, 15, 20, and 25% in weight and measured under normal conditions to ensure repeatability and mitigate spurious temperature effects. These values were selected to validate the proposed method and its sensibility in a challenging scenario, expecting systematic increases in absorbance levels as the solute concentration increases.
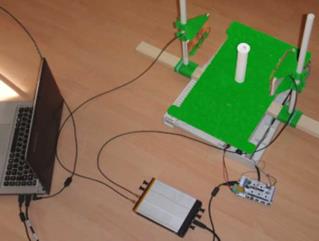
The prepared samples were placed within our SDR-based free space setup, as shown in Figures 2 and 3, halfway between the antennas (inside the white recipient). The placement was maintained throughout the experiment to avoid spurious effects. EM field perturbations were induced and measurements were taken with a commercial Ettus Research™ B210 board (a National Instruments Company, 4600 Patrick Henry Drive, Santa Clara, CA, USA) on a procedure specifically devised for the tests described hereafter.
Source: Authors
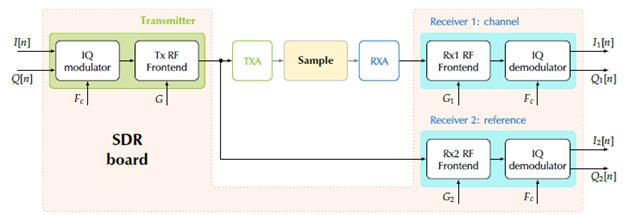
Figure 2 Block diagram describing the proposed SDR configuration. It involves a single transmitter (TX) and a pair of synchronized receivers (RX1, RX2). The outputs for the test sample (top) and the reference (bottom) pathways are to the right. TXA and RXA stand for the antennas connected to the transmitter and receiver, respectively. The resulting outputs {I 1 Q 1 ,l 2 , Q 2 } are compared afterwards with the corresponding input (I, Q). F c and {G, G1, G2} are the carrier frequency and the gains assigned to transmitter and receivers amplifiers.
SDR technology was initially developed as a cost-effective solution for end-to-end amateur communications (Pawlan, 2015; Nesimoglu, 2010). The boards were designed to facilitate signal transmission and reception, incorporating configurable amplification and carrier recovery, etc. (Li, 2014).
An SDR board was used to produce (generate, modulate, and transmit) and recover (receive, demodulate, and digitize) a pre-specified signal perturbing the EM field. Rather than looking at communication capabilities, degradation patterns induced in the recovered signals were traced to successfully connect observed patterns with traversed media properties (in this case, sample concentration levels).
Figure 2 shows the block diagram of the proposed setup. Conveniently selecting I[n] and Q[n] input sequences (left) while varying carrier frequency (Fc) and adapting gain levels in (G, G1, and G2), we expected to produce controlled, time-and energy-bounded, frequency modulated pulses. The corresponding measures were used at the receiver antenna (RXA, I 1[n] and Qi[n], top) and the reference line (I2[n] and Q2[n], bottom) to assess absorbance levels.
Source: Authors
Figure 3 Setup used for the experiment. The enclosed SDR board is shown in the lower part, and the antennas and the specimen are at the top right corner. The laptop controls the board and stores the recordings.
Radiofrequency absorbance assessment
The proposed method assumes a linear behavior. The input to the transmitter antenna (TXA) should match the following Equation:

while a linear channel would produce an output behind the receiver antenna (RXA) that follows

The operator * stands for the linear convolution, and h(t) represents the combined response of the channel (h chan) and antennas (h RXA, h TXA). Whenever the transmitted signal is a modulated pulse (sweep), the received signal may be reformulated as

with f i (f) being the exciting frequency at t; H and т the amplitude and phase responses, respectively; and η(t) a noise term.
Network analyzers use this model to derive channel-specific parameters. For an SDR, one must work on the input and output sequences to address the major technological drawbacks before deriving the model parameters. Readers may refer to (Blanco-Murillo et al, 2017, 2022) for details on the use and processing of frequency-modulated chirps, specifically in the characterization of EM response along a transmission scheme.
After traversing the channel branch (top) and considering the SDR scheme, the IQ demodulation of a pulse produces the following outputs:
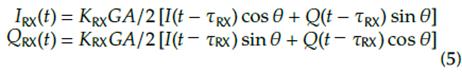
with K 1 = G 1 • H(f), K 2 = G 2 • B, т1 = т, and т2 = т0 for outputs corresponding to the channel (RX = 1) and the reference (RX = 2). θ represents a deviation term in the received signal due to uncertainty in the IQ demodulation process, B is the attenuation corresponding to this channel and T0 is the reference delay. Noise terms have been removed for the sake of simplicity. Ideally, we may achieve θ = 0 and perfect synchronization, but it is not precisely zero due to local oscillators. However, our objective is to estimate the channel-characteristic attenuation Ф(f) (dB), and phase ф(f) (rad) along the inspected bandwidth. The wider the inspected frequency band, the more information we have to characterize the samples and underlying processes.
Frequency-modulated (FM) pulses were used on the aforementioned IQ modulator (transmitter) and demodulators (receivers) from digital sequences.

One must select a suitable phase sequence ф[n] that corresponds to some frequency profile. The simplest one consists of a monotone. Alternatively, one may choose a linear or exponential sweep. Constant frequency is mainly affected by noise and distortion in the band, whereas exponential sweeps display convenient properties for modeling broadband channels, as discussed in (Blanco-Murillo and Yagüe-Jiménez, 2017). Linear sweeps present an excellent trade-off for linear processes and a simple formulation:
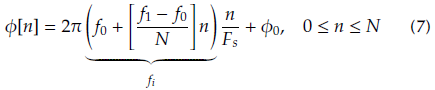
where f 0 ≤ fi ≤ f 1 , F s is the sampling frequency, N is the sequence length (in samples), and ф0 is the initial phase. For our experiments, the parameters were set to f 0 = 0,5 MHz, f 1 = 15MHz, and Fs = 30 MHz. By varying the carrier frequency, 1,8 GHz ≤ Fc ≤ 5,0 GHz, one may excite all frequencies to be inspected, f = Fc + f i. An 8MHz overlap between consecutive bands was established to ensure phase continuity. The normalized amplitude was set to A = 0,7 in order to avoid saturation. Amplifier gains were set to G = 30 dB, G1 = 55 dB, and G2 = 40 dB, and the reference channel attenuator introduced B = 6 dB losses.
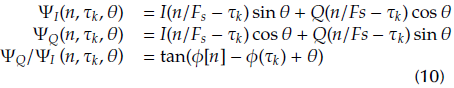
In assessing the EM response based on the collected measurements and Equation (5), the amplitude and angle (phase) from the in-phase (I k[n]) and quadrature (Q k [n]) components were studied according to the following:

From these, the following is obtained:
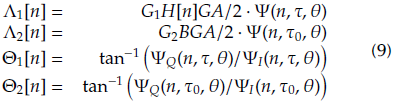
with Ψ2(n, T k, θ) = Ψ2 I(n, T k , θ) + Ψ2 Q(n, Tk, θ) and
Assuming that the reference line measurements are consistent and synchronized, one may compute the absorbance levels of a given sample by subtracting these values from those from measurements collected with no sample:
The Equations above describe absorbance level computation from a single measurement. Regarding the calibration and secure usage of this technology, the SDR-based setup must ensure that
the generated carrier frequency F c matches the specified value (i.e., negligible deviations are expected);
the transmission power is low enough not to cause damage (i.e., using non-ionizing, hazardless radiation); and
carrier generation does not introduce significant spurious terms along the inspected bandwidth (i.e., spurious radiation does not spoil our measurements).
In other words, (i) the difference between expected frequency and carrier frequency must be negligible, (ii) the power level needs to be measured before experimentation and be significantly below a given threshold, and (iii) the ratio between the primary frequency content (the expected signal) and other second-order terms (noise, distortion, etc.) must be above a given threshold. All this was checked before the test was conducted, while autocalibration of the SDR device was ensured (Coronel-Gaviro et al., 2020).
The complete testing methodology requires that the entire inspection bandwidth is covered, as follows:
Set the SDR configuration parameters.
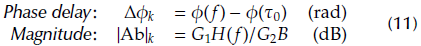
Record {I 1, Q1,I 2, Q2} with no sample between the antennas. Compute the reference estimates for H(f) and Δф(f) (Equation (11)).
Place the sample between the antennas and repeat steps 1 and 2. Compute the channel estimates for H(f ) and Δф(f) (Equation (11)).
Subtract measurements from the estimated attenuation levels on the channel and reference to compute the absorbance magnitude (in dB).
Subtract measurements from the estimated phases on the channel and reference in order to compute the absorbance phase (in radians).
To improve the signal-to-noise ratios of the collected measurements, this procedure should be repeated M times. The carrier frequency can be tuned rapidly (less than 1 s), and the duration of the signal (1 ms) is negligible compared to the setup time. A 5 MHz step over the 1, 8 GHz ≤ Fc ≤ 5 GHz range (640 steps) took approximately 2 minutes to collect M = 5 repetitions of a complete set of measures on a single sample. The setup was validated in (Coronel-Gaviro et al., 2020).
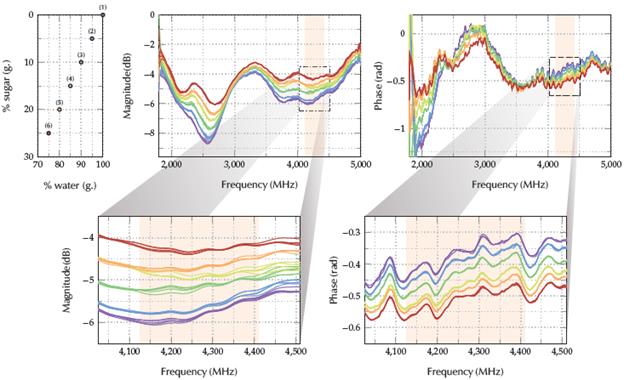
Source: Authors
Figure 4 Magnitude and phase results for different sucrose-in-water solutions. A schematic legend is included which shows the concentration levels reported (upper left). At the center and on the right (upper and lower) are the magnitude and phase responses.
Statistical tests were conducted to evaluate the significance of the computed radiofrequency absorbance levels (amplitude and phase) across the reported concentration levels and along the inspected bandwidth. On the one hand, the Kruskal-Wallis nonparametric test quantified the significance of the observed differences in concentration levels. On the other hand, the Jonckheere-Terpstra test was introduced to evaluate the significance of the levels' ordering (increased absorbance levels should match increased concentrations).
The proposed concentration indicator is the average radiofrequency absorbance for the amplitude and phase values.
Results
Figure 4 shows the magnitude and phase of the absorbances computed in 1,8 GHz ≤ F c ≤ 5 GHz. Zoomed versions are shown at the bottom.
Magnitude levels vary greatly with concentration throughout the inspected bandwidth, while phase trends are more intricate. The characteristic and systematic patterns identified are consistent with the results reported in the aforementioned literature.
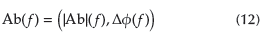
The observed trends could exhibit different significance levels at the multiple frequencies inspected. The results for the statistical tests on both magnitude and phase curves are depicted in Figure 5. One may observe that:
The Kruskal-Wallis test achieved p ≤ 10-4 (99,99% significance).
The Jonckheere-Terpstra test identified frequency bands displaying p ≤ 10-9 on magnitude and phase.
The colored regions in Figures 5a and 5b mark the best suited band (high significance) for both tests.
The 4125 to 4 410 MHz band showed very high significance levels in terms of magnitude and phase for both tests in prepared sucrose-in-water solutions. This band is also marked in Figure 4. It differs from the one identified by Coronel-Gaviro et al. (2020) for the detection and quantification of honey fraud (2 150 to 3 250 MHz). However, the authors reported on honey samples and only addressed magnitude levels.
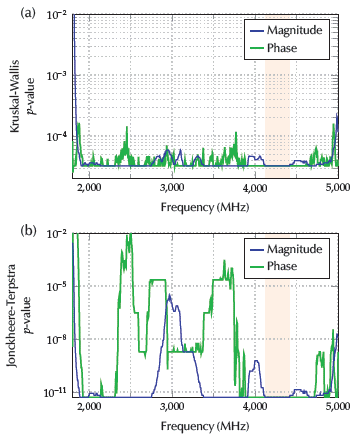
Finally, the proposed concentration indicator was calculated, averaging the calculated absorbance levels in amplitude and phase for the most representative selected bandwidth (4 125 to 4 410 MHz). We used a polar visualization of the computed frequency-dependent complex absorbance Ab(f) (magnitude and phase in Equation (11):
This indicator can be easily represented as a complex phasor on a polar coordinate chart, with magnitude (attenuation) providing the distance to the center (radius) and angle (in grades) matching the phase (previously expressed in radians). Thus, an attenuation of 0 dB represents a non-attenuated field, while a decreasing angle (less than 360°) is expected as the group delay increases.
Source: Authors
Figure 5 Significance levels (p-values) for the Kruskal-Wallis and the Jonckheere-Terpstra tests on the magnitude and phase levels along the inspected frequency range.
Figure 6 shows the phasors computed in the selected bandwidth for all samples at different concentration levels. The Figure includes a) all absorbance levels and b) the computed concentration indicator corresponding to the averaged values. The larger the concentration of sugar, the further out and lower the indicator.
Source: Authors
Figure 6 Concentration indicator levels. Colors represent sample concentrations. a) Includes all values on the representative bandwidth for all measured samples, and b) depicts the final values for the indicator (all samples), for the M repetitions (crosses), and for the averaged values in all repeated measures (circles). A trend curve for sucrose concentration has been computed and plotted in black.
Conclusions
This work presented the basis for a novel noncontact method to evaluate concentration levels using SDR-based low power radio frequency absorbance analysis while computing a reliable concentration indicator. The indicator was derived from the calculated absorbance levels and successfully evaluated the significance of the reported results at different concentration levels in sucrose-in-water solutions.
Compared to previous studies on sucrose in water (Gennarelli et al, 2013; Guariti et al, 2013; Harnsoongnoen and Wanthong, 2016, 2017), the proposed methodology obtained statistically significant results at lower concentrations. The technology is affordable and could be used for on-field tests, but it can still cover a wider frequency range during inspection. It could be introduced for food processing industries, such as beverage production, as well as integrated for inline sensing. It can also be used for on-field measurements, as well as in other aqueous solutions, since the device is portable and noncontact.
Considering on-field measurement and inline monitoring, (i) the measuring temperature, (ii) defective materials (e.g., sample containers), or (iii) spurious electrical conditions may impact EM measures, automatically affecting the performance of the proposed indicator, which is why further analysis is required.
Future work may be dedicated to delving into these aspects, as well as developing a solution for the quantification of the concentration level (Ballin and Laursen, 2019) and generalizing it to other types of aqueous solutions. Quantification may require linearization techniques, as shown by the results obtained for the proposed indicator. Addressing aqueous solutions requires a larger number of samples and more complex mixtures. Although the significance levels obtained (Kruskal-Wallis 99,99%, Jonckheere-Terpstra p < 10-9) favor our hypothesis, several spurious effects need to be addressed. These include measuring the impact of temperature and EM distortions on absorbance measures and testing for the required EM compatibility compliance.

