


 Inglés (pdf)
 Articulo en XML
 Referencias del artículo
 Enviar articulo por email
 Citado por SciELO
  Citado por Google
  Similares en
SciELO
Similares en
SciELO  Similares en Google
 Permalink
Introduction
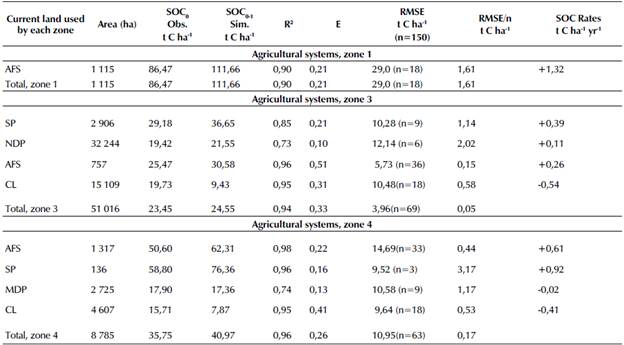
Globally, agricultural-use land occupies about 40-50% of the land surface and generates about 10-12% of the total global anthropogenic emissions, i.e., 5,1-6,1G t CO2-eq per year (IPCC, 2006). Land uses in the study area (Villavicencio) are characterized mainly by conversion from grassland to continuous croplands, which causes a large degradation of soil organic matter (SOM) (Silva, 2018; Silva and Orozco, 2018), mainly due to conventional tillage (García et al., 2018). Greenhouse gas emissions are influenced by the type of land used, especially by the types of crops and/ or pastures in diverse environments (Mangalassery et al., 2014; Chambers et al., 2016; Lal, 2018). The effects of land use on the emission of CO2 are dominated by the type of tillage and/or pasture management (IPCC, 2006; Haddaway et al., 2017; Behnke et al., 2018; FAO, 2018). Land use may have direct and indirect effects on soil carbon stocks, and these changes may be conditioned to meet the social needs of farmers, such as the production of food, energy and fossil fuel, water supply, and crop residues management, in order to achieve higher productions in the short term (Popp et al., 2017; Nyambo et al., 2020). Several studies applying IPCC models to different extents corroborate that different soil management practices and types of tillage increase soil CO2 emissions (IPCC, 2006; Cardinael et al., 2018; Lal, 2018; Parra et al., 2019). As an option for reducing soil CO2 emissions, conservation practices have increased in many parts of the world, aiming to also increase production and sustainable development (Ogle et al., 2019). Agroforestry systems with trees and crops in interactive and simultaneous cultivation have been regarded as a key cropping practice for improving the productivity of agroecosystems and reducing soil CO2 emissions (Nair, 2012; Feliciano et al., 2018). This can be seen in Figure 1.
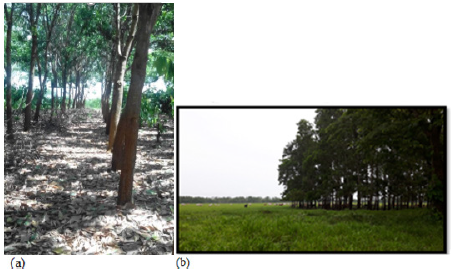
Source: Authors
Figure 1 (a) Cocoa-based agroforestry including Acacia mangium trees; (b) silvopastoral system of B. decumbens pasture with Acacia mangium in the study area (Villavicencio, Colombia). The capacity of soils and biomass in agroforestry systems to store C depends on several factors, including local edaphic and climatic conditions, previous land use, tree density and species, harvesting and pruning practices, and management activities (Nair, 2012).
In general, the transition from cropland to an agroforestry system is beneficial to soil organic carbon (SOC) (Cardinael et al., 2018). The accumulation of SOC due to the sequestration of carbon in the soil is certainly one of the major benefits of agricultural systems, as it is effective in helping to mitigate the increase in atmospheric CO2 concentrations (Lal, 2018). For example, in the southeastern USA, conservation tillage, combined with intensive crop rotations that include cover crops, can sequester an average of 1 700 lb of CO2 each year, i.e., 464 lb of C per acre (Franzluebbers, 2015). There are various methods to estimate soil CO2 emissions from agriculture, ranging from simple Tier 1 methods (IPCC, 2006; Ogle, 2004; Parra et al., 2019) to complex process-based models that simulate the changes in soil carbon with some detail (Tiers 2 and 3) (FAO, 2018), although this relation is even more complex under the influence of climate change in tropical zones. Cardinael et al., (2018), applying a Tier 1 IPCC methodology, validated that the mean SOC storage rate (± confidence intervals) for croplands converted to agroforestry systems was 0,75±0,19 t C ha-1 yr-1, while the mean SOC loss rate for forests converted to agroforestry systems was -1,15±1,02 t C ha-1 yr-1, in all regions, climates, and agroforestry systems taken together. The mean SOC change rates for the conversion from grasslands to agroforestry systems were not significantly different from zero (0,23±0,25 t C ha-1 yr-1). In this sense, by employing soil management practices, agricultural lands can both sequester soil carbon and reduce GHG emissions (IPCC, 2006). Nemo et al., (2017) showed a variant of Tier 1 testing with the 2 RothC model (IPCC, 2006), which is used to simulate the interaction between GHG emissions, growth, and grazing in managed grasslands, where the C-input was adjusted so the equilibrium C matched the measured total SOC at the end of the spin-up period. This variant is useful for grassland systems in which the plant-derived carbon input is the most uncertain parameter, as well as the one to which the model is most sensitive (Poeplau, 2011). These types of approaches have been used to estimate C sequestration potentials in grasslands, as well as the potential effects of pasture management on SOC and stock changes on global, national, and regional scales (Henderson et al., 2015; Chambers et al., 2016; Novaes et al., 2017; FAO, 2018; Parra et al., 2019). Our specific objectives were the following: (1) to test the performance of the IPCC Tier 1 ensemble approach to simulate soil CO2 emissions; (2) to quantify differences in soil CO2 emissions between agricultural systems and zones across the Villavicencio area by modeling and measuring SOC according to the effect of soil management practices as a first approximation to national inventories; and (3) to assess the performance of the IPCC Tier 1 approach with parameters such as the RMSE, the Nash-Sutcliffe efficiency (NSE), and R2.
Material and methods
The Tier 1 IPCC model
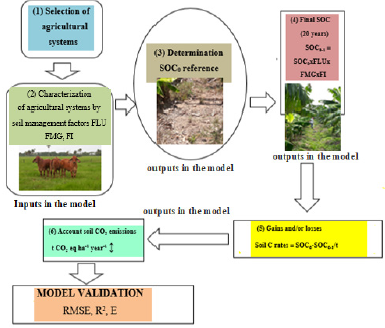
The Tier 1 IPCC model is designed to simulate change in SOC stocks by assigning a reference SOC stock value, which varies depending on climate and soil management factors. To run the simulation, the Tier 1 model requires input parameters regarding the soil management factors (inputs). In this regard, (i) FLU is related to land use (long-term cultivated, paddy rice, perennial/tree crop, set aside); (ii) FMG characterizes the tillage regime (full, reduced, no tillage) for croplands, as well as different pasture management types for grasslands; and (iii) FI describes the carbon input level (low, medium, high without manure, high with manure). These factors come with individual error ranges (between ±5 and ±50%) and must be defined according to climatic conditions (IPCC, 2006). The main parameters (inputs) for modeling SOC changes (outputs) are presented in Figure 2.
Study site and empirical data
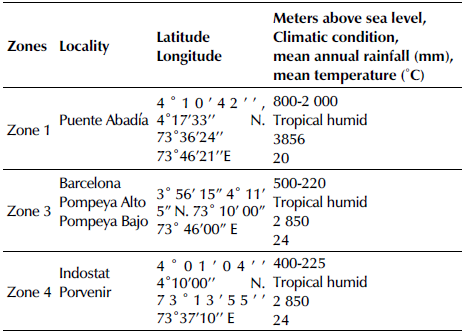
To parameterize the IPCC model, empirical data on local agricultural systems of Villavicencio were used. This area is located in the Meta Piedmont in Eastern Colombia, 4°8'31,2"N and 73°37'35,9"E, and it covers an area of ~1 328 km2 within the sectoral soil analysis (Alcaldía de Villavicencio, 2012). In this study, three zones of agricultural vocation were selected (Figure 3, Table 1).
Table 1 Agro-ecological characteristics of the sampling localities, Villavicencio (Colombia).
Source: Authors
Source: Authors
Figure 3 Map of the location of the sampling sites in the Villavicencio area: zone 1 includes Puente Abadía locality (V1); zone 3 comprises three localities: Barcelona (V2), Pompeya Alto (V3), and Pompeya Bajo (V4); and zone 4 has two localities: Indostant (V5) and Porvenir (V6).
Soils are predominantly acid (Department of Agriculture, 1996). The criterion for the agricultural systems' (land uses) selection was area representativeness. Six agroforestry systems (AFS) were selected in zone 1, 23 in zone 3, and 21 in zone 4. These comprised AFS, croplands (CL), pasture types in different states of degradation, non-degraded pastures (NDP), and moderately degraded pastures (MDP), with different times of use. More information about the collected agricultural systems in each zone is provided in Table 2.
Table 2 Basic information on agricultural systems and the area in the data collection site, Villavicencio (Colombia)
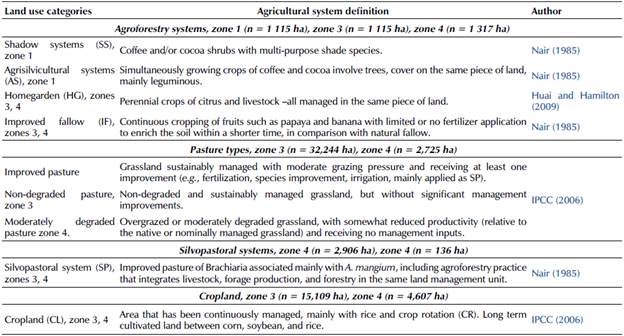
Source: Authors
The criteria for the characterization of agricultural systems were evaluated in situ by monitoring soil management factors (IPCC, 2006). For this stage, site information was employed, where land use transitions included information from five years before the implementation of the current agricultural system, which were often reported to have been assessed via the IPCC Tier 1 methodology (Table 3).
Table 3 Characterization of agricultural systems five years before land use transitions and current land uses with soil management factors related to each zone studied, Villavicencio (Colombia)
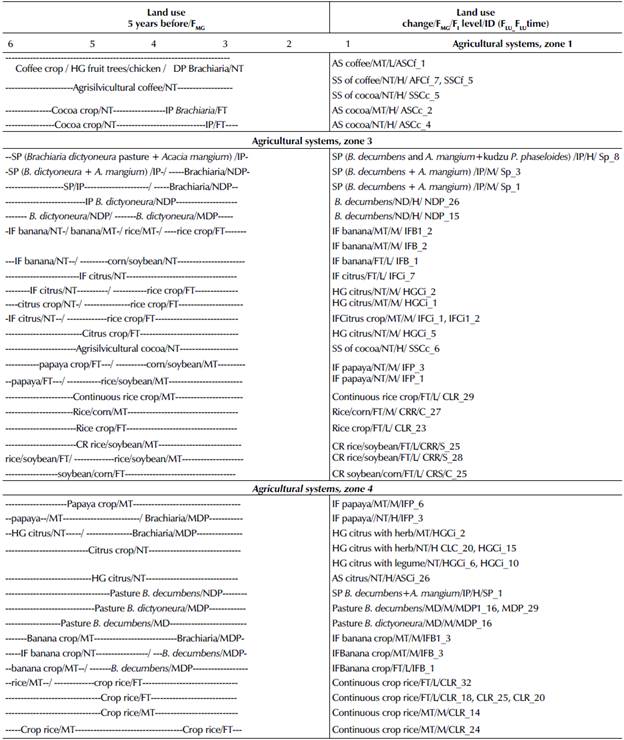
Legend: NT No tillage: Direct seeding without primary tillage, with only minimal soil disturbance in the seeding zone. FT Full tillage: Substantial soil disturbance with full inversion and/or frequent tillage operations (within year). MT Minimum tillage: Including primary and/or secondary tillage, but with reduced soil disturbance (usually shallow and without full soil inversion). AFS: Agroforestry system; SS: Shade system; AS: Agrosilvicultural system; SP: Silvopastoral system; NDP: Non-degraded pasture; MDP: Moderately degraded pasture; CL: Continuous and/or Intensive Cropland; L: Low input; M: Medium input; H: High input.
Source: Authors
The identified soil management factors identified contrasted with the default values in Chapters 5 and 3 (Cropland and Grasslands,Tables 5.5 and 3.4.5) of the IPCC document (2006), which were used as input data for the model. Default values for FLU, FMG, and FI higher than 1,0 correspond to SOC storage, while those lower than 1,0 correspond to SOC loss.
Field measurements for model parameterization
To allow for a standardized analysis compatible with the IPCC guidelines, soil samples were collected (n=150) from the upper 0-30 cm layer (IPCC, 2006). Soil sampling was carried out for four months between January and April 2018 in the study area. The sieved soils were further milled to 0,25 mm in order to measure the initial physical-chemical soil analysis. Bulk density was determined from a core sample (Department of Agriculture, 1996).
The soil organic carbon content before (SOCinitial) in the soil samples was determined according to Walkley and Black (Department of Agriculture, 1996). Initial SOC stocks (SOC0) were determined via Equation (1), as follows:

where SOC0 is the mean of initial soil C stocks (t C ha-1); pb is the bulk density (g cm-3); and d denotes a depth of 0,30 m. In the model parameterization, the dynamics of SOC were projected to 20 years, in sufficient agreement with empirical SOC measurements regarding observed and default values (FLU, FMG, FI) in each field plot (50 selected agricultural systems x 3 replicates = 150 samples). The model inputs required a total of three default values per agricultural system characterized, for a total of 450 parameters in the model, from which a mean was taken for each agricultural system, for a total of 150 data.
Model validation
To evaluate the accuracy of our model parameterization, the model performance was evaluated with four widely used quantitative methods, i.e., the R2 (squared correlation coefficient), which is described in Equation (2); the RMSE (root mean squared error) (Equation (3)) and RMSE/n (Moriasi et al., 2007), a measurement of accuracy calculated as the differences between model-predicted and measured SOC values; and the (E) (model performance efficiency) (Nash-Sutcliffe, 1970), which evaluates the degree of closeness between modeled and observed data (Ludwig et al., 2011) (Equation (4)). These indicators were analyzed with P < 0,005. The statistical analysis was performed using Infostat v. 17.0 for Windows.
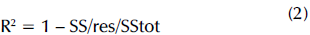
where: SSres= sum (Oi - Pi)2 and SStot = sum (Oi - Ornean)2; Oi = observed values (known results); Pi = expected values or unknown results.
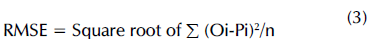
The RMSE ranges from 0 to 100. At an ideal fit, the RMSE is equal to zero. A lower RMSE is better.
The Nash-Sutcliffe model efficiency coefficient E was calculated as follows:
where Ō is the observation mean. A higher E is better, and it can be expressed as a percentage when multiplied by 100 (Smith and Smith, 2007). A linear regression of the simulated SOC (yPi) and observed SOC (xOi) time-series data was performed (Equation (5)):
which resulted in a slope sPi, an intercept IPi, and the coefficient of determination R2. In this sense, only the agricultural systems with the best fit in the model were graphed.
Model application to simulate soil CO2 emissions
After validation, the Tier 1 IPCC model was used to simulate the current SOC initial stock changes in order to assess the effect of soil management factors on SOC final stocks (Equation (6)).

where SOC01 is the mean of the final soil C stocks (t ha-1) over the next 20 years, (SOC0) = SOCinitial Stock (t ha-1); and FLU , FMG, and FI are the default values for soil management (IPCC, 2006). SOC stock changes in the top soil (0-30 cm) over a period of 20 years were calculated as follows (Equation (7)):

where: ΔSOC = losses and/or gains in SOC rates, T = default time for transition between equilibrium SOC values (20 years). ΔSOC can be converted to atmospheric CO2 stored in or emitted from the soil by multiplying the tons of C by 44/12 (the ratio of molecular weight for CO2 and C) (IPCC, 2006).
Results and discussion
Rates of gains/losses of soil C and soil CO2 emis sions for each agricultural system
A significant limitation for model validation was that the change in SOC stock was equated with CO2 emissions, as only input variables had an assigned probability distribution within each default value, depending on the soil management factor identified, without considering other input factors. The observed SOC storage rates regarding the conversion from pasture for coffee-based agroforestry (AFCf_7) in zone 1 were higher than those of the conversion of rice/corn crop rotation for improved banana fallow (IFB_2) of zone 3 (Table 4) -levels: ΔSOC = AFCf_7 = 2,96 t C ha-1 year-1 and IFB_2 = 0,08 t C ha-1 yr-1, accounting for a neutralization of -10,83t CO2eq ha-1 year-1 in AFCf_7, which was due to default values FLU, FMG, and FI in the simulations that demonstrated potential mitigation.
Table 4 Simulated gains and losses of SOC rate data (outputs in the model) considering IPCC default values for soil management factors (inputs in the model) in agricultural systems, Villavicencio (Colombia)
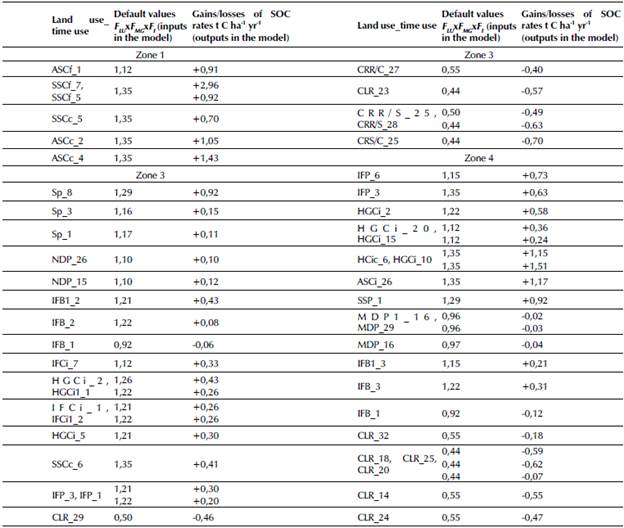
Legend: AS: Agrisilvicultural system; SS: Shade system; SP: Silvopastoral system; NDP: Non-degraded pasture; IF: Improved fallow; HG: Homegarden system; MDP: Moderately degraded system; CL: Cropland; CR: Crop rotation; Cf: Coffee; Cc: Cocoa; B: Banana; Ci: Citrus; P: Papaya; R: Rice; S: Soybean; C: Corn; FLU: land use factor; FMG: pasture management and/or tillage regime in cropland (full, reduced, no tillage); FI:carbon input level (low, medium, high without manure, high with manure).
Source: Authors
The mean stock change factor (default value, ± confidence intervals) was 1,19±0,10 for grassland converted to agroforestry (Cardinael et al., 2018). Poeplau et al., (2011) demonstrated that conversion from grasslands to agroforestry systems did not improve SOC stocks. However, this work agrees that the returns of organic material (leaf litter) in coffee-based agroforestry systems is higher than in the monoculture of coffee as, demonstrated by Zaro et al., (2020). In general, the transition from cropland to an agroforestry system is beneficial to SOC (Lu et al., 2015), as demonstrated in the simulated IFB_2. The results in Table 4 also show that the effect of pasture management on gains/losses of soil C rates varied substantially between NDP_15 compared to the MDP116 of zones 3 and 4 (Table 4) -levels: ΔSOC = NDP_15 = 0,12 t C ha-1 year-1 and MDP1_16 = -0,02 t C ha-1 year-1. These values are in line with those reported by Silva and Orozco (2018) in degraded pastures of Ariari, Meta, Colombia. Typically, in the model-integrated soil management factors, NDP demonstrated better pasture management than MDP. Several previous studies also showed that many pasture techniques have been applied to mitigate GHG emissions from agriculture (Jadan et al., 2015; Parra et al., 2019). A plausible adoption rate of 30% for improved deep-rooted legumes associated to Brachiaria pastures in Cerrado, Brazil, represented a mitigation potential of -29,8 t CO2-eq yr-1 to the atmosphere (Thornton and Herrero, 2010). However, belowground C-inputs from exudation and root sloughing from C4 grasses are high in Brachiaria pastures, forming the base for soil organic matter buildup in these systems (Anderson-Teixeira et al., 2016). Moreover, elements from agricultural systems (the impact of pasture management and grazing on growth and yield) need to be included in the modeling in order to allow predicting future food security (Van et al., 2018). The responses of our predictions showed that the adoption of silvopastoral systems SP_1 and SP_8 stemming from pastures by farmers of zone 3 resulted in a significant absorption of soil CO2 emissions (Table 4) -levels: -3,37 and -3,39 t CO2 eq ha-1 year-1, respectively. In the tropical zone of Colombia, Parra et al. (2019), using the Tier 1 IPCC approach (2006), showed that a silvopastoral system had the highest potential for offset GHG emissions (-4,8 t CO2eq ha-1 year-1) due to soil C accumulation plus biomass C fixation in Acacia trees. Soil C sequestration by the world's grasslands could offset up to 4% of global GHG emissions (IPCC, 2006). This research showed that 34% of the agricultural systems evaluated (7 and 10 out of the 23 and 21 agricultural systems of zones 3 and 4) turned out to be CO2eq emitters, mainly due to CL and MDP (Table 4). Default emission factors used in the Tier 1 IPCC model can be further sources of uncertainty, as they may not be representative of SOC changes and, in many cases, they can under- or overestimate soil CO2 emissions and/or absorptions (FAO, 2018; Silva and Orozco, 2018). Soil C losses rates differ considerably between continuous the crop rotation of soybean/corn CRS/C25 including FT of zone 3 and the MDP B. decumbens MDP116 with MT of zone 4 (Table 4) -levels: ΔSOC = CRS/C 25 = -0,70 and MDP116 = -0,02 t C ha-1 yr-1. In fact, easily decomposable materials are fully or partially depleted, and the microbial population and decomposition rate of litter materials decline due to full tillage (Lal, 2018). Reduced tillage and 'no till', residue incorporation, improving soil biodiversity, and mulching enhance the sequestration of carbon in the soil. NRCS conservation practices can be expected to sequester approximately 0,07 to 0,96 t C ha-1 yr-1 due to improved soil management in croplands (Chamber et al., 2016).
Representativeness of soil CO2 emissions by each category of land use and each zone across the Villavicencio area
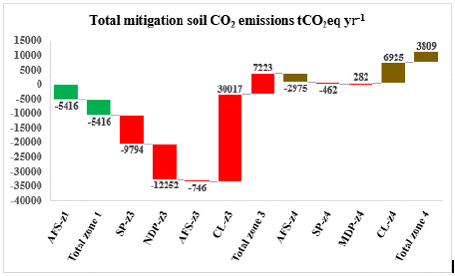
The simulated total of contributions regarding emission and/ or neutralization of soil CO2 across the Villavicencio area, zone 1 (comprising AFS), account for -5 416 t CO2eq yr-1 (Figure 4, Table 5) (-4,86 t CO2eq ha-1 yr-1 * 1 115 ha), which is possibly due to a high SOC initial state (Table 5) and a higher default value used in the simulation. This is shown in Table 4.
Source: Authors
Figure 4 Contribution of soil CO2eq emissions and sinks in each land use category and zone across the Villavicencio area, which was computed (SOC rates tC ha-1 yr-1 x area (#ha) x 3,65) based on the changes in SOC storage reported in Table 4. Soil CO2 emissions are negative in the face of stored SOC and positive with released SOC. Legend: AFS: agroforestry systems; SP: silvopastoral systems; NDP: non-degraded pastures; CL: cropland; MDP: moderately degraded pasture; z: zone.
Silva (2018) found that the SOC initial state has the greatest impact on emissions dynamics. Numerous studies across the globe demonstrate that the use of integrated practices such as AFS can increase soil C gains by 10-60%, thus reducing the carbon emissions associated with the residue inputs by 20-50% (Nair, 2012). For example, a cocoa AFS has the capacity to sequester about 3 t C ha-1 year-1, with a reduction of 11 t CO2eq ha-1 year-1 (Jadan et al., 2015). On the other hand, zone 3 showed the highest soil CO2 emissions across the Villavicencio area, followed by zone 4, due to the contributions of CL (Figure 4), i.e., 7 223 t CO2eq yr-1, and 3 809 t CO2eq yr-1, respectively. As shown in Table 5, the lowest initial SOC stocks mostly appear in the continuous CL of zones 3 and 4, where there is no land use transition between rice crops and crop rotation and soils are frequently disturbed by full tillage. Soil conservation practices such as crop rotation can fix a large amount of soil organic C and achieve a balance in C storage as long as full tillage is not performed (IPCC, 2006). Efforts for the mitigation of soil CO2 should focus mainly on zones 3 and 4, adopting more sustainable soil management practices. In a study by Silva (2018), conversion from rice monoculture or crop rotation would increase the soil C stock by about of 12,3 t C ha-1 in 20 years, equivalent to 0,61 t C ha-1 yr-1, which would reduce emissions by 2,27 t CO2eq ha-1 year-1. In zone 3, the contribution of NDP to the mitigation of emissions (-12 252 t CO2eq yr-1) (Figure 4) is more influenced by the area planted (ha) than by the rates of soil C gains per year (Table 5). However, the time reference of the NDP does not usually pose a challenge. This change is usually fast -soon after the introduction of the new practice- and eventually stabilizes when a new equilibrium is close by (FAO, 2018). The silvopastoral systems of zone 3 and 4 stemming from the conversion of NDP showed an apparent SOC storage (Table 4) and neutralizations of -9 794 and -462 t CO2 eq yr-1, respectively (Figure 4). MDP contributed with 7,40% of the total emissions of zone 3 (Figure 4). Converting degraded grassland to silvopastures could increase SOC stocks ((Mangalassery et al., 2014). Silvopastoral systems are agricultural strategies that can act positively for the potential mitigation of soil CO2 emissions (Parra et al., 2019). As pointed out by the FAO (2018), there is a significant lack of rigorous data on C sequestration in silvopastoral systems, since a large amount of the root inputs (FI) of trees can be incorporated into these systems.
Model validation analysis
Among all zones, zone 3 was the best reproduced by the model (Table 5) -levels: RMSE = 3,96 t C ha-1, RMSE/n = 0,05 t C ha-1, Nash-Sutcliffe E= 0,33. The levels for zone 4 were (Table 5): RMSE = 10,95 t C ha-1; RMSE/n = 0,17. In the agricultural systems of zone 1, a clear assessment of the source of deviations between the simulated and measured SOC data was difficult (Table 5) -levels: RMSE = 29, RMSE/n = 1,61 (Figure 5a). The modeled SOC accounted for 111,66 t C ha-1 over the entire measurement (86,47 t C ha-1) (Table 5), which implies an overestimation of 29,13% by the model.
Table 5 Representativeness of soil CO2 emissions by category of land use in each zone across the Villavicencio area and relationships of observed and simulated SOC data with statistical analysis R2, RMSE, RMSE/n, and model efficiency E.
Legend: The RMSE unit is the amount of t C ha-1 standard deviations of the residuals (prediction errors). E is the Nash-Sutcliffe model efficiency. AFS: Agroforestry system; SP: Silvopastoral system; ND: Non-degraded pasture; MDP: Moderately degraded pasture; CL: Cropland.
Source: Authors
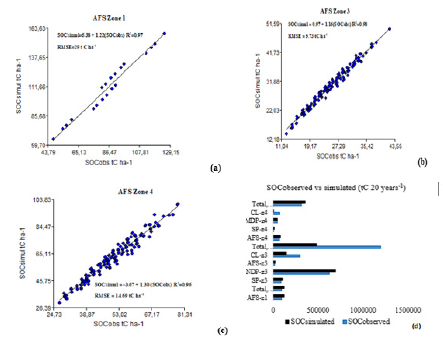
Source: Authors
Figure 5 a) Relationship between observed and simulated SOC for AFS, zone 1; b) relationship between observed and simulated SOC for AFS, zone 3; (c) relationship between observed and simulated SOC for AFS, zone 4; d) relationship between observed and simulated SOC (tC 20 years-1) for the agricultural systems in Table 5 (total ha). Legend: AFS: agroforestry systems; SP: silvopastoral systems; NDP: non-degraded pastures; CL: cropland, MDP: moderately degraded pasture; z: zone.
This is possibly related to several factors, mainly the high input factor (FI) due to manure application in these systems. Many controversies continue to arise as to the fact that conversion from pasture to AFS does not improve SOC stocks (Poeplau et al., 2011 ; Cardinael et al., 2018). Fujisaki et al. (2015) found slightly higher SOC stocks in grasslands than in forests. In this sense, more precise simulation models must be elaborated which consider the monitoring of soil C stocks from previous systems. The main difficulty to properly assess SOC changes in agroforestry systems compared to other land uses is spatial heterogeneity (Cardinael et al., 2018). However, there were stronger and more significant R2 between the SOC0 and SOC0 for all of the AFS than for the NDP and MDP in zones 3 and 4 (Table 5). In global Tier 1 IPCC models for simulating grasslands, the model ensemble is highly uncertain, partly due to the difficulty in characterizing diverse grassland systems (Ogle et al., 2004). The linear regression of the simulated and observed SOC data shows a better fit for the AFS of zone 3 (Figure 5b) -levels: R2 = 0,94, SOCsimulated = 0,97+1,16, SOCobserved, P < 0,005- that for those in zones 1 and 4 (Figures 5a, 5b, and 5c). An adjustment of these parameters with local data may be required to improve estimations (Figure 5d), as supported by FAO (2018). AFS management options targeting increases in leaf litter inputs could be a promising strategy to increase the SOC content. The SP of zones 3 and 4 differ considerably in terms of RMSE and RMSE/n (Table 5) -levels; RMSE = 9,52t C ha-1 and RMSE = 10t C ha-1, respectively-, but the RMSE/n was higher in zone 4 due to a lower number of samples (Table 5). One significant limitation in assessing the suitability of process-based models can be the small number of datasets used. The livestock farmers of zone 3 and 4 can influence root biomass and thus SOC inputs by grazing management, as well as the plant species composition (Henderson et al., 2015). The Nash-Sutcliffe efficiency (E) coefficients supported the results of the statistical analysis conducted for the RMSE values. The mean values of said coefficients for the AFS of zone 3 was equal to 51% (Table 5). The continuous cropland system (CL) also demonstrated a better match between the modeled and measured SOC contents (Figure 5d), especially in zone 3, where the value of the positive Nash-Sutcliffe E coefficient reached 31% (Table 5). However, the NDP of zone 3 showed a low model E in predicting SOC changes, as well as a higher deviation in the observed and measured SOC (Table 5) -levels: E = 10%, RMSE/n = 2,02 t C ha-1-, probably because the pastures exhibited a greater degree of SOC degradation variability. The uncertainty of SOC models for grazed grassland will likely be large, probably larger than that for models applied to croplands (FAO, 2018). Certainly, in all possible combinations of the observed FLU, FMG, and FI default values in the calibration, the inclusion of AFS in zones 3 and 4 yielded the best results.
Conclusions
As climate change research becomes more and more relevant, agroforestry system (AFS) models can play a major role in understanding the interplay between environmental change, SOC, and the functioning of these systems. In this sense, GHG simulations across Villavicencio zones showed that the highest removals took place in the AFS of zone 1 (-5 416 t CO2 eq yr-1). However, the better matches for AFS (between observations and simulations) were obtained in zones 3 and 4 in comparison with zone 1 (RMSE/n = 0,05, 0,17, and 1,61 t C ha-1). In zone 1, there may be an overestimation of the modeled SOC in AFS. Our simulation analyses clearly indicate that a pathway for the reduction of soil CO2 emissions is possible through a wide-scale adoption of different types of AFS that can optimize soil management factors for increased SOC. Silvopastoral systems (SP) have gained large attention during the last decades due to their SOC accumulation and should be considered to improve Moderately Degraded Pastures (MDP). In zones 3 and 4, the potentially significant negative impacts on soil CO2 emissions (7 223 and 3 809 t CO2 eq yr-1, respectively) are due to SOC losses in Intensive Cropland (CL), which account for 30 017 and 6 925 t CO2 eq yr-1. In this sense, in CL, the reduction of soil CO2 emissions can generate a large portion of the needed mitigation through the adoption of cropping rotation and soil management practices such as minimal tillage and higher above-crop residues. AFS are important Factor Land Use (FLU) to incentive low-carbon footprint agriculture, as a plan by the Colombian Government to reach its GHG emission reduction targets.

