Inglés (pdf)
 Articulo en XML
 Referencias del artículo
 Enviar articulo por email
 Citado por SciELO
  Citado por Google
  Similares en
SciELO
Similares en
SciELO  Similares en Google
 Permalink
Introduction
It is generally accepted that chemical, physical, and biological processes intervene in the remediation of waste and soils contaminated with hydrocarbons (Volke and Velasco 2002; Riser-Robert, 2019). The use of bioremediation methods has aroused a considerable research interest and currently provides advantages over other treatment processes (Kumar et al., 2011; Tyagi et al., 2011; Thapa et al., 2012; Varjani, 2017; Yuniati, 2017; de Oliveira et al., 2018). Among the bioremediation methods, biopiles are an ex situ technology where the stimulation of microbial activity is achieved through the direct addition of nutrients and texturizers (agro-industrial organic wastes), as well as aeration and humidity control (Velasco and Volke, 2003; Prakash et al., 2015; EPA, 2017; Martínez et al., 2017; Ossai et al., 2020).
The removal efficiency of biopiles is influenced by a considerable number of variables, which can be grouped into three categories: the characteristics of the soil and texturizers, the characteristics of the pollutant, and climatic conditions. Among the essential factors are the hydrocarbon concentration, the texturizer content, the moisture content, and the C:N:P:K ratio (Velasco and Volke, 2003; Prakash et al., 2015; EPA, 2017; Yuniati, 2017; Al-Hawash et al., 2018).
Moreover, the response surface methodology is widely known as an experimental strategy that allows finding the best-operating conditions for a process. Particularly, the Box-Behnken experimental design is an excellent economic alternative because it requires a minimum of experimental runs to study three or more factors at three levels (Gutiérrez and de la Vara, 2012; Montgomery, 2017). During the past decade, the Box-Behnken design has been extensively applied to hydrocarbon bioremediation research (Agarry and Ogunleye, 2012; Martínez et al., 2015; Khaled et al., 2016; Shuo et al., 2019; Zhang et al., 2020).
Although these procedures guarantee an individual optimum, when more than one response variable is of interest in the arrangement, the global optimum is generally not the combination of the optimizations performed by the independent variables. Therefore, it is necessary to find a compromise solution where all the variables have a satisfactory level. This solution is recognized as a simultaneous optimum (Montgomery, 2017).
Statistical data report that, in the province of Cienfuegos, Cuba, there is still confined oiled sludge resulting from the territorial companies' collection, which amounts to 2 993 740 kg (CITMA, n.d.; Castro et al., 2022a). In this vein, the Environmental Studies Center of Cienfuegos (CEAC), the Institute of Marine Science (ICIMAR), and the Soil Research Institute (IIS) are three Cuban Institutions that have developed the project Evaluation of the ecotechnology of biopiles for the bioremediation of oily waste using local texturizers (BIOPILA).
The BIOPILA project aims to address an innovative and resilient technique to cope with the environmental problem of soil polluted with hydrocarbons in Cuba, specifically with the residues generated by the local industry which remain confined without a solution (Castro et al., 2022a). Previous research carried out within the framework of the aforementioned project has shown, at the bench scale, the relevance of biopile ecotechnology for the degradation of soils polluted with hydrocarbons (Gutiérrez et al., 2021; Castro et al., 2022b, Gutiérrez, et al., 2022; Castro et al., 2022c). Significant removal rates were reported for oils and grease concentrations (between 50,05 and 66,08%). For TPH, values between 40,00 and 59,12% were reported for all experimental treatments tested. However, neither the way in which the biopile design variables reported by Gutiérrez et al. (2020) should be operated nor the abiotic factors described by Casals et al. (2020) were sufficiently clear in terms of their influence on the bioremediation efficiency of waste and soil polluted with hydrocarbons. Hence, as part of the research-development BIOPILA project, this paper focuses on determining the best operating variable ranges of biopile ecotechnology at the bench scale. Moreover, the simultaneous optimization of biopile hydrocarbons removal was implemented as a prototype to obtain a compromise solution that maximized the mass of TPH removed while keeping the pollutant concentration under the Cuban disposal regulations.
Materials and methods
Some bench-scale experiments were carried out with biopile ecotechnology to bioremediate hydrocarbons. This technique has proven to be more efficient than others in removing hydrocarbons from sludges (Shahryar, 2017). Moreover, it has the advantage that the microorganisms are already adapted to the site conditions (Casale et al., 2018).
Figure 1 presents the heuristic diagram of the experimental protocol used in the bench-scale experimentation phase. The operating variables of interest for this research only comprised those related to the Evaluation of hydrocarbon degradation stage (highlighted in bold in Figure 1).
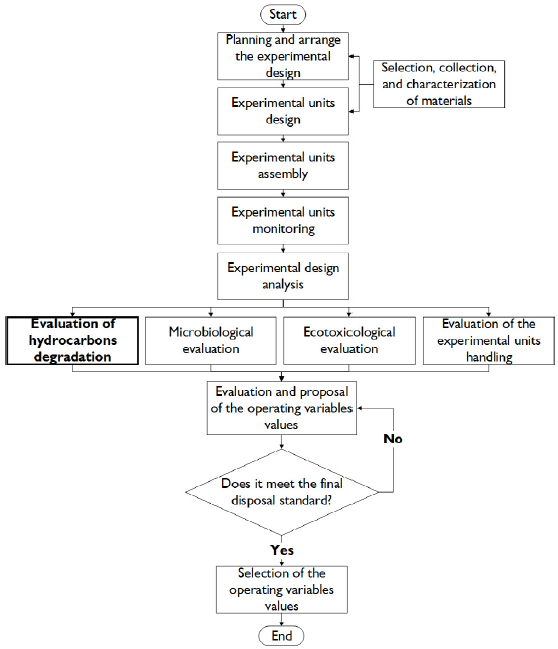
Source: Authors
Figure 1 Heuristic diagram of the experimental protocol used in the bench-scale experimentation phase of the BIOPILA project
Under methodological convergence, several engineering tools were used, such as the design of experiments, mass balance, analytical chemistry, engineering design, and statistical analysis. The experimental polygon consisted of an industrial warehouse, roofed, with a concrete floor and provided with open windows, where 15 experimental units were settled within identical polyethylene basins that were 1,10 m long and 0,95 m wide. Each basin acted as a container to avoid mixing materials and leakage, separating each experimental unit from the surroundings.
Selection, collection, and characterization of materials
The critical materials used for the experimentation are detailed below:
A mix of solid waste and soils contaminated with hydrocarbons, collected from the bottom of a settler.
Representative soil from the central region of Cuba with low agricultural potential, selected as a pattern soil.
A predetermined combination of two different agro-industrial wastes, which were mixed as a texturizer.
Firstly, the oily sludge was retrieved during the cleaning procedures in the waste treatment plant of an oil refinery.
Secondly, a typical greyish-brown soil from the central region of Cuba was used (density = 1 190 kg.m-3). The soil was classified as silty clay sand, with low plasticity and moderate permeability. It was sieved using an industrial mesh for particles smaller than 4,75 mm, according to Cuban standards based on ASTM norms (ASTM International, 2002, 2017).
For the mixture of texturizers, the best candidates for different treatments were selected, which had been tested in previous stages of the BIOPILA project (Casals et al., 2020; Gutiérrez et al., 2020; Castro et al., 2022c; Castro et al., 2022d). On the one hand, the candidate which reported the lowest TPH concentrations at 240 days, the highest degradation kinetic rate, and the shortest half-life (t1/2) among all the considered treatments was used. On the other hand, the treatment that maintained the necessary water content requirements in the biopiles was also included in the mixture, with values of up to 35% moisture, increasing the soil porosity and contributing to soil moisture retention according to the criteria of Zang et al. (2020).
Finally, it is remarkable that the flora stimulated during the technological process was composed of the individual contributions of the microorganisms in each component of the biopile mixture (oily sludge, soil, and texturizers). The kinds and initial concentrations of the main groups of microorganisms identified in the mixture were total heterotrophic bacteria, filamentous fungi and yeasts, and hydrocarbon degraders, in the orders of 106 CFU.g-1, 104 CFU.g-1, and 105 CFU.g-1, respectively. The concentrations above ensured a total heterotrophic bacteria concentration greater than 103 CFU.g-1, in line with the initial requirements established for biopile efficacy (EPA, 2017).
Planning and organizing the experimental design
The procedure used to conduct this study was developed by following the criteria given by Gutiérrez and de la Vara (2012) and Montgomery (2017). Its seven steps are contextualized below:
1. Defining the problem: The problem matches the focus and goal of the paper, as declared in the introduction section.
2. Choosing the response variables: The mass of TPH removed and the final concentration of TPH (240 days). The TPH was determined by adapting the EPA Method 1664 to the biopile system, which was determined analogously to the previous stages of the BIOPILA Project described in Castro et al. (2022). The analysis is based on TPH extraction from a solid by an organic solvent and the gravimetric evaluation of the TPH mass. This method is reliable when the solid sample is over 5 g and the TPH concentration is over 0,3% by weight.
The applied method consists of extracting a dry soil sample with n-hexane in a microwave at 120 °C for 20 min. Then, the extract (n-hexane + TPHs) is filtered through a funnel containing anhydrous Na,SO4. Afterwards, the solution is distilled at 85 °C in a water bath. Then, the residual mass is weighted in order to estimate the TPH quantity by gravimetry. The TPH concentration is achieved by the ratio of TPH mass to the dry sample soil mass.
The TPH mass removed was determined from the initial and final concentrations of TPH and the mass of the experimental unit according to the following Equation:
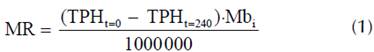
where:
MR: Mass of TPH removed in the experimental unit (kg) TPHt = 0: TPH concentration in the experimental unit at 0 days (mg.kg-1)
TPHt = 240: TPH concentration in the experimental unit at 240 days (mg.kg-1)
Mbi: Mass of the experimental unit (kg)
3. Determining which factors should be studied according to the supposed influence on the response: Since biopile is an ex situ technique, the factors of interest were established and organized. The step Selection, collection, and characterization of materials constituted the cornerstone to implementing the material balance according to the procedure described in previous research (Gutiérrez et al., 2020).
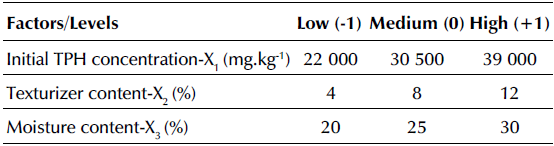
The factors of interest in the experiment were: texturizer content (% mass), moisture content (% mass), and the initial concentration of TPH (mg.kg-1) in each experimental unit. The latter should be less than 50 000 mg.kg-1 according to the effectiveness criterion established by EPA (2017).
4. Selecting the levels of each factor: The levels of the factors studied are shown in Table 1 .
5. Selecting the appropriate design for the experiment goal and the factors of interest: the Response Surface Methodology was adopted, and a three-factor Box-Behnken was selected based on the criteria stated below.
Box-Behnken designs are built by combining 2n designs and incomplete block designs. This design is still considered to be more proficient and potent than other designs -such as the three-level complete factorial design, the central composite design (CCD), and the Doehlert design-, despite its poor coverage of the corner of the nonlinear design space (Karmoker et al., 2019). Specifically, for three factors, the Box-Behnken design has 15 treatments, where the coded factor levels exhibit a complete set of the treatment combinations for a 2n factorial for each pair of factors at their high and low levels (-1; 1), accompanied by the middle level (0) of the remaining factor (12 treatments). In addition, three replicates of the center of the design (0, 0, 0) are included in accordance the criteria of Kuehl (2001) and Gutiérrez and de la Vara (2012).
The design was executed in a single block. In addition, the order of the experiments was entirely randomized with the aim to protect the effect of hidden variables.
6. Planning and organizing the experimental work: A worksheet was designed with the specifications of each treatment, the order of the runs, and how the data would be collected. Furthermore, the personnel involved in each activity were defined, as well as the general and specific instructions to be followed at any moment, including the logistical needs and the work schedule.
7. Implementing the experiment: Implementation was carried out according to the design plan described in the previous items.
Experimental unit design
According to previous research, the established design principles, and criteria for biopile ecotechnology were adapted to the bench scale (BATTELLE-NFESC,1996; Wu and Coulon, 2015; Abdul and Webb, 2017; EPA, 2017; Martínez et al., 2017). In addition, the constraints imposed not only by the experimental array, but also by the dimensions of the experimental polygon, were considered.
As previously reported by Gutiérrez et al. (2020), a validated technical design protocol was implemented. This design included mass balance at the level of each experimental unit to determine the mass of each component in the biopile. According to the planning levels in the experimental design, the balance calculations assumed TPH concentrations of the only material in the biopile mixture, as well as the predefined percentage of texturizing agent in each experimental unit. Similarly, not only were the dimensions of the biopiles determined, but also the mass of nutrient amendments required to maintain the C:N:P:K ratio in the order of 100:10:1:0,1 respectively. Moreover, a simple random procedure was employed to intercalate each experimental unit in the polygon layout.
Experimental unit assembly
The preparation and stabilization of the system composed of waste and soils contaminated with hydrocarbons, as well as the conformation of the experimental units, were carried out according to previously established protocols (Gutiérrez et al., 2020). Furthermore, the mass balance calculations determined the mass of water to be added in order to achieve the required moisture percentage. Each biopile was shaped like a truncated pyramid, with a height of 0,2 m and an angle of 45° between the lateral pyramid faces and the bases. The initial total mass of each bench-scale biopile was set at 38 kg, varying the mass of the mixture's components depending on the experimental conditions in Table 1, and according to the adopted experimental array (Box-Behnken). Accordingly, the experimental units (treatments) had different dimensions (except for the three central points), varying in the range of 0,82-0,92 m regarding the length of the more extensive base of the truncated pyramid, and 0,55-0,61 m regarding its width. The shorter base dimensions varied in proportion to the larger ones, and their relationships with the established height and the angle of repose.
Experimental unit monitoring
The biopiles were monitored and controlled according to the following activities and times:
1. Homogenization and aeration (every 15 days): The solid substratum of each experimental unit was manually homogenized and aerated in its tray, destroying the initial geometry design (truncated pyramid) and intensively mixing all the mass, emphasizing the destruction of lumps.
2. Handling and shaping (every 15 days): Each time the experimental unit was homogenized and aerated, it was subsequently modeled according to the standardized relationship between the dimensions of the base, the height, and the angle of repose of each treatment, as well as the moisture content. To reduce variability, shape templates were established for this operation.
3. Humidification (every four days): The weight of water to be added to each experimental unit was determined via mass balance calculations, starting from the percentage of absolute water content, to achieve the final moisture percentage required, which agreed with the level array of this variable assigned to each treatment.
4. Temperature and water content monitoring (every seven days): The temperature (T) and water content (WC) were monitored and recorded on a worksheet designed for that purpose.
5. Physical-chemical monitoring (time: 0, 50, 100, and 240 days): The content of each experimental unit was sampled to determine the concentration of TPH by following the method described above. The biopiles were appropriately homogenized before the collection according to that described in item 1. Five samples with a mass of around 100 g were taken from the four corners of the basin and the center, alternating between bottom and surface samples. Finally, quartering was performed, and 100 g were taken to determine the TPH concentration. The samples were uniformly dried and grounded as part of the pretreatment to increase homogeneity. Then, they were spread on aluminum foil inside a room at a controlled temperature of 30 °C for 48 h.
Experimental design analysis
Afterwards, all of the data were statistically processed, and analyses were performed using a confidence level of 95% via the professional software STATGRAPHICS Centurion v. 16.1.18. In addition, Excel calculation books were used. During this stage, both tabular and graphical tests were performed. The main tests conducted were an Analysis of Variance (ANOVA), a Correlation Matrix and a Regression Coefficients Analysis, a Standardized Pareto Diagram, a Main Effects Graph, Interaction Graphs, and Response Graphs. Furthermore, the orthogonality and rotational properties were analyzed and associated with the model quality estimation.
The contribution of each term in the simple ANOVA to the explanation of the response variable was evaluated using the individual model coefficients, where p-Value<Statistic signification (a=0,05) indicates that the model terms are significant. The model was refined using variable selection by backward steps. Furthermore, it was verified that the model-adjusted coefficient of determination (R2 aj) would be more significant than 70%, as recommended by Montgomery (2017).
Subsequently, the surface described by the validated individual models was explored in order to find the factor levels combination, which turned to be at an optimal point for the response variable. Moreover, simultaneous optimization was performed to obtain a compromise solution, not only to maximize the mass of TPH removed, but also to ensure compliance with the final concentration of TPH in the Cuban regulation for hydrocarbons final disposal, which establishes a maximum limit of 10 000 mg.kg-1 (ONN, 2017). In this line, the analytical method based on the desirability function was implemented as described in Montgomery (2017).
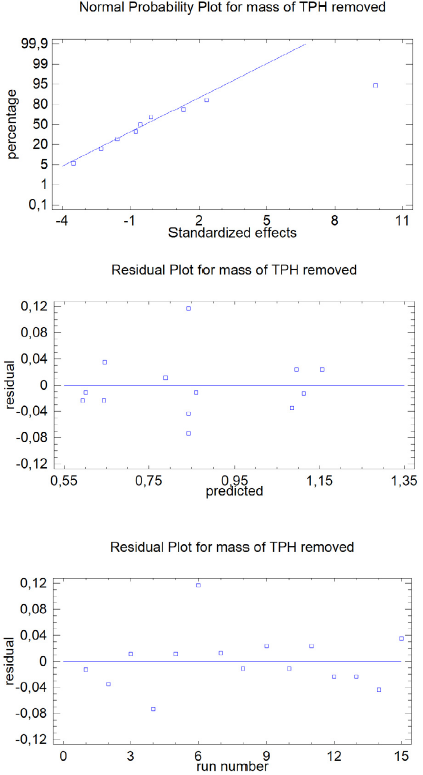
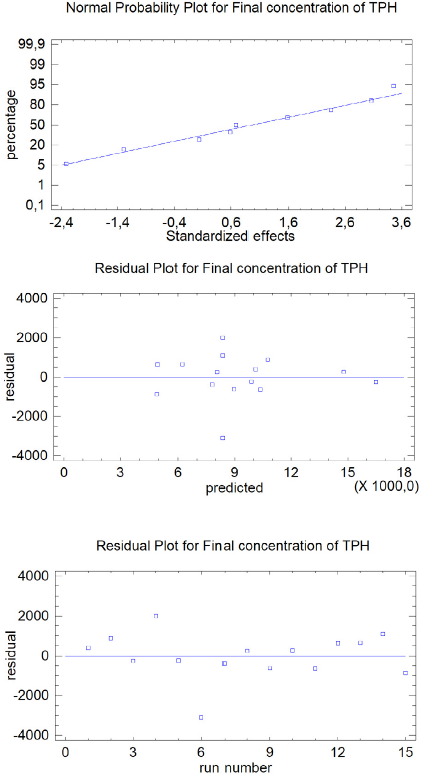
Finally, the assumptions of normality (normal probability plot), constant variance (residuals vs. predicted), and independence of the residuals (residuals vs. run number) were verified.
Results and discussion
Interpretation of the experimental design analysis results
Using the methods described above, the refined models' ANOVA for both response variables can be observed in Tables 2 and 3.
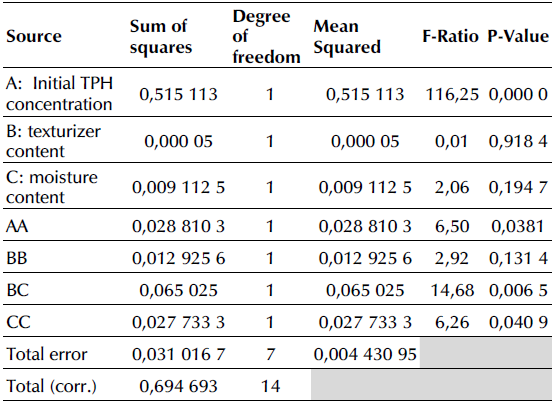
In the individual model of removed mass, the initial TPH concentration (A) was significant. It was also corroborated that it was the factor with the most influence on the response variability. Furthermore, the initial TPH concentration (A) is also significant in the individual model of final TPH concentrations. It is also noteworthy that the effects of factors A and C are greater than that of factor B, given that, when the former are increased, they further modify the variability of the response.
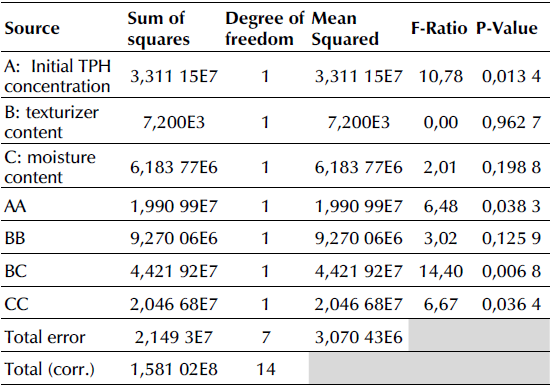
Although the first-order effects of the texturizer (B) and moisture (C) contents did not turn out to be significant, they were maintained in the models given the need to obtain a hierarchical model. Indeed, it is recognized that, in the Response Surface Methodology, this kind of model is preferred (Gutiérrez and de la Vara, 2012; Montgomery, 2017). Therefore, both terms were maintained in both models, as the BC interaction resulted to be significant. On the other hand, the quadratic interaction BB was also kept in both models because its elimination implied a decrease in the R2 aj.
The fitted mathematical models that describe the behavior of the mass of TPH removed and the final TPH concentration are presented in Equations (2) and (3), respectively.
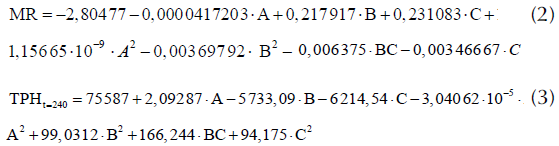
where:
MR: mass of TPH removed in the experimental unit (kg)
TPHt = 240: TPH concentration in the experimental unit at 240 days (mg.kg-1) (final concentration)
A: Initial TPH concentration (mg.kg-1)
B: Texturizer content (% mass)
C: Moisture content (% mass)
Reasonable coefficients of determination were obtained from Equations (2) and (3), R2 MR = 95,54% and R2 TPHt=240 = 86,41%. Although these results are barely lower than the R2 reported in similar research (Agarry and Ogunleye, 2012; Zhang et al., 2020), it could be inferred that the models, adjusted in this way, explain a considerable percentage of the total variability. On the other hand, according to the criteria given by Gutiérrez and de la Vara (2012), the adjusted coefficient of determination (R2 aj) is more suitable for comparing the models of Equations (2) and (3). Regarding this issue, it yields values of R2 ajMR = 91,07% and R2.TPHf= 72,81%; in both cases, the required 70%, in agreement with the criterium of Montgomery (2017), is appreciably exceeded. Consequently, Table 4 shows the final TPH concentration values obtained through laboratory tests of the samples obtained from monitoring and the values adjusted by the model of both response variables for each treatment and levels assigned to the three factors under study.
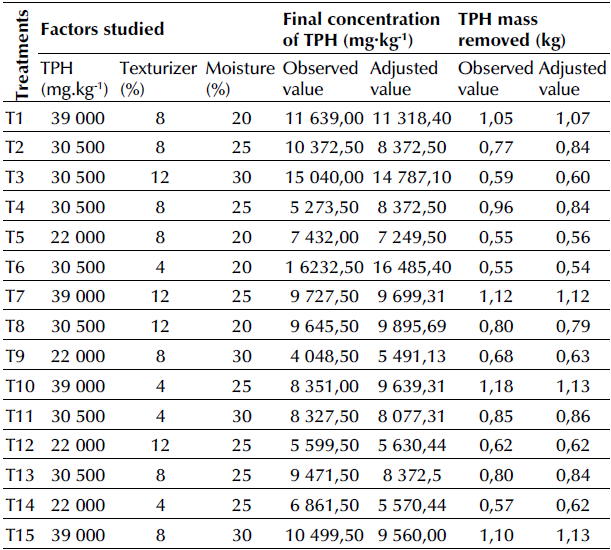
By comparing the observed and adjusted values in Table 4, a similar behavior could be appreciated in the 15 treatments, with no sudden changes and variations, which is consistent with Agarry and Ogunleye (2012) and Shuo et al. (2019).
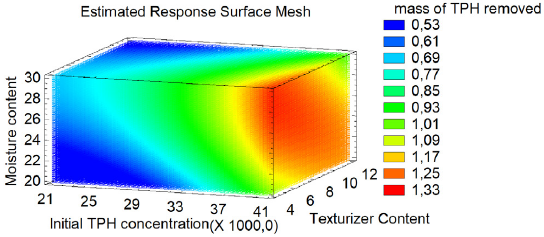
Figures 2 and 3 illustrate the estimated response surface mesh for both response variables under analysis.
Source: Authors
Figure 2 Estimated response surface mesh for the model regarding the mass of the TPH removed (kg)
As shown in Figure 2, the highest mass of TPH removed (between 1,17 and 1,33 kg) is found in the region comprised simultaneously by the low and high levels of moisture and texturizer content, along with the high level of the initial TPH concentration.
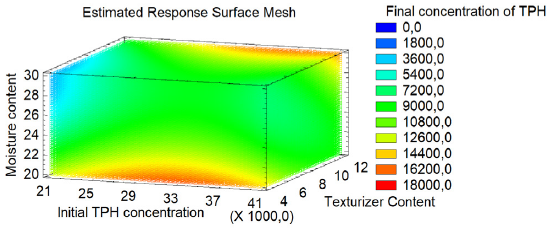
On the other hand, in Figure 3, it can be observed that the region with lower final concentrations of TPH (up to 5 400 mg.kg-1) was found where there was a lower initial concentration of TPH and lower texturizer content but higher moisture content.
Table 5 shows the values of the studied factors for which the desirability was maximum (1), according to the results of the simultaneous optimization.
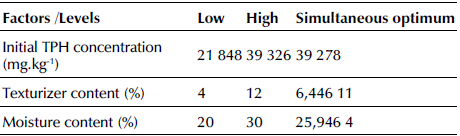
For the levels associated with desirability, a significant TPH mass of 1,19 kg was removed, representing 79,58% of the initial TPH concentration. Likewise, a final TPH concentration of 8 000 mg/kg was obtained, which reasonably complies with the final disposal standards of Cuba.
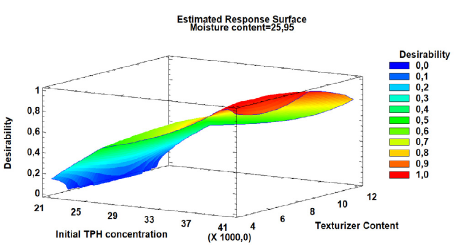
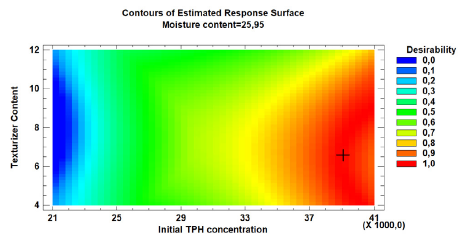
Figure 4 shows the estimated response surface plot for the desirability function, and Figure 5 shows the contour of the estimated response surface for the same function. In both cases, the moisture content factor was kept at its optimum value (25,95 %).
The optimum moisture content where the desirability was maximum (approximately 26%) is under the levels of moisture percentage by weight (12-30%) recommended by EPA (2017) for the design of biopiles.
In addition, the optimum also fits the qualitative criteria of manipulation, as evidenced during the experimental phase, because the experimental units with a high moisture content had severe difficulties in their handling. Specifically, these biopiles (30% of moisture content) exhibited marked differences from the ones in the medium and low levels regarding moisture content, thus producing puddling of the mass and a more significant generation of leachates, with a proven transfer of the pollutant to the aqueous medium.
Source Authors
Figure 4 Estimated response surface for the desirability function the % of moisture at its optimum level
Source: Authors
Figure 5 The contour of the estimated response surface for the desirability function keeps the moisture content at its optimum level
By interpreting Figures 4 and 5, it can be confirmed how the values of the factors shown in Table 5 could achieve optimum desirability. In addition, it was observed that the desirability function is maintained around the maximum for texturizer content values between 6 and 10%, keeping the other two studied factors at their optimal values.
Additionally, the models' assumptions can be graphically verified for both response variables, as shown in the Appendices (Figures 6 and 7).
Conclusions
It was remarkable that the statistical analyses and the closeness of the experimental results and model predictions show the reliability of the regression model. The highest mass of TPH removed was obtained in the region defined by the high initial concentration of TPH and the levels from low to high regarding the texturizer and moisture contents. On the other hand, the lowest values for the final TPH concentrations were found in the region defined by the high moisture content factor and the low levels of both the initial TPH concentration and the texturizer content.
It was crucial to obtain a simultaneous optimum with initial concentration values of TPH of 39 278 mg.kg-1, a texturizer content of 6,45%, and a moisture content of 25,95%. For these values, it was possible to maximize the mass of TPH removed and maintain the final TPH concentration of 8 000 mg.kg-1, lower than that stipulated by the Cuban disposal standard. The mass of TPH removed remained in the range of the compromise solution for texturizer content values between 6 and 10%. At the same time, the other two factors studied were kept at their optimal values.
Finally, this research responded to a scientific demand for the continuity of the subsequent stage of the research-development BIOPILA project. The results are encouraging and should be validated during the ecotechnology scale-up processes, i.e., into a pilot scale.