


 Inglés (pdf)
 Articulo en XML
 Referencias del artículo
 Enviar articulo por email
 Citado por SciELO
  Citado por Google
  Similares en
SciELO
Similares en
SciELO  Similares en Google
 Permalink
Introduction
A road connects a minimum of two places on land. It allows people to travel from one location to another and aids in the transportation of commodities. A road network is a system of interconnected paths that facilitate the movement of vehicles or pedestrians from one location to another (Olawale and Adesina, 2013). The road network through transportation impacts the socioeconomic value of a country (Blackwall, 1906). The road network in a city connects all of the utilities in it. A utility is a service area that provides benefits to people (Li and Lai, 2019). It could be an educational institution, a bank, an ATM, a hotel, a restaurant, a police station, etc. The people in the city use the road network to reach their utilities (Ayo-Odifiri et al. 2017).
According to the literature, the public transport system of the bus network in Ho Chi Minh City was analyzed using topological and temporal analysis, indicating that the latter better addressed the heterogeneity of public transport issues than topological network analysis (Huynh and Barthelemy, 2021). The Analytic Hierarchy Process (AHP) method was used to analyze the transport mode selection in the city of Vienna, for which the students of Vienna University (Economics and Business specialization) were used as the target audience. The collected data were processed to identify preference rates based on subjective factors that fulfill objective ones. The results proved useful for planning the city's transport network (Šinko et al., 2021). General Transit Feed Specification data was used for a comparative analysis of the para-transit transport service network between seven African cities. A network analysis of the nearest para- and public transit was carried out regarding accessibility, frequency, and network coverage. The study also revealed the transport inequality and segregation of urban areas, and it indicated the need to understand the transport differences and dynamics in a developing country (Falchetta et al., 2021). Rapid urbanization in developing nations results in inadvertent and perplexing scenarios where urban works are not controlled by master plans. The road network is directly correlated with population growth, and population density is correlated with road and area density. The results highlighted the insufficiency of current systems, highlighting the need for the proposal of a hybrid transit system (Maity et al., 2021).
In this study, the network analysis tool of ArcGIS is used to determine the serviceability of utilities, perform elevation analysis, and establish the shortest and quickest paths. The traffic survey data used for the analysis of this study were collected from the people living in the study area (i.e., the Patna Urban Agglomeration Area), as well as from daily commuters. The advantage of these data is that they can be used for immediate transport planning and in the near future. Thus, traffic and transport projections will be more reliable than conventional data sources for the study area (Khahro et al., 2019).
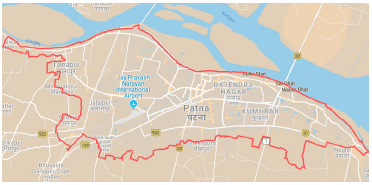
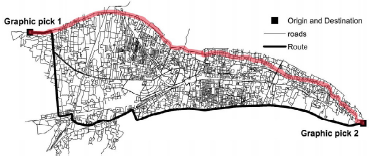
Source: Authors, base image from Google maps
Figure 1 Study area: Patna Urban Agglomeration Area, Bihar, India
The study area corresponds to the Patna Urban Agglomeration Area (PUAA), which comprises the Patna Municipality Corporation (PMC), Danapur, Khagaul, and Phulwari Sharif. Patna is one of the most populated cities in the Indian state of Bihar. Most of the uncontrolled and unplanned urban development takes place in the PUAA, which also direly needs road network and utility analysis. This study area is shown in Figure 1, with a red boundary line. The state of Bihar is lagging behind other states in India with regard to urban planning. The capital city of Patna is facing intense uncontrolled and unplanned urban growth, where the master plan of the city has no effect. The urbanization rate increased from 9,59% in 1981 to 11,29% in 2011. This, in comparison with 22,89 and 31,16% for the entire nation during the same years. Urbanization has had a delayed effect in the state of Bihar. The developments are out of schedule, according to the Patna master plan. Urban transport is negligible in the state and serves only up to 22% of the population. Patna has the lowest public transport accessibility index among the 30 traffic survey cities. About 11% of the population lives in slums, where roads, sanitation facilities, and infrastructure such as the electricity and water supply are poor or even absent. There are 259 places that are recorded as slums, and there are several places that remain unrecorded. Rural poverty has declined, and urban poverty has increased due to the migration of the population towards urban centers. The lag of urban planning further deteriorated the urban settlements' infrastructure (Pandey 2021).
The state of Bihar failed to develop after India's independence from the British in 1947. The causes for this are multitudes of issues. A few noteworthy issues are political instability because of the coalition government and schismatic politics relying on ethnic, caste, and class divisions (Rasul and Sharma, 2014). The majority of the people migrating to Patna come from agrarian societies with low literacy rates. These people serve as the service industry labor force and are classified as low-income groups. Blue-collar workers such as share autorickshaw drivers, bike taxi drivers, delivery boys for couriers, online sellers, plumbers, electricians, air conditioner mechanics, and carpenters are included in this low-income group.
In light of the above, road network analysis will aid in the development of the low-income group and, indirectly, in the country's economic development. The inducing factors for migration into the study area are the need for education, exam coaching, and medical facilities, as well as a lack of jobs in other districts of Bihar. There is a population outburst in the study area because of this. The infrastructure (i.e., roads, water supply, electricity, and sewage networks) has become meagre to support the growing population, which directly impacts the traffic conditions of the study area (Papageorgiou et al., 2003). The roads are becoming narrower every day because of the many roadside shops. The roads are clogged with vehicles during peak hours (Al-Mamun and Paul, 2018), and the number of traffic miscreants is perpetually increasing. The increasing number of auto rickshaws and e-rickshaws adds ardent to the traffic turmoil. The vigilant traffic police officers scuffle to maintain traffic discipline. Therefore, in this study, an analysis of the study area is carried out. The major problems of said area are identified, and amicable solutions to these problems are provided. All roads in the study area, as well as crucial utilities, are taken into consideration. As a contribution, people will be able to make more informed decisions if they are aware of the locations of critical utilities (Emerink et al., 1995). These decisions will enable people to reach their destination on time (Boyce, 1988), thus spending less time and money on visiting their destinations (Kumar et al., 2005). This road network analysis will allow low-income group workers to select the optimal path to carry out their services to society, and it will aid in the socioeconomic development of the study area. Google Maps was used to collect data for the study area's road network and utilities, which was then cross-checked with real-world entities. The data were processed in the Network Analyst tool of the ArcGIS software.
Methodology
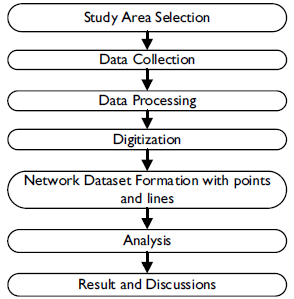
The study area was selected based on the existing traffic issues. The data for the study area were collected and processed through digitization. The adopted methodology is presented in this section and depicted in Figure 2. The digitized lines and points were used to create a road network dataset. This dataset was used to determine the shortest and quickest paths, to conduct an elevation analysis, and to assess the serviceability of utilities.
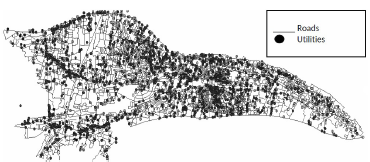
Road network preparation: Road network and utility maps were created using Google maps. The roads were digitized as lines on Google maps (the roads were absent in a few locations). These locations were circumspectly analyzed for ground truth verification (Hai et al., 1993). The digitized road network and utilities are shown in Figure 3. Routine and crucial utilities such as educational institutions, government offices, hospitals, banks, ATMs, petrol pumps, market areas, police stations, hotels, and restaurants were digitized as points.
A new map was created for the study area, which included roads and utility points. The digitized data were in the KML format. The KML file was converted into a layer format file in ArcGIS. The data processing procedure is presented below.
Network dataset: Network datasets are fundamental need for modelling transport network analysis. The network datasets are formed using features like points, lines and turns. The turns are entities that store turning restrictions in a network junctions. The network analysis will be executed in the network dataset in ArcGIS. The network datasets manages the network analysis by abiding the network rules such as one-way, overpasses or tunnels, turns and restrictions. The relationship between the intersections, junctions, nodes, point and lines in a network are stored as network policies. Through the network policies the network analysis in a network dataset can be executed. Therefore, the road network, utilities, turns, intersections, junctions, overpasses and tunnels or underpasses details in the study area are created in the network dataset and used for road network analysis. This step is explained in the Figure 2.
Road network data processing: All analyses were carried out using the network dataset. A new database was created with lines and points that were converted via ArcGIS, where a new network dataset was created. The modifications considered while building the dataset are presented below:
1) All roads were given names based on their geographical location. These roads were classified into three categories based on the importance of the roads: primary roads, secondary roads, and tertiary roads. All national highways (NH), state highways (SH), and major roads were added to the primary road category. Other district roads and important roads were considered secondary, and the remaining streets and lanes were classified as tertiary roads.
2) The roads were assigned a specific speed limit based on their classification. These speed limits were tested during the traffic survey. The drive time was calculated for each road between one junction and another. The speed factor (i.e., the relative speed of a vehicle when compared to its actual observed speed) was calculated based on the observations made during traffic surveys. The actual observed speed is the free flow speed, and it must not exceed the predefined speed limit of the roads. This factor was crucial in identifying vehicle speed with respect to time; as the time of day varies, so does the traffic speed with respect to traffic volume (Falcocchio et al., 2015). Figure 4 shows a graph of the time of day vs. the speed factor.
3) In the study area, one-way and two-way roads were digitized and processed for road network analysis.
4) Turn features were added to the city's major intersections. This facilitates the movement of traffic with a cost impedance (i.e., time). When a person is willing to travel across a major junction, the impedance of time will be applied to the person's travel time. Travelling via junctions will cost comparatively more time than other routes. This intersection optimization was discussed by Zhang (2019).
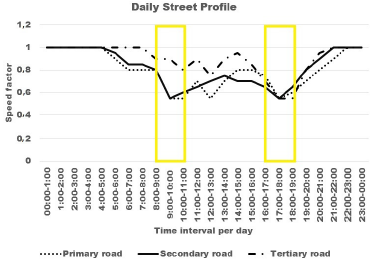
Figure 4 shows how the low-speed factor changes with respect to the time of day. In this Figure, the y-axis represents the speed factor, and the x-axis represents 1 h intervals of the day. The primary, secondary, and tertiary roads are plotted in this graph. The traffic survey data were collected through cameras fitted at the road junctions and traffic signals. The data for secondary and tertiary roads were collected through field surveys at peak hours. The traffic peak hours in the morning of the study area were 8:00 am to 11:00 am and 4:00 pm to 7:00 pm. The peak hour time slots are highlighted in yellow in Figure 4. This time is suitable to collect traffic because the traffic volume remains challenging for traffic management. Peak hour traffic tends to increase in a developing nation with respect to its development and population migration (Droj et al., 2021).
5) There are overpasses and underpasses in the study area. The road network is created in such a way that the overpasses and underpasses connect to the road network at the proper elevation. To restrict movement from two different elevations, overpass and underpass data were processed to represent elevation differences.
6) Two tables were created, namely daily profile and street_daily_profile. The first table shows the drive time for all roads with an hourly value, and the second table presents the traffic profile for different days of the week. The street_daily_profile was used as a historical traffic database for carrying out road network analysis. Profiling took place for seven days a week, with profiles 1 and 7 representing the weekend. The aforesaid data and tables were used in the creation of a road network dataset, which is described below.
Road network and utility analysis
All analyses, which focused on the paths and serviceability of utilities, were carried out using an extension called Network Analyst in ArcGIS.
Path and elevation analysis
The path analysis aimed to determine the shortest and quickest paths, providing the travel directions, distance, and time (Weiping and Chi, 1999). The study area has traffic profiles for weekdays and weekends, which may change according to the time of day. Traffic profiles, associated with the speed factor, influence the travel time. If the time of day for travelling changes, the quickest path is also subject to change, but the shortest path remains the same for all traffic profiles. Note that this shortest path may be suitable for pedestrian travel. The quickest path tool finds a route based on travel time, which is calculated from the point of origin to the destination based on the traffic profiles (Zhang and Yi, 2012). Therefore, the quickest distance is not always the shortest distance. Figure 5 shows the routes calculated for the shortest (red) and the quickest path (black). Note that the latter must follow the overpass and underpass elevations of the road network. The overpasses in the study area are the flyovers that go over the road networks and railway lines. There are underpasses in the study area that go below the flyovers, where height restrictions are also imposed. The effectiveness of route guidance is briefly described by Bonsall (1992).
The variations in elevation for overpasses and the height restrictions in underpasses were marked and analyzed using the aforementioned extension of ArcGIS, and the performance of the road network dataset was analyzed regarding the serviceability areas of the utilities in the study area.
Serviceability of the study area
The serviceable area is the area that can be serviced by a utility within a specific time or distance. The total area of Patna is 136 km2, which comprises the municipal area (around 99 km2) and the suburban area (36 km2). Most utilities are situated in the urban area, which implies more access for the inhabitants of urban areas. Consequently, people in suburban areas must travel a greater distance to access utilities (Talpur et al., 2014).
The aforementioned serviceability analysis was carried out to show the accessibility efficiency of utilities to people in the study area. In the elaborated maps, the outputs showing points are utilities, and lines represent roads. The light grey color hatchings represent areas that can be reached in less time, and dark grey shows areas that require comparatively more time. Figure 6 shows the results of the bus stop serviceability analysis of the study area regarding the pedestrian travel mode. In this Figure, points show the geographical location of bus stops, and the lines show roads. Grey hatchings show areas within 10 minutes of walking time, and grey shade hatchings show areas within 15 minutes. From the results, it is clear that the city's bus stop distribution is not even, and it lacks connectivity through public transport services. Therefore, people use shared e-rickshaws, autorickshaws, and rickshaws for transportation, thereby increasing the traffic load on the road network. The low-income group uses public transportation more than the high- and middle-income groups combined. Market places are important for low-income people's daily work (AlKheder et al., 2022). The marketplace is not evenly distributed across the study area either; there are places without markets to promote economic activity (Talpur et al., 2016). Figure 7 shows the results obtained through the market-place pedestrian serviceability analysis.
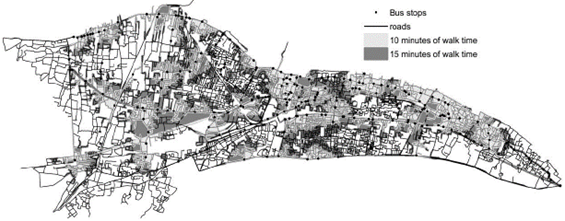
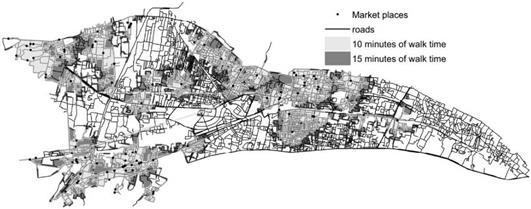
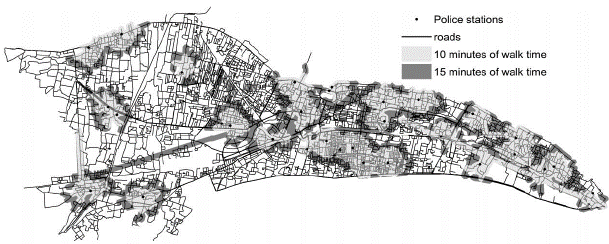
Figure 8 shows the results of the police station pedestrian serviceability analysis. People in the low-income group are more vulnerable to crimes, which commonly include roadside robbery and petty crimes. Access to police stations for low-income groups is vital because they are active contributors to the developing economy. The results show that there are locations in the study area that lack quick access to these utilities. In light of the above, the police should provide frequent patrolling services in low-access areas, which involves setting up police booths, checkpoints, and virtual patrol webcams. Low-income workers play an essential role in a booming economy, because they spend more money than people in the high- and middle-income groups. The needs of low-income people are not fulfilled, and they will grow from one level of necessity to the next. When these workers have money, they will spend more on consumption. If the need for food is met, low-income people spend their money on clothes, travel, rent, and education. In a developing economy, spending on education is very high compared to any other expense. Therefore, spending by low-income groups will indirectly boost economic growth. This part of the population requires immediate access to utilities because they are major players in the service industry, given that, due to the global pandemic, high-and middle-income groups now prefer to shop online for groceries, medicines, and almost all other purchases. The need for the transport-based service industry is booming, as online selling giants are buying warehouses throughout their business venues.
Results and discussion
In this study, ArcGIS was used to analyze and solve traffic net-work-based transportation problems. The road network and utilities of the study area were digitized in Google Maps. These data were transferred to ArcGIS to create a road network dataset for carrying out road network analysis. This analysis was able to provide various routes based on traffic profiles obtained through a traffic survey of vehicles that travelled through the road network for a week. For the road network analysis, a suitable traffic profile was selected for the study area. Path and elevation analyses were carried out based on these traffic profiles. A serviceability analysis was also conducted to find easily accessible routes of utility that may benefit the low-income groups' economic growth. The study showed that geographical information systems (GIS) is a reliable tool in solving transportation network issues. Network analysis using ArcGIS was able to aid people by recommending the best route for travelling. This route-based knowledge will assist them in saving time and money. Moreover, ArcGIS showed the effective serviceability of different utilities in the study area, identifying zones with poor access to particular utilities. Based on this result, effective future utility planning can be carried out.
Conclusions
Developing nations struggle to cope with new requirements via old infrastructures. Urban road networks are one such example, and it affects the majority of the population. Traffic volume changes and population migration towards urban spaces cannot be limited, but abrupt changes in the traffic volume will be difficult to manage, resulting in accidents and traffic regulation issues. The employment of urban road network analysis using GIS eased the road traffic decisionmaking process. The elevation analysis identified the time-based traffic volume through the over- and underpass locations, which is essential for managing and diverting traffic in times of emergency, e.g., rerouting services during accidents, road damage repair, and following security protocols in the study area. The path analysis provided the shortest and quickest routes, which is essential for emergency services such as ambulances and the time-based product delivery of perishable goods in the study area. The serviceability analysis indicated locations in the study area with poor access to utilities. The locations with poor access to infrastructure are mostly inhabited by low-income groups. Infrastructure planning, the provision of new amenities, increased patrolling, and the distribution of utilities can be easily carried out with the aid of this type of analysis. This study explored the possibilities and optimal solutions that may be implemented in the study area without causing major urban road network infrastructure changes (García-Luna-Aceves et al., 1999). Furthermore, the study provided essential insights into the existing urban road network serviceability of utilities. Feasible suggestions are provided to improve these aspects with regard to low-income living areas. The adapted method proposed in this study provided amicable results for planning and managing urban traffic within the existing road infrastructure. The study of future urban space expansion will aid in the sustainable transport development of the study area.

