


 Inglés (pdf)
 Articulo en XML
 Referencias del artículo
 Enviar articulo por email
 Citado por SciELO
  Citado por Google
  Similares en
SciELO
Similares en
SciELO  Similares en Google
 Permalink
Introduction
Photogrammetry involves scientific methods that calculate an object's 3D coordinates using overlays of two consecutive images (Akcay et al., 2017). It is frequently used in fields such as forestry, agriculture, environment, mining, planning, and medicine. Medical photogrammetry can precisely present an organ's metric and morphometric measurements and location data without making contact with the patient or the organ (Catal Reis, 2018). Medical photogrammetry using medical data can detect anomalies and cancer. Cancer occurs due to various environmental and genetic factors. The most prevalent types amount to over 100 different known cancers, such as skin cancer (Parker, 2020), lung cancer (Plodkowski et al., 2021), prostate cancer (Ghafouri-Fard et al., 2020), melanoma (Esim et al., 2019), stomach cancer (Zilberman et al., 2015), breast cancer (Riis, 2020), bone cancer (Hosseini et al., 2020), etc. Bone tumors are more widespread in adults than in children and youngsters (Reddy et al., 2015). Tumors and tumor-like lesions of the foot and ankle are rare (Toepfer, 2017; Foo and Raby, 2005; Bakotic and Huvos, 2001). Foot tumors have about a 3% ratio among all skeletal tumors (Yan et al., 2018). Benign bone tumors are more common than malignant primary bone tumors in the foot (Ozer et al., 2017). However, benign bone tumors are generally asymptomatic and go unexplored (Ladd and Roth, 2017). A tumor is the abnormal development of new cells that may occur in any of the body parts (Mistry et al., 2016).
The most often faced primary benign bone tumor of the foot is the unicameral bone cyst (UBC), found in second osteochondroma and osteoid osteoma. Calcaneus tumors are especially rare; 32% of them are benign, and 35% of osseus tumor types occur in the foot (Young et al., 2013). Calcaneus tumors are the second most common condition involving the foot after meta-tarsals (Kilgore and Parrish, 2005). However, accurately and reliably describing and quantifying foot tumors is a challenging task for orthopedic surgeons and orthopedists. Bone anomalies in the foot and ankle are complex structures and, therefore, difficult to quantify by standard radiographic measurements. The literature is limited to calcaneus lesions. In particular, studies of calcaneus tumors consist of case reports describing a single primary tumor of the calcaneus (Yan et al., 2018). The first significant cases related to calcaneus tumors and tumor-like conditions were described in 1973 by Campbell and Leupold. These authors presented a case of a rare elastofibroma (soft tissue tumor) in the calcaneus of a 79-year-old female (Pirak et al., 2020). Another case of a giant cell tumor of the calcaneus with a bone cyst was reported by Kamal et al. (2016). The case of a 21-year-old male patient with osteosarcoma of the calcaneus was presented by Diémé et al. (2015). Past and present research has focused on classifying tumor types, growth directions, and areas, as well as on determining locations (Costelloe and Madewell, 2013). Foo and Raby (2005) presented the spectrum of tumors and tumor-like lesions of the foot and ankle which are not considered standard. Since calcaneal tumor types are rare, delays in diagnosis, incorrect diagnosis, and unnecessary amputations can be observed (Young et al., 2013).
Several diagnosis methods have been proposed for tumor detection. However, radiological images are the gold standard and primary step for tumor evaluation (Ladd and Roth, 2017; Bestic et al., 2020). Magnetic Resonance Imaging (MRI) and Computed Tomography (CT) are commonly used for diagnosis (Hasbek et al., 2013; Gemescu et al., 2019; Scotto di Carlo et al., 2020). High spatial-resolution CT supplies sensitive bone details, thus making it a vital tool in various cases and with specific tumors (Ladd et al., 2017; Mehta et al., 2017). CT scans are better at evaluating bone tumors for destruction or breakthrough than MR imaging (Hapani et al., 2014). When a tumor metastasizes to the bone, severe pain and deterioration occur on it, considerably reducing the possibility of a treatment (Weilbaecher et al., 2011). A significant limitation for studying what regulates tumors in the bone is the lack of non-contact models for tumor reconstruction, as well as the limited ability to detect low tumor levels in the bone. In addition, low-resolution and noisy images may prevent the tumor from being easily detected and are time-consuming. There needs to be more tools in addition to these imaging and diagnosis systems in order to obtain accurate and reliable results. A second opinion is essential to meet the requirements of imaging systems and mitigate the possible failures of technicians and physicians. Therefore, photogrammetry and medical image processing are the best techniques for using non-standard CT images, as they produce highly accurate results. Image processing technology converts data into different formats, and it is useful for measuring and evaluating (Aydin and Kurnaz, 2023). Therefore, Computer-Aided Diagnostics (CAD) has been proposed for diagnosis and treatment (Lodwick et al., 1963). Today, techniques for 3D bone measurement have become available (Qiang et al., 2014), which allow for surface, distance, location, and angular measurements on models generated from CT or MRI images (Gutekunst et al., 2013; Eckstein et al., 2006).
Many CAD methods have already been employed, including 2D and 3D approaches for tumor measurement (Nishikawa, 2005). However, little data are currently available in the literature with regard to measuring the 3D morphological parameters of the calcaneus (Qiang et al., 2014).
This study aims to evaluate the feasibility of medical photogrammetry for the detection of bone tumors, with the purpose of automatically detecting calcaneus tumors in noisy, non-standard CT images, as well as visualizing them in 3D and evaluating their metric information. CT images were used in this study, and the tumor segmentation and 3D model were created using software. This research provides an overview of the evidence for using CAD with calcaneus tumors. This highly sensitive method to detect bone tumors is ultimately summarized regarding its applicability to each foot tumor model. Medical image processing to detect foot tumors in CT can assist radiologists by increasing their accuracy. The proposed techniques to detect small and significant changes in tumors and tumor-like lesions, combined with these novel models, will be instrumental in studying tumors in the bone (benign or metastatic), as well as their stages.
Our study comprises three sections. The next section characterizes the calcaneus and explains the dataset. Then, general information is presented regarding medical image processing (pre-processing, segmentation, 3D modeling, obtaining biometric information, and statistical analysis). Afterwards, the results are presented and discussed while making a set of recommendations. The final section deals with the conclusions of this work.
Materials and methods
In medical imaging, conversion from 2D to 3D or vice versa can be done with the help of photogrammetric techniques. The length, area, volume, and geometric information can be accessed by processing these data. In addition, contactless information and metric data can be obtained through metric measurements (Dogan and Yakar, 2018). This study focuses on tumor detection in the calcaneus bone via the medical photogrammetric approach.
The calcaneus bone is the largest tarsal bone and is irregularly shaped, with complex edges and articular surfaces (Qiang et al., 2014). It is a large bone that forms the base of the back of the foot. The calcaneus 'cuboid' connects bones and the talus. The bond between the talus and the calcaneus forms sub-articular joints. This joint is essential for normal foot function (Epstein et al., 2012; Basile et al., 2012).
As for this study, from 2011 to 2014, 20 cases (left and right foot scans) were taken from the server (retrospective study/stock footage research), for a total of 1 039 CT scans. The foot and ankle CT images of 10 cases (male group age: 20,2±9,8; female group age: 47±31) were included given the presence of calcaneal bone tumors and tumor-like-lesions. The imaging procedures were carried out according to the Helsinki Declaration (Goodyear et al., 2007). This study did not require ethical approval or informed consent by national legislation.
CT images were taken from an open-access public hospital database. The medical photogrammetry and digital medical image format used was DICOM (Digital Imaging and Communications in Medicine). Most commercial software applications support the .dcm format, which facilitates reading raw data and sharing them. Therefore, DICOM has become a standard format for medical imaging. The parameters employed were a detector collimation of 64, a scanning thickness of 0,5-3 mm, and pixel sizes of 512 x 512, with a radiometric resolution of 16-bit gray levels (Table 1). Package software was used (Able Software Corp., USA) for 3D modelling and biometric data, as well as MATLAB for pre-processing and statistical analysis. All this, on a computer with an Intel Core i7-2670QM duo processor @2.20 GHz and 6 GB RAM. The axial images (.dcm) were first transferred into a personal computer with the 3D modeling software used in this study. Calibration was performed automatically.
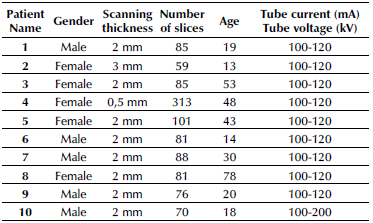
Figure 1 shows a diagram of the proposed architecture, which consists of seven different processes.
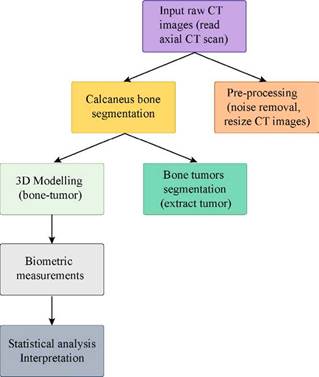
This study followed these steps: (1) image pre-processing, (2) calcaneus segmentation, (3) tumor segmentation, (4) 3D modeling - visualization, and (5) biometric calculation.
These five steps make up the primary process, in comparison with the seven steps of the physician report.
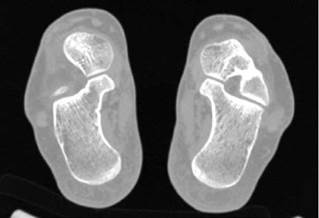
Our study involved the processing of bone CT images, so as to identify the region of bone cancer and perform a 3D evaluation. Axial raw CT images containing healthy and bone tumors are presented in Figures 2 and 3.
The calcaneus CT images employed were noisy images of various sizes. Image pre-processing can improve the accuracy of a 3D model. To this effect, data selection and classification (tumor or non-tumor) were performed, followed by a resizing of the CT images, which were discarded if there was still noise. The most important goal here was to sort out images of different diseases. Another critical point was using noise removal techniques to enhance the images (the noise outside the main calcaneus bone was removed). Therefore, the images were pre-processed.
In a classification process, the pixels of an image are segmented based on determining features. Segmentation methods and their success rates can vary according to their aim, applied field, and the quality of the image used. In general, segmentation algorithms are dependent on discontinuity and the similarity of grey levels (González and Woods, 2007).
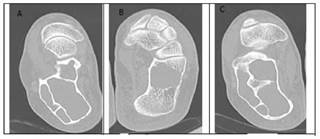
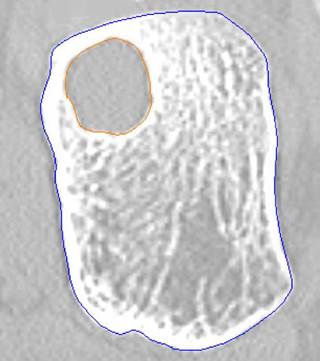
A region-growing algorithm was applied to find the Region of Interest (ROI) of foot bone tumors. This method searches for similarities in the grey levels of an image for segmentation (Figure 4). It is important for the sets created here to be homogeneous, which does not depend on the training process. Although different region-growing algorithm approaches have been developed and proposed, the main general steps of the method can be ordered as thresholding, growing, and split-merge (González and Woods, 2007). This method grows from seeds to adjacent points via thresholding techniques.
Data were collected from the Hounsfield Units of the images to establish a suitable threshold value for the region membership criterion. Tumor segmentation and 3D tumor models were created via commercial software.
Afterwards, a 3D model was created from the segmented images. The performance of this model was evaluated in terms of its accuracy in the segmentation of the calcaneus CT images. Using the region-growing algorithm to extract the correct edge contour increased the performance of the study. Then, biometrical calculations were performed. The steps for image processing consisted of noise reduction, resizing, segmentation, 3D modeling, and morphological analysis.
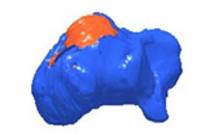
To summarize this study's workflow, the CT image was read, pre-processed, segmented and edited; a 3D model was generated; and biometric measurements were performed. The tumor location is illustrated in Figure 5.
Source: Authors
Figure 5 3D morphological measurements of the calcaneus and the location of tumors in it (orange denotes a tumor, and blue is the calcaneus body)
Statistical analysis
The morphological parameters of the 3D measurements were evaluated using statistical analysis. The performance of the study was evaluated with receiver operating characteristic (ROC) analysis. The parameters are the following: true positive (TP), false negative (FN), true negative (TN), and false positive (FP) (Nahm, 2022). The area under the ROC curve (AUC= 0,5) (Nurtanio et al., 2013) can be used as a criterion.
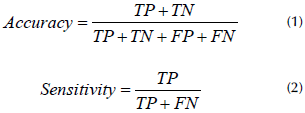
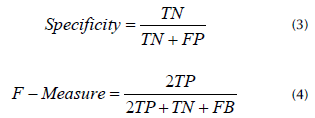
where TP is the number of true positives, TN is the number of true negatives, FP is the number of false positives, and FN is the number of false negatives.
Results and discussion
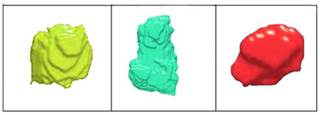
The bone tumors were extracted, and other bones were removed. The calcaneal tumors' morphological parameters were shown in 3D (Figure 6).
This study focused on automatic calcaneus tumor detection and diagnosis using CT. The results of radiologist reports were compared to those of CAD (Table 2).
Table 2 Comparison between morphological measurements and medical reports of 3D calcaneal tumors
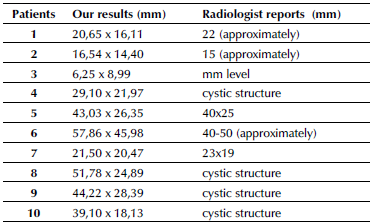
Source: Authors
Our method provides precise results, while medical reports provide approximate statements. The experimental results of the diagnostic performance metrics of the 3D process were evaluated with ROC. A threshold value of 0,5 was selected in the AUC plot. An ROC score of 80% and above is a good result. This study proposes an automatic segmentation method for automatic calcaneus tumor segmentation on CT images. Regarding the segmentation process, the average sensitivity, specificity, accuracy, and F-measure were 0,96%, 1,00%, 0,98, and 0,99%, respectively. The 3D method is computationally more complex than the 2D one, although interactive segmentation is highly accurate.
The standard radiological approach may be insufficient due to the irregular shapes of the anomalies that occur in the foot and ankle. Calcaneus tumors are rare (Young et al., 2013) and the second most common tumor site in the foot (Kilgore and Parrish, 2005). Benign bone tumors are generally asymptomatic and go unexplored (Ladd and Roth, 2017). The lack of literature on calcaneal tumors is another compelling factor. Therefore, studies on detection are still insufficient, which constitutes a research gap. Defining and measuring the anomaly in a safe, metric, and reproducible manner can also be challenging for orthopedists (a radiological report is presented in Table 2). It is important to produce fast and reliable results.
This is an efficient technique to determine multiple anomalies in the slices. Benign bone lesions were more common than malignant ones. However, several limitations were noted in this study. Firstly, standardizing CT data could not be generated because they were obtained from a database. It is known that obtaining data under the same conditions and with similar characteristics increases the accuracy and reliability of a study. At the same time, the larger the number of datasets, the more accurate the generalization will be. Secondly, since more patients were needed, no distinction could be made between men and women. However, within the framework of this research, this distinction was observed on the last foot bones because images of healthy individuals were evaluated (Catal Reis, 2010). Thus, the error caused by the amount of data was kept to a minimum. However, computer-aided digital image processing applications have been employed in different fields. This method has some advantages, as it is time-saving, accurate, and economical (Tasdemir and Ozkan, 2018).
Conclusions
The study used image processing, segmentation, clustering techniques, and modeling to detect foot bone tumors from CT images. All this, upon the basis of photogrammetry. This work examined the feasibility of computer-aided diagnosis for detecting foot bone tumors and tumor-like lesions in CT images and from 3D tumor models. The other contribution of this study was the design of an automatic method for 3D morphological measurements of bone tumors based on CT processing techniques. CAD for detecting calcaneus tumors of the foot can aid radiologists given its increased accuracy, sensitivity, specificity, and F-measure. Pre-processing applications can also increase the accuracy of 3D models.
The 3D reconstruction measurements based on image processing techniques were highly reliable and repeatable with regard to the anatomic and morphological measurement of the calcaneus. However, the limitations of our study include its small sample data size, different slice thicknesses, and its retrospective design. Nevertheless, this technique will help to determine calcaneal tumors and tumor-like lesions. 3D foot bone cancer models can be developed using the approaches and future directions needed to advance these relatively new fields of research. Medical photogrammetry will continue to contribute to the literature as a second eye today and in the future. As future work, we aim to add machine and deep learning algorithms to our work and test them with different approaches.

