


 Inglés (pdf)
 Articulo en XML
 Referencias del artículo
 Enviar articulo por email
 Citado por SciELO
  Citado por Google
  Similares en
SciELO
Similares en
SciELO  Similares en Google
 Permalink
Introduction
Cardiovascular diseases are one of the most important etiologies for mortality and morbidity around the world1,2. Prevention, rapid diagnosis and timely treatment, can play an important role in lowering adverse outcomes of cardiovascular diseases. Different methods are applied for diagnosis and treatment of diseases3. Cardiovascular diseases such as ischemic heart diseases, congenital heart diseases, valvular heart diseases and heart failure can lead to decreased left ventricular contractility and thus impaired cardiac function4.
Ejection fraction is the most important indicator for systolic heart function and is a useful parameter for diagnosis and treatment in different clinical conditions. Ejection fraction (EF), end systolic volume (ESV), end diastolic volume (EDV) and stroke volume (SV) are main diagnostic and prognostic factors for ischemic heart disease and left ventricular failure5,6.
Left ventricular function and volumes are reported to be a strong predicting factor in several studies. Patients with coronary artery disease and impaired left ventricular function are prone to sudden cardiac death, thus accurate evaluation of left ventricular function and volumes is really critical in many cases. Echocardiography, cardiac magnetic resonance angiography (MRA), cardiac computed tomography angiography (CTA) and radio nucleotide methods are among principal non-invasive diagnostic modalities to assess left ventricular systolic function4.
Cardiac CTA is a novel and exclusively diagnostic method (without possibility of treatment intervention) for studying coronary arteries without need for commonly used invasive arterial catheterization method. In CTA, using X ray and CT scan technique with multi slice technology and contrast injection, blood flow pattern can be assessed in coronary arteries. Images obtained by X ray are rebuilt using professional computer software and further restored in 3D images of area of interest. This method takes only some minutes of time and provides very useful information about anatomy, interior structures of heart, congenital anomalies and heart vessels7-9.
Nowadays cardiac MRA is recognized as standard method for evaluating cardiac function. Radio nucleotide methods are also among routine modalities to assess perfusion and functional condition of heart6. Fluorodeoxyglucose-positron emission tomography (FDG-PET) is also broadly used to study injured or viable cardiac tissues during ischemia7. In a lot of studies1,3,6-8 the researchers have compared different imaging modalities and controversial results are reported. In some studies, cardiac output is reported to be more in cardiac CTA and in some other studies it is reported to be more in cardiac MRA10,11.
Considering increasing popularity of cardiac CTA and also controversial results of already performed studies, we decided to carry out a fruitful study in this field. To our knowledge, there are several high quality studies carried out in this field and it seems that for a final conclusion, designing a primary study with a limited study population and performance difficulties cannot be helpful. Based on this, in present study we aimed to compare the results of cardiac CTA with cardiac MRA as the gold standard method in a systematic review and meta-analysis manner.
Method
Data sources
Present paper is a systematic review, meta-analysis study to investigate different outcomes of cardiac CTA and cardiac MRA as gold standard method.
In this study we performed a comprehensive search in different PubMed, Web of Science, Scopus and Ovid databases and Science direct, Elsevier and ProQuest online journal publishers. All studies published in English up to 30 December, 2019 were included.
The PICO approach to our clinical question was as P: patients with susceptible coronary artery disease, I: coronary CT angiography, C: magnetic resonance angiography, O: stroke volume, ejection fraction, end systolic volume and end diastolic volume. We used various combinations of keywords associated with each section of our PICO in our search strategy. Search strategy was adjusted based on each database specifications to acquire best results. The whole study was designed and done based on PRISMA guidelines.
Study selection and data extraction
We included all studies reporting our required variables. We even reviewed bibliography of included studies for the most accurate results.
All included studies underwent eligibility assessment by authors using a comprehensive critical appraisal checklist.
Duplicates, case reports, editorial letters and reviews were excluded. Extracted data were as: publication year, study population, gender distribution, age, end systolic volume (ESV), end diastolic volume (EDV), ejection fraction (EF) and stroke volume (SV).
Statistical analysis
Statistical analysis was performed via STATA 11 software using Metan and Metabias commands. To evaluate heterogeneity, DerSimonian-Laird method was used and in case of non-significant heterogeneity (p<0.1), fixed effect model was used.
In this study, the effect size was Cohens d standardized mean difference and was calculated using fixed effect model and inverse variance method.
Beggs funnel plot was used for visual estimation of publication bias and Beggs and Eggers tests were used to test statistical significance. Final results are reported in form of forest and funnel plots.
Results
Characteristics of included studies
After primary search over mentioned databases, 90 articles were found. At first, duplicates (12 articles) were removed and articles were screened by their abstract and topic; then 62 articles entered full text assessment. By reviewing full texts, 2 articles were excluded because of not reporting required information and 6 studies were excluded because they were not published in English.
Studies performed on animal models, case reports and review articles were also excluded and 1 study was added after checking bibliography of review articles. Finally, a number of 19 studies which were reporting data of 583 patients were selected for data extraction and data synthesis. Figure 1 is the diagram that shows the summary of our search strategy. In table 1, general information about all included studies are reported and table 2 summarizes our different outcomes of interest in all included studies.
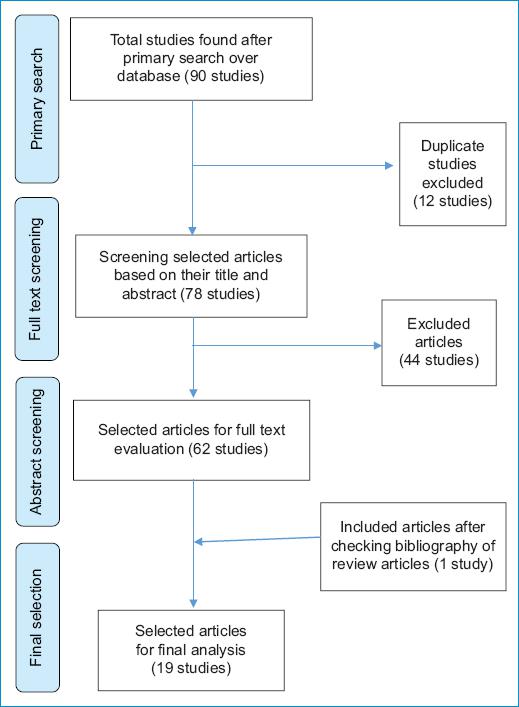
Table 1 Brief information of all included studies
| First authors name | Publication year | Study population | Male percentage | Mean age ± 1SD |
|---|---|---|---|---|
| Mahnken et al.20 | 2003 | 15 | 86.66% | 57.5 |
| Grude et al.12 | 2003 | 30 | 90% | 57±12 |
| Halliburton et al.21 | 2003 | 15 | 73.33% | 56 |
| Juergens et al.22 | 2004 | 30 | 83.33% | 59.2±7.1 |
| Mahnken et al.23 | 2004 | 21 | 85.71% | 65.5±8.6 |
| Schlosser et al.10 | 2005 | 18 | 83.33% | 57.4±10.2 |
| Yamamuro et al.11 | 2005 | 50 | 56% | 67 |
| Fischbach et al.24 | 2005 | 30 | 63.33% | 63.7±15.1 |
| Heuschmid et al.25 | 2006 | 52 | 78.84% | 63±8.9 |
| Dewey et al.13 | 2006 | 88 | 72.72% | 62±9 |
| Belge et al.26 | 2006 | 40 | 80% | 60±9 |
| Mahnken et al.7 | 2006 | 30 | 86.66% | 59.7±13.1 |
| Schlosser et al.27 | 2007 | 21 | 76.19% | 64.3±6.8 |
| Busch et al.28 | 2007 | 15 | 86.66% | 50.8±19.2 |
| Akram et al.29 | 2009 | 20 | 70% | 57.3±10.5 |
| Sarwar et al.9 | 2009 | 21 | 90.47% | 60±10 |
| Mahnken et al.30 | 2009 | 9 | 88.88% | 55.1±8.9 |
| Arraiza et al.31 | 2012 | 25 | 80% | 62.7±10.4 |
| Fuchs et al.32 | 2012 | 53 | 75.47% | 61±10 |
Table 2 Detailed results of included studies categorized based on our outcomes of interest. Studies are numbered in the same order as previous table
| Study | MRI ESV Mean±SD | CTA ESV Mean±SD | MRI EDV Mean±SD | CTA EDV Mean±SD | MRI EF Mean±SD | CTA EF Mean±SD | MRI SV Mean±SD | CTA SV Mean±SD |
|---|---|---|---|---|---|---|---|---|
| 1 | 50.8±33.9 | 51.1±33.5 | 115.5±42.7 | 115±42.7 | 59.8±13.4 | 59.3±13.1 | 64.6±16.9 | 64.4±17.7 |
| 2 | 48±19 | 65±22 | 133±27 | 147±27 | 65±8 | 56±9 | 85±17 | 82±15 |
| 3 | 218.6±91 | 196.2±75.6 | 297±98.8 | 262±85.6 | 28.3±11.2 | 26.7±8.7 | - | - |
| 4 | 54.9±22.8 | 53.9±21.2 | 142±32.5 | 138.8±31.9 | 62.3±10.1 | 61.6±10.6 | 86.9±21.5 | 84.6±20.9 |
| 5 | 95.3±27.9 | 95±27.1 | 178.3±38.2 | 177.3±37.5 | 46.9±8.9 | 46.9±8.4 | 83±20.2 | 82.4±19.5 |
| 6 | 50.1±33.5 | 58.8±34.2 | 118.7±43.6 | 137.1±45.7 | 59.9±14.4 | 59.2±13.7 | - | - |
| 7 | 80.6±57.8 | 86.2±53.7 | 154±64.3 | 153.5±59.4 | 51.3±16.1 | 46.5±14.4 | - | - |
| 8 | 88.4±22.1 | 90.3±25.8 | 191.2±68.1 | 185.2±65.2 | 51.8±9.2 | 49.6±9.5 | 102.8±53.6 | 94.6±48.1 |
| 9 | 64.4±26.1 | 75±33.7 | 125.5±29.4 | 140.6±40 | 49.8±9.6 | 48±9.3 | 61.1±13.2 | 65.6±15.3 |
| 10 | 46±47.5 | 54.1±45.8 | 109.5±57.8 | 118.8±55 | 63.8±14.3 | 60.8±15.1 | - | - |
| 11 | 70±60 | 67±56 | 137±57 | 134±51 | 56±21 | 55±21 | 70±20 | 67±19 |
| 12 | 91.1±35.3 | 91.4±34.6 | 170.9±42.7 | 171.4±41.8 | 48±10.2 | 47.9±9.9 | 79.8±18.1 | 80±17.8 |
| 13 | 63.8±47.3 | 77.3±46.6 | 144.2±46.7 | 164.2±52.5 | 59.3±15.4 | 55.4±11.8 | 80.3±15.6 | 86.8±18.1 |
| 14 | 57.6±27.3 | 54.9±29.6 | 132.1±40.8 | 135.8±41.9 | 57.9±9 | 61.6±12.4 | 74.5±18.1 | 80.9±20.9 |
| 15 | 42.5±14.6 | 42.5±16.6 | 117.2±24.6 | 121.9±35.7 | 64.4±8 | 65.3±8.7 | 76.2±15.3 | 78.9±24.6 |
| 16 | 51±15 | 51±15 | 115±20 | 118±21 | 55±8 | 57±8 | 63±12 | 66±13 |
| 17 | 101.8±40.1 | 96.5±35.1 | 170.9±46.7 | 164.8±44.7 | 41.9±11.4 | 42.2±11.1 | 69.1±17.7 | 68.3±20.4 |
| 18 | 36.7±18.5 | 37.9±19 | 103.8±25.5 | 102.7±23 | 65.1±10.7 | 63.5±10.8 | 67.1±18.8 | 64.7±15.9 |
| 19 | 74±34 | 66±36 | 162±41 | 164±43 | 56±10 | 61±11 | 88±19 | 98±21 |
Quantitative data synthesis, meta-analysis
Results related to ESV
All 19 studies were reporting ESV. Based on performed meta-analysis (Fig. 2), with standard mean difference of -0.09 (95% CI -0.2, 0.02) it seems that there is no statistically significant difference between CTA and MRA for evaluating ESV. A P value = 0.633 for Cochrane Q test of heterogeneity, indicates a homogenous data for entered studies.
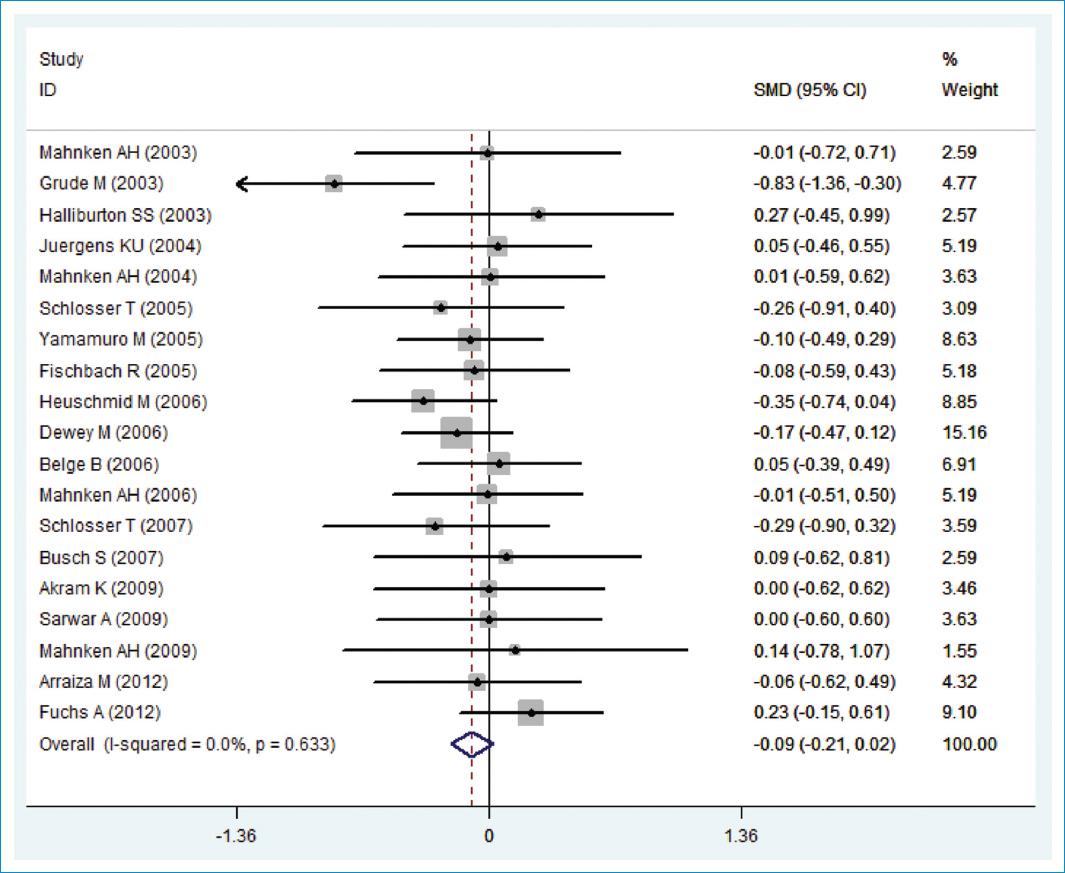
Figure 2 Forest plot of ESV (MRA vs. CTA). Heterogeneity chi-squared=15.42 (df=18), p 0.633 and I²=0.0%.
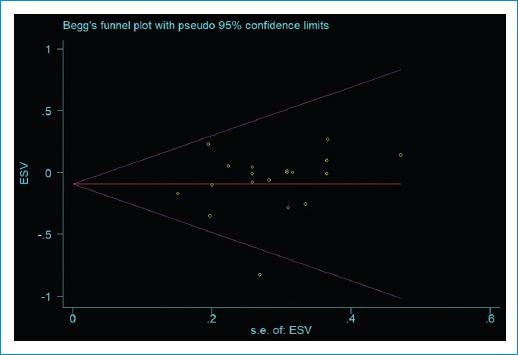
Obtained funnel plot (Fig. 3) is asymmetric and suggests existence of publication bias with a continuity corrected Beggs p 0.401 and Eggers p 0.523.
Results related to EDV
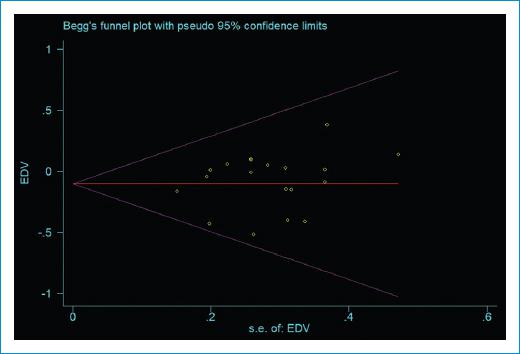
All elected studies presented data about EDV. Considering the forest plot associated with meta-analysis for EDV (Fig. 4), standard mean difference was -0.10 (95% CI -0.22, 0.01) which indicates no statistically significant difference between studied methods for estimating EDV.
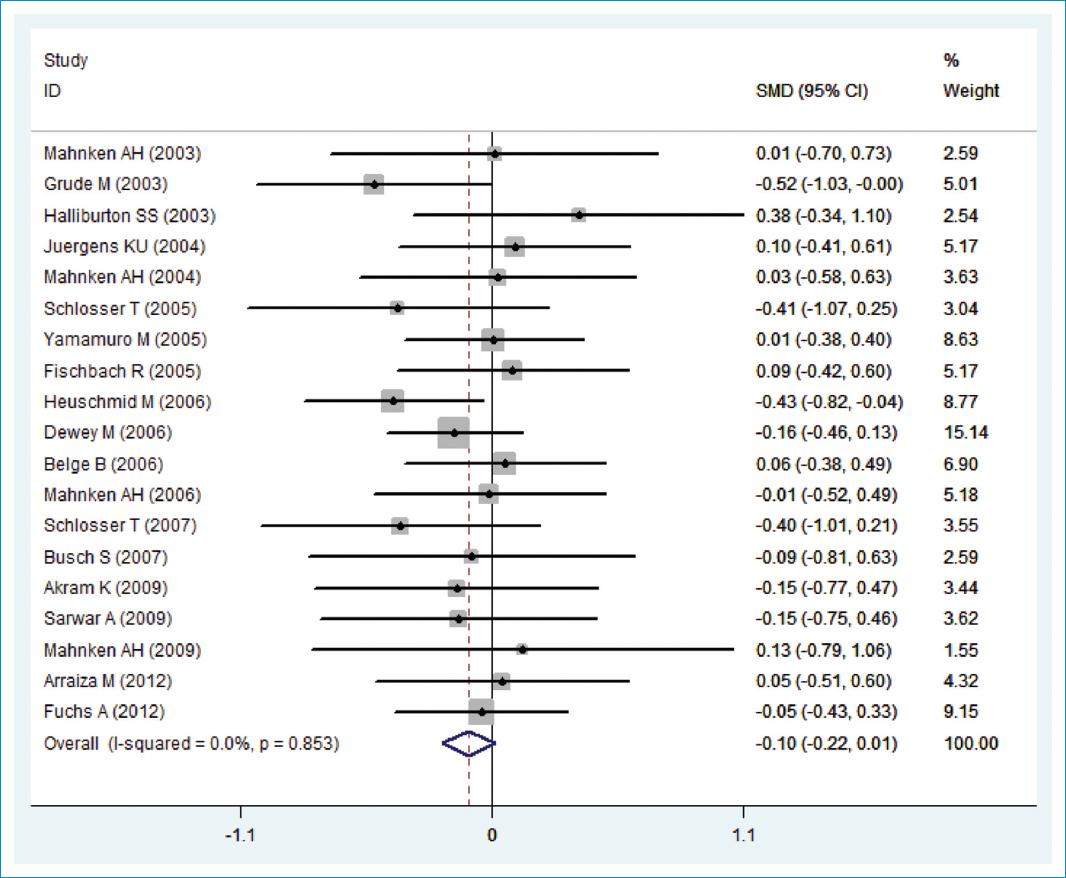
Figure 4 Forest plot of EDV (MRA vs. CTA). Heterogeneity chi-squared=11.89 (df=18), p 0.853 and I²=0.0%.
The studied papers were not significantly heterogeneous (p 0.853) and associated Beggs funnel plot (Fig. 5) is suggestive for a slight publication bias with an Eggers p 0.426 and Beggs p 0.726.
Results related to EF
In all papers, EF was reported. Based on our findings, as seen in associated forest plot (Fig. 6), with standard mean difference of 0.10 (95% CI -0.01, 0.22) there is no statistically significant difference observed between MRA and CTA techniques to assess EF. With a Cochrane Q statistic=26.61 and a p 0.087, homogeneity of included studies was confirmed.
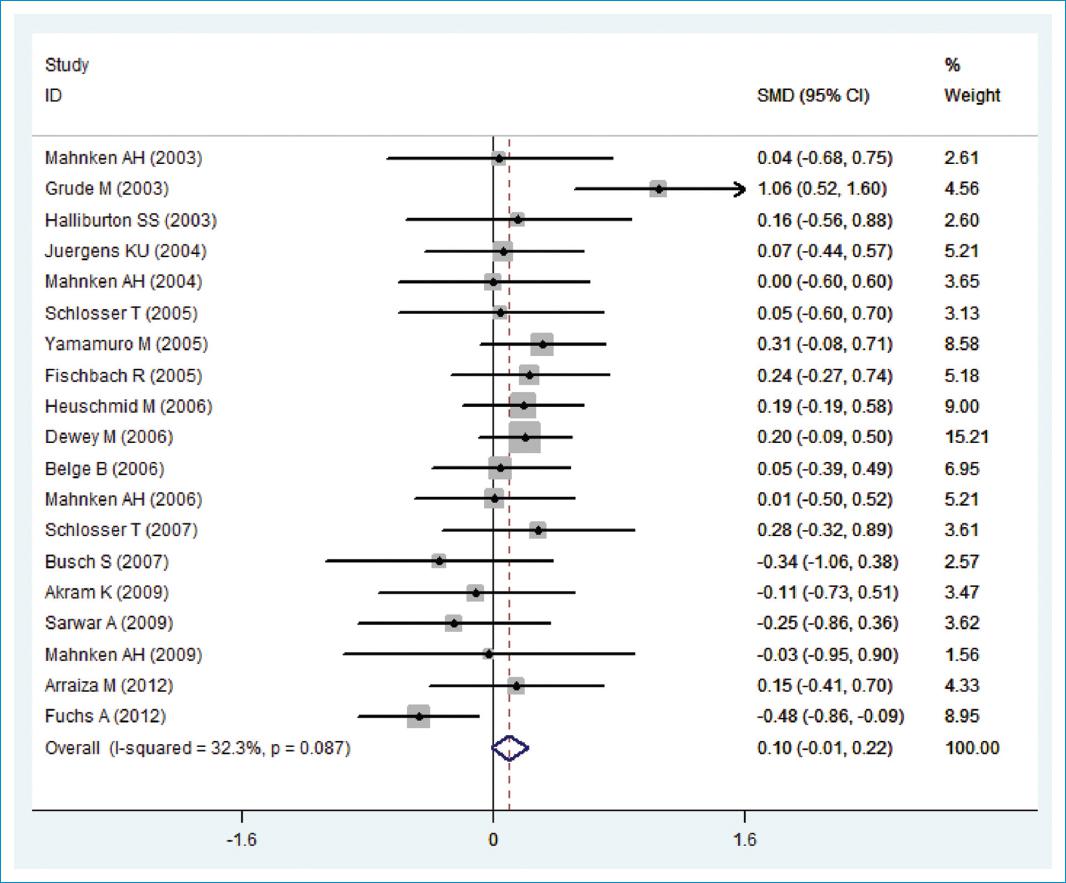
Figure 6 Forest plot of EF (MRA vs. CTA). Heterogeneity chi-squared=26.61 (df=18), p 0.087 and I²=32.3%.
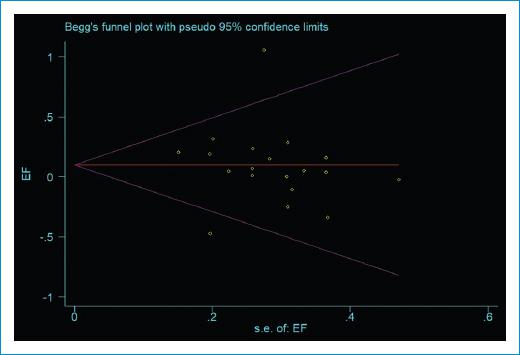
Associated funnel plot (Fig. 7) is symmetric and can be interpreted that no publication bias exists among enrolled studies. A continuity corrected Beggs p 0.208 and an Eggers p 0.728 confirm this hypothesis.
Results related to SV
Stroke volume was only reported in 15 papers. As it can be interpreted in associated forest plot (Fig. 8), with a standardized mean difference of -0.09 (95% CI -0.23, 0.04), there is no significant difference between MRA and CTA for measuring cardiac SV. Cochrane Q statistic=12.08 and associated p 0.600 confirm lack of heterogeneity between included studies.
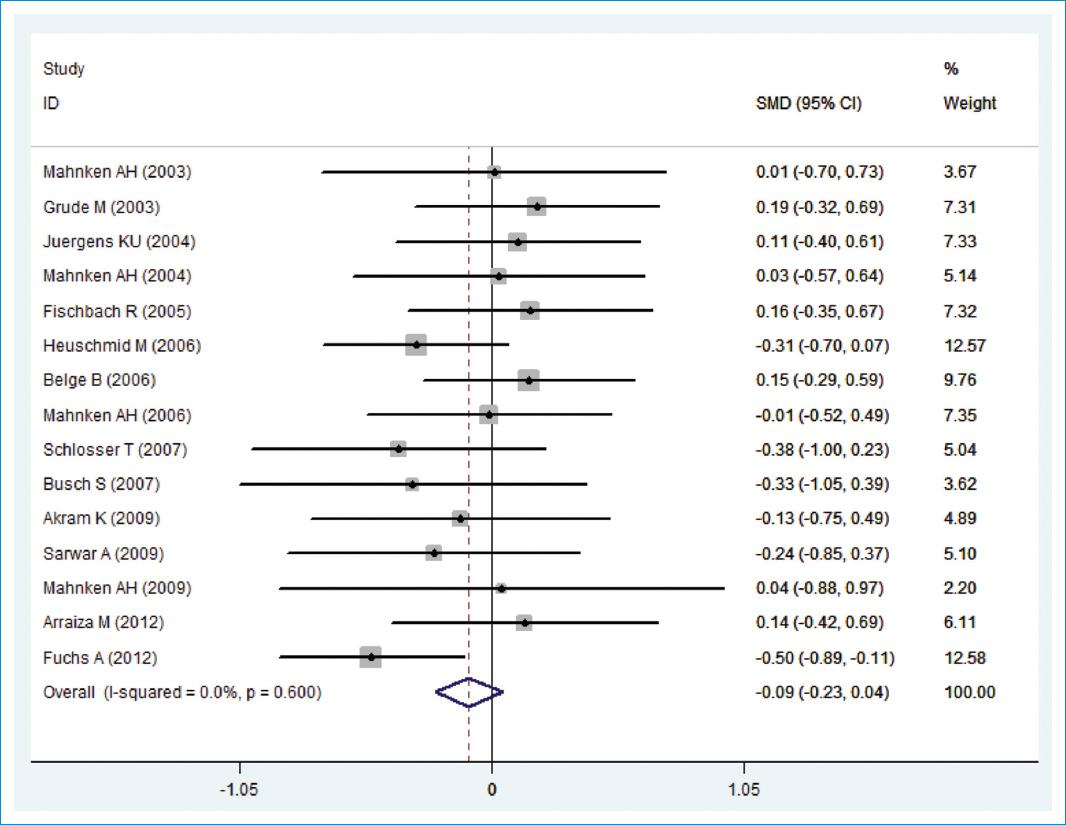
Figure 8 Forest plot of SV (MRA vs. CTA). Heterogeneity chi-squared=12.08 (df=14), p 0.600 and I²=0.0%.
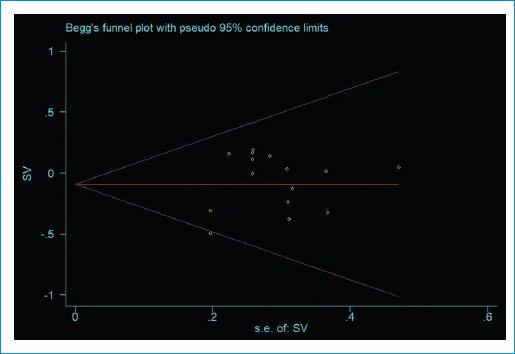
Funnel plot (Fig. 9) is significantly asymmetric and suggests publication bias in enrolled papers. This hypothesis is statistically confirmed with a continuity corrected Beggs p 0.553 and Eggers p 0.378.
Discussion
Results of this systematic review, meta-analysis study indicates that there is a significant association between CTA and MRA when measuring left ventricular volumes. This association is also obvious in included studies. Results of our meta-analysis showed that there is no statistically significant difference in ESV, EDV, EF and SV between CTA and MRA. During reviewing manuscripts full texts different points attracted our attention, thus below points should be highlighted:
All enrolled studies were carried out on patients with high possibility of coronary artery disease or myocardial infarction and no study contained normal people as control group.
Although all studies compared CTA and MRA modalities but there were differences in different studies based on computed tomography (CT) vendor and magnetic resonance imaging (MRI) vendor.
Included studies were not separately analyzed based on 16 or 64 slice CT scan.
Based on our methodological knowledge this is important to be aware of unfavorable direction of differences in included studies which somehow points out to the origin of observed publication bias.
Cardiac MRA is the accepted gold standard modality for estimating ventricular volumes in most studies6,8,12-14 but the limitations of this modality for patients with defibrillator or pace maker makes it hard to use this modality and another noninvasive modality is needed for such cases1,5. It is mentionable that in several studies CTA is reported as an excellent, fast and noninvasive test with high sensitivity and high negative predictive value which provides high resolution images.
CTA has so many advantages but still high radiation dose is mentionable. In similar meta-analysis studies comparing CTA and echocardiography, radiation dose was measured between 8-14 mSv which is a disadvantage along with contrast injection difficulties4,5,14,15.
Based on mentioned limitations of CTA, this modality cannot be considered as routine intervention for evaluating EF but in support of the results of this meta-analysis and other similar meta-analyses5,6 clinicians can rely on CTA results in patients evaluated by CTA for any specified indication.
In none of included studies 320 slice CTA was used and all studies varied between 16 and 64 slice CTA. This fact suggests that decreased number of slices can help reducing radiation dosage. This finding was also pointed out in another meta-analysis comparing CTA and echocardiography which is completely applicable and is in accordance with our results.
In most included studies CTA reported higher volumes compared to MRA and a correlation above 0.7 was observed between findings. In study performed by Kara, et al. in 2016, left ventricular function was compared between CTA, MRA, echocardiography and also two different software. The researchers did not report any statistically significant difference between modalities and Bland-Altman plot and correlation tests revealed a strong association between studied modalities and software. This strong association can be due to applying three dimensional (3D) techniques16.
In a systematic review published in 2014 the researchers evaluated association between cardiac CT scan and MRI5,6 and the results are in accordance with our findings. In mentioned study integrated correlation between CT scan and MRI was reported to be 0.95 for ESV and 0.93 for EDV.
In this systematic review we only compared CTA and MRA in evaluating ventricular volumes but as it is well known, these modalities are widely used in different fields of cardiovascular practice. Starting from pediatric cardiology17 up to tumor diagnosis, in all steps the question still remains in mind of cardiologists; cardiac MR or cardiac CT?18,19
Alongside of this systematic review, we decided to have a rapid and brief search over the literature to compare both cardiac CT and MR. we have summarized our findings about advantages and disadvantages of cardiac CT and MR in table 3.
Table 3 Advantages and disadvantages of cardiac CT and cardiac MRI
| Cardiac CT | Cardiac MR |
|---|---|
| – Contrast preparation and injection with higher radiation dose | – Not applicable for patients with metal prosthesis or pace devices |
| – Best imaging modality for assessment of coronary arteries | – Higher image contrast, temporal resolution |
| – Interference with calcium deposit | – No interference from calcium deposition |
| – Better for evaluating atherosclerotic plaque characteristics | – Better for assessing arterial lumen despite high calcification |
| – Better accepted by patients33 | – Better accepted and applicable for children |
Limitations
Present study is not an exception and contains discovered and covered limitations. In this study, we only reviewed English studies; 3 German studies and one Italian, one Portuguese and one Chinese were excluded. In some studies, b blocker was prescribed before CTA which was not prescribed before MRI, this may affect left ventricular function and volumes and justify some of the differences but is still considered as a limitation for our study. Different imaging techniques in included studies is another limitation of this paper which can cause heterogeneity and also arrhythmias such as fibrillation can influence ventricular volumes which were not mentioned and excluded in all enrolled studies. Sample differences of analyzed studies is another unsolved and potential error.
To solve mentioned limitations, we suggest performing further meta analyses without language limitation and considering possible arrhythmias. Performing multi central prospective studies with a larger study population and applying methods to reduce radiation in patients and similar b blocker prescription in studies is also strongly suggested.
Conclusion
Considering findings of this study it can be concluded that CTA and MRA possess similar accuracy to evaluate ventricular volumes. Considering mentioned limitations for CTA this modality cannot yet be applied as routine modality for assessing cardiac volumes, but in support of this meta-analysis and other similar meta-analyses, results of CTA for cardiac volumes can be clinically applicable in patients who underwent CTA for any specified indication.

