


 English (pdf)
 Article in xml format
 Article references
 Send this article by e-mail
 Cited by SciELO
  Cited by Google
  Similars in
SciELO
Similars in
SciELO  Similars in Google
 Permalink
Introduction
Heart failure (HF) is a clinical syndrome characterized by typical symptoms that may be accompanied by signs caused by a structural and/or functional cardiac abnormality, resulting in a reduced cardiac output and/or elevated intracardiac pressures at rest or during stress1.
HF is a major concern in public health. Its total impact is increased by its high incidence and prevalence and its unfavorable medium-term prognosis. In addition, HF leads to huge health-care resource consumption: it is the first cause of hospitalization in persons aged 65 years or older and represents 3% of all hospital admissions and 2.5% of health-care costs in Spain2.
The application of new information and communication technologies (ICT) for home telemonitoring of patients constitutes an alternative for the provision of health services that improve the quality of life of these patients and reduces the care burden. Remote patient telemonitoring (RPT) allows the evaluation of patients vital signs and provides diagnostic information that can be transmitted to health professionals. It has the potential to involve patients more in their own care, assist the titration of medications, improve compliance, and help providers identify early signs of worsening HF and its precipitating factors3.
It is very hard or even impossible for humans to derive useful information from the massive amounts of data that have been collected and stored in the health-care field. This is where artificial intelligence (AI) comes in, as a way to analyze these data and help diagnosing diseases as it reduces diagnosing time and increases the accuracy and efficiency. It is also very useful in follow-up, prognostic stratification, assessment of relapses, and hospital readmissions.
Machine learning (ML) is a field of computer science that utilizes AI to learn relationships or patterns from the data without the need to define them a priori4. It arises at the intersection of statistics, which seeks to learn relationships from data, and computer science, with its emphasis on efficient computing algorithms. The way that ML algorithms work is that they detect hidden patterns in the input dataset and build models. Then, they can make accurate predictions for new datasets that are entirely new for the algorithms. This way the machine becomes more intelligent through learning; so, it can identify patterns that are very hard or impossible for humans to detect by themselves5.
Taking into account, the availability of a large database and taking advantage of these new analytical methods, we have created a study that aims to detect which parameters measured by RPT best predict HF decompensations and create predictive models to assess the risk of HF decompensations in real time and attempt to reduce, if possible, HF-related hospital admissions.
Method
We performed an observational, retrospective, and non-randomized study with the patients enrolled in our RPT program from May 2014 to February 2018. We collected patients baseline data, telemonitoring data, and patients' HF decompensations (i.e., emergency admissions, hospital admissions, and home care interventions).
Patients transmit, through the devices installed at home, the following parameters daily: systolic blood pressure (SBP), diastolic blood pressure (DBP), heart rate (HR), oxygen saturation (O2sat), and weight. They also send a questionnaire about the state of their health that consists of eight questions (Tables 1-6).
Table 1 Health questionnaire
| Questions | Answers |
|---|---|
| Comparing with the previous 3 days, I feel: | Better/Worse/Same |
| Does my medication feel good? | Yes/no |
| In the last 3 days, have I taken any medication without the supervision of my doctor? | Yes/no |
| Am I following the diet and exercise recommendations given by my doctor and nurse? | Yes/no |
| In the last days, my ankles are: | Better/Worse/Same |
| Can I go for a walk like the days before? | Yes/no |
| Do I have a feeling of shortness of breath when I lie in bed? | Yes/no |
| Do I notice that I have started coughing or having phlegm? | Yes/no |
Table 2 Baseline characteristics of the study population
| Baseline Characteristics | Intervention group |
|---|---|
| Age | 76.34 (11.35) |
| < 65 | 16.87% (40) |
| 65-75 | 19.75% (47) |
| > 75 | 63.38% (153) |
| Sex | 60.8% men (146) |
| Height | 161.93 (9.88) |
| Weight | 72.44 (15.93) |
| Body mass index (BMI) | 27.63 (5.59) |
| Smoker | |
| Current | 12.5% (30) |
| Never | 57.5% (138) |
| Ex-smoker | 30% (72) |
| Cardiopathy | |
| LVEF (%) | 42.26 (15.17) |
| Normal (>55%) | 24.70% (60) |
| Mild disfunction | 18.93% (45) |
| Moderate disfunction | 25.51% (61) |
| Severe disfunction | 30.86% (74) |
| Number of years with HF | 5.8 (2.24) |
| Type of cardiopathy | |
| Ischemic | 33.1% (79) |
| Valvular | 19.2% (46) |
| Hypertensive | 13% (31) |
| Idiopathic | 19.6% (47) |
| Others | 15.1% (37) |
| Rhythm | |
| Sinus rhythm | 37.2% (89) |
| Atrial fibrillation or atrial flutter | 62.8% (151) |
| Device | |
| No | 74.9% (180) |
| Pacemaker | 11.7% (28) |
| ICD | 4.2% (10) |
| CRT | 2.9% (7) |
| ICD-CRT | 6.3% (15) |
| Comorbidities | |
| Peripheral vascular disease | 11.7% (28) |
| Cerebrovascular disease | 18.3% (44) |
| Chronic obstructive pulmonary disease (COPD) | 30.4% (73) |
| Need of home oxygen supply | 2.9% (7) |
| Diabetes mellitus | 40.8% (98) |
| Chronic kidney disease (CKD) | 37.5% (90) |
| Blood analysis | |
| Urea (mg/dl) | 73.00 (36.92) |
| Creatinine (mg/dl) | 1.29 (0.50) |
| Sodium (mEq/l) | 140.10 (4.09) |
| Potassium (g/dl) | 4.26 (0.74) |
| Haemoglobin (g/dl) | 12.50 (1.92) |
| Scales * | |
| Barthel | 83.29 (14.16) |
| Gijón | 7.39 (2.33) |
| European Heart Failure Self-care Behaviour Scale (EHFScBS) | 27.91 (8.64) |
Table 3 Univariate analysis of the variables associated to HF-related hospitalisation in the entire sample
| Variable | HR | p-value |
|---|---|---|
| Age | 0.009 | 0.204 |
| Sex | –0.310 | 0.050 |
| Weight | –0.001 | 0.764 |
| LVEF | 0.003 | 0.945 |
| Creat | 0.296 | 0.002 |
| CKD | 0.559 | < 0.001 |
| Years of evolution | 0.082 | 0.001 |
Table 4 Capacity of each hemodynamic parameter to predict HF decompensations according to the severity of the alarm. The values are expressed in Se and FA/pt-y
| Parameter to study | Threshold number | Type of alert | Se | FA/pt-y |
|---|---|---|---|---|
| SBP | 85-95 | Yellow | 0.28 | 11.4 |
| 150-180 | Yellow | |||
| < 85 | Red | 0.08 | 1.4 | |
| > 180 | Red | |||
| DPB | 50-60 | Yellow | 0.23 | 9.1 |
| 100-110 | Yellow | |||
| < 50 | Red | 0.04 | 0.9 | |
| > 110 | Red | |||
| HR | 50-55 | Yellow | 0.30 | 11.2 |
| 90-110 | Yellow | |||
| < 50 | Red | 0.08 | 1.4 | |
| > 110 | Red | |||
| O2Sat | 90-94 | Yellow | 0.15 | 3 |
| < 90 | Red | 0.39 | 13.5 |
Table 5 Capacity of each answer of the questionnaire for the prediction of HF decompensations. The values are expressed in Se and FA/pt-y
| n | Questionnaire | Answer | Se | FA/pt-y |
|---|---|---|---|---|
| 1 | Well-being | Same | 0.88 | 120.7 |
| Better | 0.42 | 90.8 | ||
| Worse | 0.37 | 2.7 | ||
| 2 | Medication | Yes | 1 | 210 |
| No | 0.05 | 3.8 | ||
| 3 | New medication | Yes | 0.15 | 5.3 |
| No | 1 | 209 | ||
| 4 | Diet and exercise | Yes | 1 | 203 |
| No | 0.22 | 11.18 | ||
| 5 | Ankle | Same | 0.86 | 114 |
| Better | 0.44 | 96 | ||
| Worse | 0.35 | 2.9 | ||
| 6 | Walks | Yes | 0.99 | 196 |
| No | 0.37 | 18 | ||
| 7 | Shortness of breath | Yes | 0.41 | 19.93 |
| No | 096 | 194 | ||
| 8 | Phlegm | Yes | 0.44 | 60.5 |
| No | 0.84 | 153.5 |
Table 6 Combinations of different alerts to obtain the right dataset of instances
| Rules | Description of the rules | Se | FA/p-y |
|---|---|---|---|
| R1 | Weight + Ankle + well-being | 0.79 | 15.33 |
| R2 | R1 + yellow | 0.95 | 51.12 |
| R3 | R2 + questionnaire alerts | 1 | 84.5 |
Up to know, we have been using telemonitoring with a codification system that generated alarms depending on the received values. The alerts implemented in our hospital are differentiated into “yellow” (normal value ± 1SD) and “red” alerts (normal value ± 2SD), being these last ones more critical. The alerts thresholds presented are the generic ones, but they can be personalized (this study uses the adapted alerts). Based on the literature studies, we could consider the number FA/pt-y as de facto standard to determine the number of false positives. Besides simple rules, the program also checks the tendency of weight values to trigger an alarm. The program also creates alarms based on the answers from the questionnaire: if one or more answers are “worse,” the questionnaire alert triggers. However, these rules generated large number of false alerts being, hence, not trustworthy.
The final aims of this work are as follows: (1) detect which parameters measured by RPT best predict HF decompensations and (2) create predictive models to assess the risk of HF decompensations in real time using a telemedicine system that will reduce current false alerts.
Statistical analysis
The sample is described for all variables by summary measures after checking for normality when adequate. First, a descriptive analysis for continuous variables is done and these variables are expressed as mean (standard deviation [SD]) or median [interquartile range], according to whether distribution is normal or not) while categorical variables are expressed as percentages. Univariate and multivariate analysis is performed using logistic regression (backward stepwise method) and survival analysis is done through Cox proportional hazards regression (backward stepwise method). Level of significance is set in 5% and confidence intervals are calculated at 95%.
Usage of AI (ML techniques) to create predictive models
The methodology applied for the determination of which parameters measured by telemonitoring best predict a HF decompensation and the generation of the predictive models is presented6:
Splitting training and testing datasets
To build and test a predictive model, the clinical data are divided in training and testing datasets. The training dataset is used to develop the model, and once it is finished, the resulting model is tested with the testing dataset. This way, the overfitting is prevented, and it is possible to check whether the created model will generalize well.
Application of alerts implemented in current clinical setting
To capture the instances that will be used for the classifiers, the alerts used in current medical practice are the starting point. This way, the resulting dataset is more balanced, since the number of monitoring data that leads into decompensation is very limited.
Selection of alerts for instances generation
To obtain the right dataset of instances, the best combination of alerts is sought. First, a filter is applied to discard the days in which HF decompensations have not happened. Once the alerts are selected, when at least one of these alerts is triggered, the patient data of that day are used to build the dataset for ML model building.
Generation of the dataset to apply the ML classifiers
The applied attributes come from:
– Telemonitoring dataset: the value of SBP, DBP, HR, O2Sat attributes, and weight.
– Baseline dataset (Baseline information of the patients)
– HF decompensations dataset: HF decompensations include those episodes treated at home (oral treatment adjustment, administration of intravenous diuretic, or subcutaneous furosemide pumps), hospital admissions, and emergency visits. We have used all the decompensations for our analysis because, although hospital admissions and emergency room visits are those associated with the highest economic cost, we believe that many of the decompensations treated at home could have led to admission if treatment had not been started in time.
Applied ML classifiers
After applying the filters mentioned in the previous section, the following classifiers are used:
– Naïve Bayes (NB)
– Decision Trees (DT)
– Random Forest (RF)
– Support Vector Machines (SVM)
– Neural Network
– Class balancing. Imbalanced class distribution leads to important performance evaluation issues and problems to achieve desired results. Although there are several methods that can be used to tackle the class imbalance problem, we have followed an oversampling approach (Synthetic Minority Oversampling Technique).
Validation method
Once the model has been created (in the training set) and tested (in the testing set), it is validated how it works in the real world. The score value used to test the classifiers is the area under the ROC curve (AUC), a measure that evaluates the balance between sensitivity and specificity and that gets an accurate estimation even in moderately imbalanced datasets, which is our case. The AUC value is used to check how well the classifiers perform, and consequently select the best one. To test the global predictive model, we use sensitivity (Se) and false alerts per patient per year (FA/pt-y), which are the ones used in the literature.
Classifiers comparison
In figure 1, the AUC values of each classifier are illustrated for the steps defined in the rolling cross-validation method. The points are the mean of the AUC achieved in each case, with its SD drawn with whiskers. High SD value indicates that the classifier is less generalizable, while low SD hints a stable classifier.
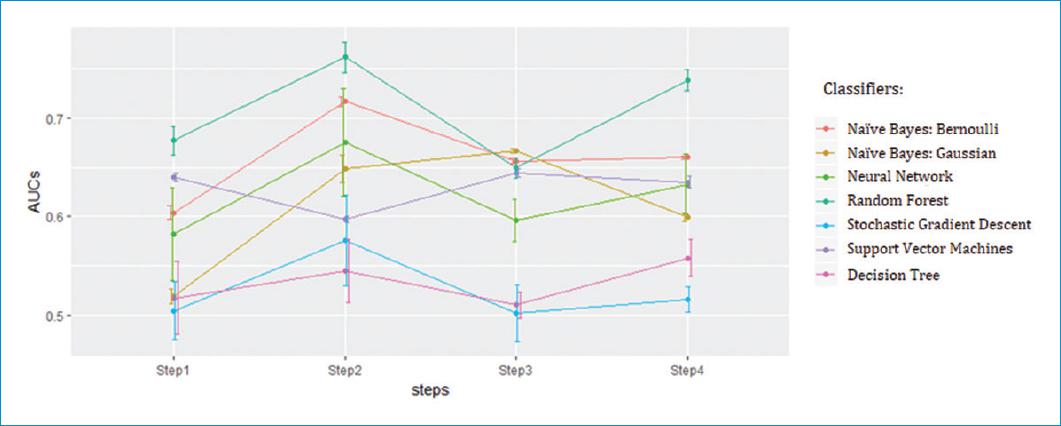
This figure shows that the best classifiers are NB with Bernoulli method and the RF. NB classifier has lower AUC value than RF, but the SD is almost negligible, and the trend throw the steps is more stable. Hence, it is expected that its performance will not vary significantly over time with new data. RF gets the best scores, but it is unstable and it has high SD. Henceforth, NB with Bernoulli method is selected to validate the models and to create predictive models that improve the results so far obtained, preserving the capacity for detect decompensations of ambulatory patients but significantly reducing the false alerts.
Results
In the RPT group, 240 patients were enrolled from May 2014 until February 2018. There were no losses in the follow-up. There is an average follow-up of 13.44 ± 8.65 months.
Table 2 describes the baseline characteristics of the study population.
During the whole follow-up, a total of 527 HF decompensations in 148 different patients were detected. Of these, 347 were managed at home (253 with oral diuretic adjustment, 79 with intravenous treatment and 15 with subcutaneous furosemide pumps7). There were 146 hospital admissions and 34 emergency visits that did not require hospital admission.
An analysis of the variables associated with HF-related decompensations was made. It shows that the female sex seems a protective factor, while the presence of chronic kidney disease (CKD) and the number of years of evolution of heart disease are factors significantly associated with readmissions (Table 3). The type of heart disease the patient has is also related. The highest risk of decompensation in our group is ischemic, followed by valvular and hypertensive, with a statistical significance of p = 0.024. Ischemic heart disease also has earlier mortality (Fig. 2). LVEF, tobacco, history of cerebrovascular disease, type 2 DM, COPD, peripheral vascular disease, and atrial fibrillation/flutter are not associated to HF decompensations in our study.
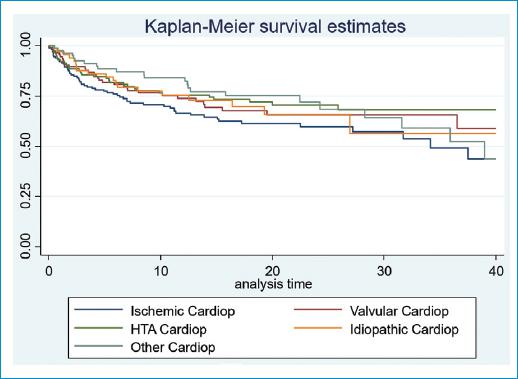
Figure 2 Survival curve to HF-related first hospital readmission according to type of cardiopathy. Survival analysis is performed using Kaplan-Meier analysis (p = 0.024).
Predictors of HF
We have a dataset with 1408.397 transmissions (media 5868.32 transmissions per patient, SD 3938.41). Table 4 describes the alerts currently implemented in our hospital and presents the Se and FA/pt-y values of each parameter obtained in the first analysis. These results were obtained by reviewing the values of the parameters assessed 7 days before decompensation so that they are useful in predicting rather than describing the parameters associated with HF decompensation.
Thus, increments of 1 kg weight in 1 day or 3 kg weight in 5 days perform with a Se value of 0.52 (0.64) and a FA/pt-y of 9.55 (16.38).
Between the hemodynamic parameters, the weight variations (1 kg increase in 3 days or 3 kg in 5 days) and desaturation below 90% in pulse oximetry are good predictors of HF decompensation according to Se and FA/pt-y values.
Focusing on the questionnaire, it achieves a global Se of 0.31 and FA/pt-y of 9.55. To determine which are the questions that perform best, table 5 presents the Se and FA/pt-y for each of them based on each possible answer.
Predictive models to assess the risk of HF decompensations using a telemedicine system
In table 6, the results of the combinations of different alerts are presented.
R1 refers to the sum of weight alert, and the two best alerts from the questionnaire related to ankle (n5) and well-being (n1). If some of these alerts are triggered, R1 is also triggered. R2 refers to the R1 plus the yellow alerts of SBP, DBP, O2Sat, and HR. Finally, R3 refers to R2 plus the questions n3, n4, n6, n7 from table 4. Since R2 detects almost all decompensations (95%), despite the FA/pt-y is quite high (FA/pt-y = 51.12), this is, the one used to generate the instances for the ML classifiers.
NB gets 38% less of Se (0.76→0.47) value but it achieves 72% less of FA/pt-y (28.64→7.8) value. Henceforth, this predictive model improves the results of the actual alerts method and it is more reliable. As the model analyses all the detected decompensations, it is not able to discriminate between those treated at home versus those that required ER visit or hospital admission.
However, as expected, the application of ML techniques entails a decrement on sensitivity values. Despite this Se worsening, it is notorious that the FA/pt-y has much higher decrement.
Discussion
Up to now, efforts to develop a deterministic understanding of rehospitalization have been difficult, as no specific patient or hospital factors have been shown to consistently predict HF decompensations and/or HF-related hospital readmissions.
There are multiple studies that describe the association between patient characteristics, analytical parameters, and hemodynamic measures with readmissions after hospitalization for HF. These studies have not found factors directly and repeatedly associated to HF decompensations and it may be because these parameters are not measured in all studies and to the fact that examined covariates have generally not included common conditions and syndromes found in HF patients. These findings confirm the fact that the relationship between baseline characteristics and clinical factors with readmission is complex8-11.
This variability and multiplicity of parameters have served as the basis for this study, with the aim of seeking a combination of non-invasive, simple parameters that allow us to identify early HF decompensation, to treat them early and avoid, as far as possible, hospital admissions.
Although the study is not designed to determine what baseline characteristics or comorbidities are associated with an increased risk of HF decompensation, our study shows that the female sex seems a protective factor while the presence of CKD and the number of years of evolution of heart disease are factors that are significantly associated with readmissions (in general, patients with advanced heart disease have a greater deterioration of LVEF along with organic involvement secondary to HF, all associated with a lower effect of the established treatment)12. The type of heart disease the patient has is also related to hospitalizations. The cardiopathy with the highest risk of decompensation in our group is ischemic followed by valvular and hypertensive. This finding is described in other registries13. However, there are over 300 prognostic markers described in patients with HF14. In fact, many variables have prognostic power in HF, but the markers vary in their success for predicting outcome because of the heterogeneous nature of HF and the populations in which the variables were studied. Many of the described variables are inter-related and although they may be strong univariate markers of prognosis, they can be competitively removed in any multivariate model.
As seen before, the combination of characteristics that denote decompensation is different from those that denote the “predisposition” to decompensation. The latter ones are the ones that ultimately point to the most effective interventions to actually prevent decompensations.
In our group, significant weight increases (1 kg in 3 days or 3 kg in 5 days), desaturation below 90%, perception of clinical worsening, including development of edema, worsening of functional class, and orthopnea are good predictors of HF decompensation.
These results obtained are consistent with the published bibliography, although these studies do not specify the values of sensitivity, specificity, and false positives and negatives. Neither the usefulness of the combination of these parameters nor their predictive value for the detection of HF decompensations is evaluated in the same study.
Our study determines that weight variations (1 kg increase in 3 days or 3 kg in 5 days) are associated to HF decompensations. This fact is confirmed by the study of Chaudhry et al.15 It showed that clinically important increases in body weight begin at least 1 week before hospitalization for HF. Moreover, during this time period, the risk of HF hospitalization increases in a monotonic fashion with increasing amounts of weight gain. In contrast, weight gain was not observed before hospitalization for causes other than HF.
Changes in weight, especially over short periods of time, can be good indicators of volemic worsening. Many studies, however, are controversial on this subject, indicating that little or no weight gain is observed before an episode of decompensation or that a modest weight loss is observed after clinical compensation of an acute HF episode. In many cases, decompensation may occur not due to the build-up of fluid, but by water redistribution from the periphery to the lungs by neurohumoral and inflammatory acute activation, leading to cardiac and vascular alterations that promote reduced venous capacitance and increased peripheral arterial resistance16.
Desaturation below 90% in pulse oximetry is another good predictor of HF decompensation according to our study. Similar results were obtained by Masip et al.17 Their study shows the utility of baseline SpO2 as a complementary tool to establish the diagnosis and severity of acute or decompensated HF. The finding of a baseline SpO2 lower than 93 may be considered a threshold to this diagnosis and a warning to clinicians about this complication. The lower the SpO2 value, the higher the probability and severity of HF. The main advantage of SpO2 lies in the fact that is non-invasive, it can be monitored continuously, and it is not affected by interobserver or intraobserver variability.
Patient self-assessments are also useful in predicting mortality and hospitalization. In fact, strong correlations have been observed between scores and functional class and the number of HF decompensation that requires hospitalizations: worse self-assigned scores are associated with increased hospitalization rates, worse quality of life, and decreased survival18-20.
As explained before, in clinical practice, the diagnosis of HF based on a single observation is challenging. Although on average patients gain weight before HF hospitalization, only a minority of patients (20%) have substantial weight gain, weight fails to predict accurately hospitalization, and monitoring based on weight alone has proven ineffective. Heart rhythm and electrical disturbances only directly or indirectly describe a portion of early indicators of decompensation. Moreover, a single threshold in a continuous broadly distributed biological measure predisposes to inaccuracy. In addition, one-half to two-thirds of decompensations have potentially avertable precipitants which may be incompletely captured in current models: medication/diet non-adherence, socioeconomic factors, infection and pulmonary processes, worsening renal function, hypertension, and ischemia. Any test predicting decompensation will appear inaccurate if an alternative condition with different pathophysiology is misattributed (such as COPD exacerbation)21.
Thus, the use of a multiparameter-based evaluation of symptoms and signs of congestion is probably the best contemporary strategy. Recent studies have shown that the application of ML techniques may have the potential to improve HF outcomes and management, including cost savings by improving existing diagnostic and treatment support systems.
Therefore, we used ML techniques to improve the accuracy of our alarms and to detect which combination of parameters measured by telemonitoring best predict HF decompensations, avoiding false-negative alerts.
At present, there is little evidence what combination of biometric measurements and questionnaires of self-reported symptoms is most effective in predicting deterioration of HF. Besides the combination, thresholds for these measurements are also less well studied. It stands to reason that when set too wide, then there is a high risk that the patient is decompensated before an alert trigger is generated whereas thresholds which are set too tightly could lead to many “false” alert triggers. In fact, reducing avoidable telehealth alerts could vastly improve the efficiency and sustainability of telehealth programs for HF management22.
Current medical practice uses sensitive alerts (they detect most of the decompensations due to their high sensitivity), but they also have too many false alerts, being not trustworthy and wasting human and economic resources (pre-emptive treatments and admissions). Therefore, the main goal of this study is to improve this imbalance, reducing these false alerts. All in all, this work has shown an improvement from current alerts system implemented in the hospital. The system reduces the number of false alerts notably, from 28.64 FA/pt-y of the current medical practice to even 7.8 FA/pt-y for the “red” group, which is denoted as the most restrictive group. This last result is achieved with the predictive model built by applying NB with Bernoulli to the combination of telemonitoring alerts and questionnaire alerts (testing set) (R2: Weight + Ankle + well-being plus the yellow alerts of SBP, DBP, O2Sat, and HR). However, as expected, the application of ML techniques entails a decrement on sensitivity values. The results obtained in this study for the “red” group is Se=0.47, while the alerts used in the current medical practice applied to the same testing dataset achieve Se=0.76. Despite this Se worsening, it is notorious that the FA/pt-y has much higher decrement, with which we conclude that this new predictive model improves the current medical practice. Moreover, when comparing the obtained results with the state of the art, the Se values are similar or better to these studies that do not consider transthoracic impedance23,24.
On average, models designed to predict the combined outcome of death or hospitalization, or of hospitalization only, have a poorer discriminative ability than those designed to predict death. This may be because hospitalization is genuinely more difficult to predict than death (perhaps because the decision about who to admit to the hospital is much more dependent on health care supply) or because there has been less focus on this type of outcome (as evidenced by the smaller number of published reports)25. Irrespective of the underlying causes of such differences, we believe that efforts are needed to increase the performance of such models in the future to make them clinically more useful.
Our study has several limitations. First, this is an observational study, and despite statistical adjustments, a causal and definite relationship between hemodinamical parameters, self-perception, and HF-related decompensations cannot be determined. Second, this is a single-center study with a limited sample. This has been the case in the first studies that have attempted to determine the usefulness of telemonitoring and the precipitating factors of HF decompensation, since they have included a limited number of patients26,27.
Third, datasets can have errors, missing data, redundancies, noise, and many other problems which cause the data to be unsuitable to be used by the ML algorithm directly. Thus, the pre-processing stage is very important because it prepares the dataset and puts it in a form that the algorithm understands and can process it. Another factor is the size of the dataset: some datasets have many attributes that make it harder for the algorithm to analyze it, discover patterns, or make accurate predictions. Such problems can be solved by analyzing the dataset and using the suitable data pre-processing techniques such as data cleaning, data transformation, missing values imputation, data normalization, and feature selection28.
Finally, no external cohort to validate the findings has been used, which generally limits the conclusions of the study.
Despite these limitations, our findings have potentially important management implications as increased vigilance in HF patients is important to detect and correct decompensation at an early stage which may led to less hospital admissions. This is an important aspect as hospitalizations are the main cost component of HF for health systems. In addition, and not less important, the days of hospital stay due to decompensated HF have a deleterious impact on the prognosis of the illness itself, as well as on the psychoemotional well-being of the patients, their relatives, and/or caregivers. Moreover, together with prognostic and economic aspects, among others, the social repercussion of episodes of HF (sick leave, dependency, etc.) must be considered.
Finally, we must stress that HF is an extraordinarily complex disease with multiple factors, and its predictiveness is complex. Nevertheless, larger amount of data and the registration of all type of decompensations are key to improve the current model.
Conclusions
RPT is a useful tool for the follow-up of HF-patients. In our group, we have detected a significant number of HF decompensations and most of them were managed at home (oral diuretic adjustment, intravenous treatment, and subcutaneous furosemide pumps). We have analyzed our dataset to detect which parameters best predict HF decompensations. In fact, significant weight increases (1 kg in 3 days or 3 kg in 5 days), desaturation below 90%, perception of clinical worsening, including development of edema, worsening of functional class, and orthopnea are good predictors of HF decompensation. We have also built a predictive model applying AI ML techniques, obtaining the best results with the combination of “Weight + Ankle + well-being plus the yellow alerts of SBP, DBP, O2Sat, and HR.”
These results open the door to further studies for the validation of results and the development a comprehensive telemedicine system based on predictive models to detect the risks of a patient suffering HF decompensation.

