Serviços Personalizados
Journal
Artigo
Indicadores
-
 Citado por SciELO
 -
 Acessos
Links relacionados
-
 Citado por Google
 -
 Similares em
SciELO
 -
 Similares em Google
Compartilhar
Revista Facultad de Ingeniería Universidad de Antioquia
versão impressa ISSN 0120-6230versão On-line ISSN 2422-2844
Rev.fac.ing.univ. Antioquia n.37 Medellín jul.set. 2006
Revista Facultad de Ingeniería N.o 37. pp. 93-106. Julio, 2006
c
Abstract
A hardness study of TiN films onto M2 and 304L steels applied by PAPVD was conducted in this work. Instrumented indentation and hardness equipments allow to asses this property. Crack patterns produced during these tests were correlated with this information. In addition, from the P-h/t (Load-displacement/film’s thickness) plots, called Relative Indenter Displacement plots, and P-h plots important information was obtained about the capacity of these systems for supporting load. Both graphics showed to be of great importance for understanding the mechanical response of these systems to indentation.
---------- Key words: mechanical properties, thin films, indentation, hardness, TiN, PAPVD.
La importancia de las curvas RID y P-h en los estudios de capas TiN depositadas sobre aceros M2 y 304L
Resumen
En este trabajo se realizó un estudio de la dureza de capas TiN aplicadas mediante PAPVD depositadas sobre acero M2 e inoxidable 304L. Esto se hizo utilizando un equipo de indentación con censado de desplazamiento y equipos de micro y macrodureza convencionales. Los patrones de agrietamiento dejados en la impresión se correlacionaron con estas propiedades. Se obtuvo información importante de las curvas P-h/t (Carga-desplazamiento/espesor de la capa), llamadas curvas de desplazamiento relativo del indentador (curvas RID), y de las curvas P-h. Ambas curves mostraron ser de gran importancia en el entendimiento del comportamiento mecánico de los sistemas estudiados.
---------- Palabras clave: propiedades mecánicas, capas finas, indentación, dureza, TiN, PAPVD.
Introduction
Indentation tests are nowadays one of the most important tools for the evaluation of mechanical response of films deposited onto hard and soft substrates. In particular, this technique allows to study the hardness (H), elastic modulus (E), toughness (KC), of the film, and its adherence to substrate [1]. To asses these parameters it is necessary to use both heavy (micro and macro indentation) and small loads (nanoindentation) depending on the studied system. There are different tip indenter geometries, the more commonly used being the are pyramidal (Berkovich and Vickers) preferred to induce cracks and plastic flow at low loads, also due to the “easiness” to characterize its geometry and to the self similarity characteristics. These sort of indenters are used for the evaluation of H, E and Kc.
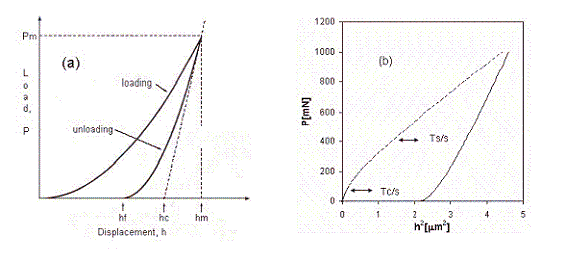
Great improvements in technology have permitted to record both small loads and displacements at the same time, and this turns the indentation test into instrumented indentation test, also know as nanoindentation. The data are usually plotted as P Vs h (figure 1(a)), but recently some researches community have been working in the extraction of more information from nanoindentation data, particularly in coated systems [2-6].
It includes the construction of hardness versus relative indentation depth (β= h (depth) / t (film thickness)) or RID plots and P-h2 plots.
Theoretically, modeling bulk materials as rigid perfectly plastic solids, Loubet et al. [7] demonstrated that the data ploted as P-h2, produces for a Vickers indenter a straight line. When a material is composed by a film and substrate, under small loads a coating-dominated response is expected and under large loads the system behavior is dominated by the substrate. Therefore, the P-h2 plot will present straight regions in which the film or substrate dominates the behavior. Transition points named Tc/s and Ts/s respectively (figure 1(b)) limit these regions. Obviously, these transition points also define the points where hardness and elastic modulus corresponds to film or to substrate.
Figure 1 Schematic representation of indentation data. (a) Load-displacement P-h2 plot, (b) P versus h2 plot. Arrows indicate the transition point to film dominated behavior (Tc/s) and substrate dominated behavior (Ts/s)
Real pyramidal indenters have some tip roundness, and real materials work hardens. Furthermore, hard films are commonly brittle, and exist the possibility of pile up around the indenter and indentation size effect (ISE). The original model of Loubet does not take into account these parameters; therefore one can expect that the behavior of real materials follow a more general expression: P-h η lang=EN-US style='mso-ansi-language:EN-US'>. Thus, the transition points obtained by P-h2 plots could not be appropriate in all cases. Recently proposed Finite Element Models conducted by Bolshakov et al. [8] addressed some of these questions. They demonstrated that maybe the best relation to describe the unload nanoindentation plots are of the form P-hIn the other hand, RID plots (see figure 4) allows to explore the results of hardness and Young’s modulus in a spread load range, showing the transition of coated dominated to a coated-substrate and to a substrate dominated system response. These phenomena are associated with the plastic flow on substrate and with cracks induced in hard-brittle coatings which conducts to a stiffness lose until it does not opposes any resistance to the indenter penetration and only transmits load to the substrate. Due to the importance of RID plots, its development is shortly revised.
A model to predict hardness in a coated-substrate system should take into account the surface generation, deformation and mechanical energy involved in the indentation process. Korsunsky et al. [2-6] proposed this sort of model; finding that the measured hardness (Hc) follows equation 1: where m ≈ 1,5, even for a flat punch, cone or other indenter geometry, which indicates that this values are due to a complex elastoplastic materials response and not to tip roundness.

Where Hf is the film hardness, Hs the substrate hardness and depends, among other things, on Kc film and film-substrate interface toughness. Also β = h/t (RID parameter) where h is the maximum indentation depth. Plotting Hc Vs RID is possible to obtain Hf, Hs, . This equation had proved to be capable to predict the behavior of widely coated systems [2, 6]. However, the value of 2 that accompanies to β, proved to be quite restrictive and was substituted for a variable parameter :

Because of the dependence between α and β, a new parameter o was introduced, resulting in an improved equation [6].

Where β o is called efficiency parameter. The meaning of βo is understood if in equation 2, β=βo. Then becomes:

βo could be interpreted as the RID value at which the improvement in hardness of substrate due to the film presence is of 50% compared with the maximum achievable, or as the RID values at which the film efficiency is 50%. This work studies the mechanical response of TiNM2 and TiN-304L systems; particularly explore different possibilities to establish the transition points between coated only behavior to coatingsubstrate Tc/s, and to only substrate behavior Ts/s.
Also is explored the capacity of the coated systems to support load, because this could be of great importance to the design of this systems.
Experimental study
Materials and characterization
The substrate materials were cylindrical pieces of M2 tool steel heat-treated to 59 HRC and 304L stainless steel metalographically polished. Titanium nitride was deposited on both specimen types in a commercial Balzers reactor using an Arc-Plasma Assisted Physical Vapor Deposition (arc-PAPVD). The deposition was made at 500 oC, during 2 h until a thickness of about 3 μmm was achieved. The microstructure and morphology were assessed by Scanning electron microscopy (SEM) in a JEOL 5900LV microscope and atomic force microscopy (AFM) in a multitask system Auto Probe CP. Present phases were assessed
by parallel beams X ray diffraction (XRD) in a Brueker D8 advanced (Cu Ka, λ= 1,542 Å).
Indentation test
All the specimens were subjected to static indentation with loads between 5 mN and 1.000 mN, applied using a Fischer H100V nanoindenter equipment with Vickers indenter geometry previously calibrated by the linear method [9]. For each load were collected data of at least 5 well comported indentations. To obtain results at loads beyond of 1.000 mN conventional micro Buehler MM3 tester and macro hardness Buehler VM7 apparatus were used.
Indentations allowed to obtain the hardness and elastic modulus of films and substrate, and their variation with the relative indenter displacement.
The crack patterns generated during indentation where characterized by AFM and SEM microscopy.
Experimental results and discussion
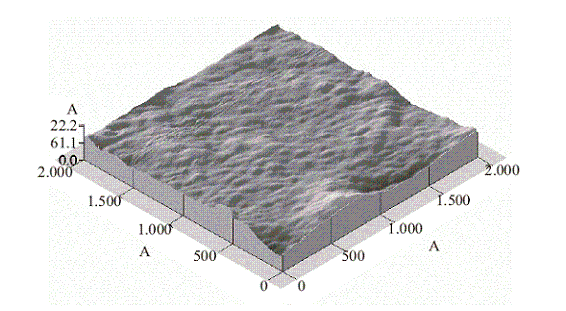
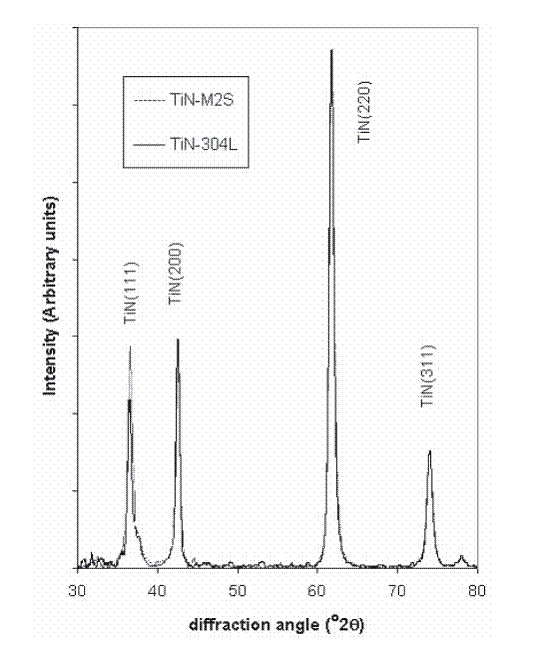
Figure 2 shows topograpy of the films, for both systems TiN-M2 and TiN-304L it looks similar and due to the fabrication process these films grew in a columnar shape of about 13 nm in diameter. The roughness (Ra) measured by AFM is about 40 nm. EDS results show that the films deposited under M2 substrate are almost estequiometric, contrary to that deposited in 304L, that are Ti0,66N0,34. Figure 3 shows XRD results, both systems shows little diferences in what respect to texture and residual compresive stresses.
All specimens were made in the same batch, the only diference was the position on the camera, this can cause some diference in the film thickeness, but measurements done by meas of calo-test indicate that the 304L-TiN films were almost of the same thickness of M2-TiN films, wich is about 3 μm. However, the diference in composition, shows that the substrate plays an important role on the films growth and could also influence its composition.
Figure 2 AFM topographic image of a TiN film deposited onto 304L steel
Figure 3 XDR results for TiN films
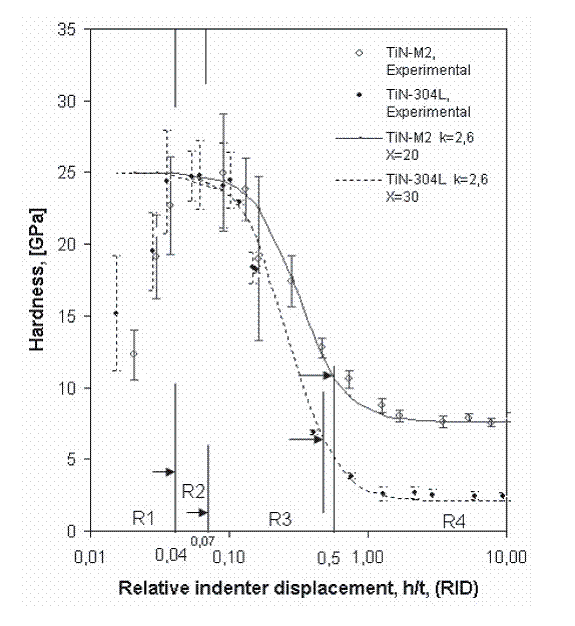
Figure4shows the results of hardness for both systems. This plot known as Relative Indentation Displacement (RID) presents four main regions:
R1: For loads under 15 mN (RID < 0.05 i. e. depth low than 150 nm), the hardness decreases with the load, also standard deviation is higher.
R2: Between 15 and 50 mN (0,05 < RID < 0,07) the hardness has a maximum and stable value of about 25 GPa, the standard deviation had reduced respect to R1 interval.
R3: 0,07 < RID < 0,4-0,5 the hardness and its standard deviation diminishes with load.
R4: RID > 0,4-0,5 the plot i>> 0,4-0,5 the plot goes to a plateau, reaching a constant value of 7,8 GPa, for M2-TiN and to 2,8 GPa for 304L-TiN, also the standard deviation continuously decreases with load.
The trends of Young’s modulus are the same as for hardness, with a maximum value of 400 GPa and a minimum about 200 GPa.
Figure 4 Hardness variation for TiN-M2 and TiN-304L systems with RID parameter (h/t), also shown the adjusts to equation 3
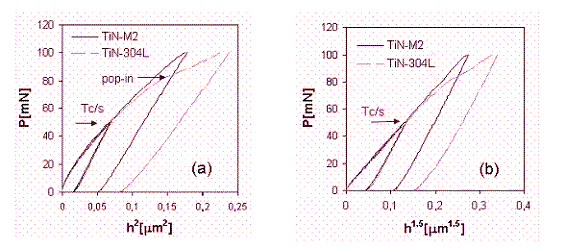
Figure 5 shows P-hη plots for R1 region.
It is difficult to discern if exists some difference in response for each system due to great data dispersion.
The film roughness is about 40 nm, which is in the order of the contact depth, this indicate that in many cases the contact area could be overestimated [10]. The columnar growth of this films produces an opened structure at the top surface,implying that the indenter could penetrate more easily in this region, which is less stiffness than the structure bottom. Therefore the measured hardness increases with load. Other possibilities have been suggested [11], indicating that this loss of hardness and elastic modulus in fact occurs.
P-h2 plots are not straight lines as can be expected (figure 5c), instead they are curves. Many authors had attributed this to the film’s surface roughness and the tip roundness that causes a Hertzian contact which is modeled as P-h1.5. The indenter tip roundness was estimated about 1,5 μm, which means that until depths about 60 nm contact could be of the Hertzian type. In fact, the behavior of R1 region resembles the Hertzian contact, because the P-h1.5 plot showed on figure 5bis almost linear [12]. It is important to note that the end of R1 region is hardly detected whit P-h plots, but it is easy in RID plots, as shown in figure 4.
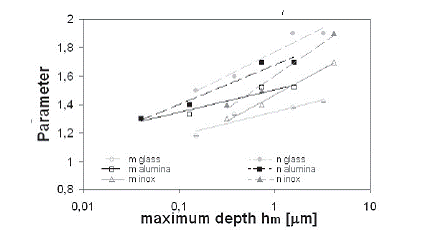
However, for the equipment utilized, P-h2 plots seldom are straight line plots, even in bulk materials free of oxide films and plastic hardened surfaces, instead data acquired by instrumented indentation are best-fitted trough an equation of the form P-h where varies between 1,3 and 1,9.
In the same way has been suggested [13] that the unload data can be adjusted to an equation of the form

The constants k, b and m are adjustment parameters, and the m value is associated with
tip geometry and is equal to 1, 1,5, 2 for Flat ended-cilindrical punch, paraboloid of revolution and cone respectively. However, recent studies conducted by Bolshakov et al. [8] indicated that the m value is low and nearest to 1,5 due to a complex elastoplastic process during indentation and not only to the tip indenter geometry.
Figure 5 P-h, P-h2 and Ph1,5 plots for TiN-304L and TiN-M2 systems obtained at 15 mN they show the response in the R1 region, correlation coefficients for linear adjustments are shown as R2
Figure 6 shows m and η values obtained for soda lime glass, high pure alumina and 304L steel, with 10 < E/H < 91, values which covers all commonly used engineering materials. It shows that m values are about to 1,5 even for high depths where any influence of tip roundness is insignificant (for more details on the calculation procedure see reference [9]). This result is in agreement with Bolshakov’s predictions.
Figure 6 Values of m and η parameters in different bulk materials, glass and alumina are free of oxide and disturbing surface effects, while 304L steel has a strain hardened surface
As was stated above, η values continuously increase with depth between 1,3 and 1,9, and P-h2 plots have lower correlation coefficients than P-hη plots.
Curiously, it was found that for coated systems that still at depths where the film or substrate governs the behavior (corresponding to R2 and R4 regions on figure 4), the data behavior is better adjusted by a P-h1.5 rather than P-h2 plots.
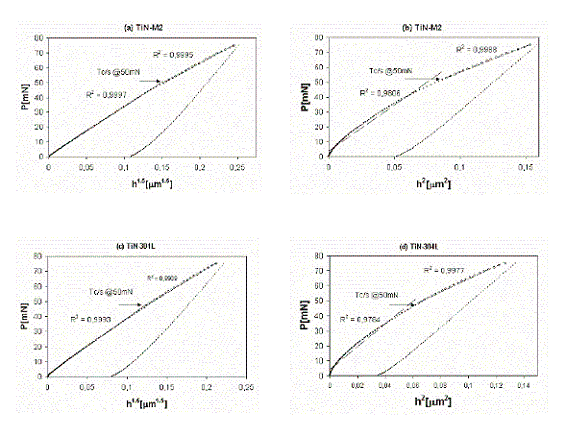
Figures 7 to 9shows typical P-h1.5 and P-h2 plots for every one of these regions. Figure 7(a)shows P-h2 plots for both systems at 50 mN, at this load evel the behavior corresponds to a R2 region, ach of these plots are the same for both systems, ndicating that the response is only due to the film, nd the substrate has not any contribution. Again, -h1.5 plots (figure 7 (b)) are almost linear. In fact, he correlation coefficients of adjusted lines are etter than those obtained in P-h2 plots. The end f this region is shown as Tc/s in these Figures.
For both systems, P-h2 and P-h1.5 predict this ransition at 50 mN. This is better illustrated in
Figure 8. Note how P-h1.5 plots present the best orrelation coefficients for R1 and R2 regions, hile P-h2 are linear for the R2 portion but not or R1. The RID parameter at this load level is qual to 0,07. The fact that both systems have the ame Tc/s tells that at least for a couple substrates sed here the substrate plastic deformations, at his load level, did not play an important role in ilm’s deformation. Also the RID value confirms he rule of thumb of “not exceed the 10% film hickness to measure its hardness” and also is in he limit proposed by Cay et al [14].
Region R3 reflects the influence of film stress relieving, cracking and substrate plastic yield. In the case of TiN-304L the first pop-in occurs at 85 mN, and for TiN-M2 this event occurs only until 110 mN. This phenomenon seems not to be an evidence of cracking, because topographical images obtained by AFM does not show any annular crack at loads little higher than these.
Note that the substrate contributions begin before the first pop-in, this does not exclude the possibility of film microcracking, subsurface cracking and densification, but this could not be verified in this work because physical sections of the imprints could not be obtained. The fact that the systems go from R2 to R3 region before the first pop-in occurs, means that the films are following the substrate plastic deformation. This explains why the TiN-M2 delay the first pop-in, and is because M2 steel is harder than the 304L steel, therefore this last will reach first higher deformation levels, producing also high deformations on the film.
Figure 7 P-h2 and Ph1.5 plots for TiN-304L and TiN-M2 systems obtained at 50 mN and 100 mN. Tc/s denotes the transition points from R1 region to R2 regions
After these first pop-ins, still in R3 region, more of them occur and are detectable, in some cases they are associated with different crack types, and are extensively discussed in references [2, 14-16].
Micrographs in figures 10and 11at different load levels shown that TiN-M2 system is less prone to suffer cracking than TiN-304L system. TiNM2 systems at loads greater that the maximum achievable by the nanoindenter equipment, for example at 300 gf, seems to display only superficial cracks, while TiN-304L system clearly shows circular cracks that probably propagates trough thickness. Due to that the M2-TiN system for all loads in nanoindentation range have contribution of the coat to support load, P-hn plots do not shows a clear transition points, to only substrate behavior, contrary to what occurs in TiN-304L system.
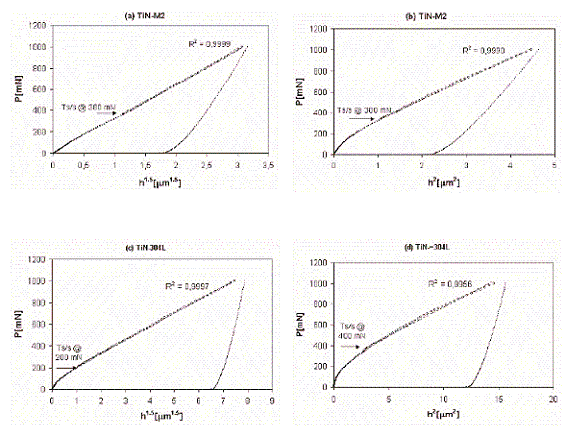
Figure 8 shows the end of R3 regions as Ts/s, and are summarized in table 1. By what was discussed above, it is expected that the system with a harder substrate delay its transition more than the system with soft substrate [14], at least the load at which it occurs. The transition point obtained from the RID plot was defined as the point in which the plot has a change in curvature before reaching the plateau called here RID*. These results were in agreement with was expected. However, the results of P-h2 plots contradict this expectation, also transition points are variable with the maximum load used for the analysis. Therefore, the results reported here come from plots obtained
at maximum load of 1000 mN allowed by the equipment. On the other hand P-h1.5 plots predictions are according to the expectation. The best correlation coefficients for plateau regions in plots P-h1.5 compared with those of P-h2 plots strongly suggest that P-hn plots are more convenient to find the transition points. However, it must be pointed out that slightly deviations from the correct frame compliance or area function of nanoidenter could influence the P-hn plot’s shape, and Fishercope equipments seems to have a variable frame compliance, currently we are conducting studies to solve this question.
Yet, it could be conclude that as a whole P-h2 and P-h1,5 plots shown to be difficult for discern the transition points because it is necessary to define the minimum correlation coefficient at which one considers that the adjusted plots for plateau regions are straight lines. Consequently, it is possible to obtain different transition point values for little differences in correlation coefficients; this is particularly true for coatings under hard substrates.
On the other hand, the efficiency parameter βo obtained from RID plots showed in table 1indicate that in fact TiN-304L system has less capacity to support lads, i. e. βo.= 0,22 while for M2-TiN systems βo = 0,27. An advantage of the βo parameter is that it permits to compare different film-substrate systems, because it seems to be more sensible than the parameter of the P-hη plots. Also, it was not necessary to make assumptions to find the βo parameter, because it comes directly from RID plots. Finally RID* parameter has the advantage that it is easy to find out, but at least without a computational routine is prone to subjectivity and different systems could be non-comparable contrary to the case of βo parameter.
Figure 4 shows χ and k parameters obtained from the RID plots. χvalues according to Tuck [6] are related to the system load support capacity, in this work it was found that χ seems not too sensible to the response of the systems because its values were 2,6 for both of them.
Taking into account that RID plots show different behaviors for both systems, it is possible to conclude that χ parameter is not useful to describe the systems under study. In fact, when a value of 2 was fixed for this parameter (as the first developments of the model proposed [1]), the model also produces a good fit.
On the other hand, the k parameters were equal to 30 and 20 for TiN-304L and M2-TiN systems respectively. According to Tuck [6] this parameter is related to the system deformation mode. High
Table 1 Transition points Ts/s obtained by P-h2, P-h1,5 and RID plots
Figure 8 P-h1,5 and P-h2 plots obtained at 70 mN for both systems. Arrows marked as Ts/c denote the load transitions from film response (R1 region) to film-substrate response (R2 region). Also correlation coefficients of the lines adjusted to a R1 and R2 region are denoted as R2
values of it correspond to a soft substrate and high fracture toughness. According to this, the M2-TiN system has less fracture toughness but better load support capacity (it substrate is harder).
In R3 region, for both systems, cracks seem to be superficial, as is shown in figures 10 and 11. These Figures shows that these cracks have shear steps shape. As the load is increased, first annular cracks are originated and are visible at the edge and inside the indentation, particularly for TiN- 304L system probably at loads about 0,5 RID they are trough thickness, however can not be possible to obtain sections of them to confirm this.
Figure 9 P-h1.5 and P-h2 plots obtained at 1.000 mN for both systems. Arrows marked as Ts/s denote the load transitions from film-substrate response (R2 region) to only substrate response (R3 region). Also correlation coefficients of the line adjusted to a R3 region are denoted as R2
Finally the R4 region for TiN-304L show a response due almost exclusively to substrate whose pile-up contributes to an extensive coating cracking, in this case a complete annular crack is present, which means that coating has no influence in system behavior. For hard substrate almost all cracks seems to be very superficial and the coating still influences the system behavior.
At high loads first radial cracks are produced and the critical load to generate them are lower in M2-TiN (at 5Kg) than in the TiN-304L system (at 10 Kg). Also the radial cracks were always longer in M2-TiN system. This indicates that the elastic recovery plays an important role in the generation of this type of cracks as for the case bulk materials [17], and strongly suggest that the films Kc hardly could be obtained by this method because substrate began to suffer plastic deformation and play an important role on the contact system response. However, this behavior match with the conclusions derived from k parameter, because radial cracks length and density are great for brittle systems. This suggests that energy techniques must be explored to obtain more information about the fracture behavior of brittle coated systems.
At the end of R4 region, the extensive coating cracking causes that the coatings only transmit load and the properties measured corresponds only to a substrates, which have an elastic modulus of 250, 220 GPa and a harness of 7,8 2,5 GPa for the M2 and 304L steels respectively.
Figure 10 (a) AFM image for imprint leave at 250 mN for TiN-M2, arrow indicates the shear steps (Ec). (b) y (c) SEM images for imprints leave at 1.000 mN and 300gf respectively, arrows marked as Gc show circular cracks T
Figure 11 (a) AFM image for imprint leave at 250 mN for TiN-304L, arrow indicates the shear steps (Ec) (b) y (c) SEM images for imprints leave at 500 mN and 1.000 mN respectively, arrows marked as Gc show circular cracks
Conclusions
The hardness of TiN-M2 and TiN-304L samples show the so called ISE effect at low load levels, and seems to be a morphological, structural-film effect and a geometric indenter effect.
P-h1,5 plots fit better the plateau intervals for film or substrate only response than the P-h2 plots. Therefore, P-hn plots are more conveniently to find the transition points than P-h2 plots. Nonetheless, from both plots it is not easy to find this transition points due to the sensibility of the adjusted lines to acquired data and to its dependence with the maximum load used for the analysis. Also hard substrates hide transition points in these plots, and results from both plots are very different.
RID plots can provide a great deal information about mechanical responses of coated systems.
In particular, the efficiency parameter βo, is more suitable than P-h η plots to establish the transition points. This parameter could be used to compare different sort of systems, and should be a powerful design parameter. Also parameter obtained
from this plots seems to provides important information about to fracture process.
Superficial cracks generated at low load levels are of the shear steps type, for the films under study they seem not to be through thickness. With load increasing, circular cracks are generated, and some of them could be through thickness, they conduct to a loss of film stiffness and therefore to a loss in the capacity to support load until the substrate is the only responsible of it.
Acknowledgements
This work was supported partially by the Instituto Colombiano de Ciencia y Tecnología Colciencias, under contract RC 596-2002 code 118-08- 12746, and by the Dirección de Investigaciones de la Universidad Nacional de Colombia sede Medellín DIME, under contract 2002-87364712. The authors gratefully acknowledge the contributions of BRASIMET unidad de Santo Amaro, São Paulo, Brasil, by provide PVAPVD films in particular to Engs. Paulo Venkovsky and Ronaldo Ruas. Also the authors are grateful with Surface Phenomena Laboratory (LFS), Polytechnic-School, Sao Paulo University, Brazil, for permit the use of its laboratory.
References
1. C . Fisher, “Nanoindentation,” Springer, 2nd ed., 2004. [ Links ]
2. S. V. Hainsworth, M. R. McGurk, T. F. Page. “The effect of coating cracking on the indentation response of thin hard-coated systems”. Surf. Coat. Tech. Vol. 102. 1998. 97-107. [ Links ]
3. A. M. Korsunsky, M. R. McGurk, S. J. Bull, T. F. Page. “On the hardness of coated systems”. Surf. Coat. Tech. Vol. 99. 1998. pp.171-183. [ Links ]
4. M. R. McGurk, T. F. Page. “Using the P-δ2 analysis to deconvolute the nanoindentation response of hard-coated systems”. J. Mater. Res. Vol. 14. 1999. pp. 2283-2295. [ Links ]
5. J. R. Tuck, A. M. Korsunsky, S. J. Bull, R. I. Davidson. “On the application of the work-of-indentation approach to depth-sensing indentation experiments in coated systems”. Surf. Coat. Tech. Vol. 137. 2001. pp. 217-224. [ Links ]
6. J. R. Tuck, A. M. Korsunsky, D. G. Bhatc, S. J. Bull. “Indentation hardness evaluation of cathodic arc deposited thin hard coatings”. Surf. Coat. Tech. Vol. 139. 2001. pp 63-74. [ Links ]
7. J. Loubet, J. Georges, G. Meille, In: Blau P. J:, Lawn B. R. (eds.). Microindentation Techniques in Materials science an Engineering ASTM STP 889. American Society for testing and Materials.Philadelphia. PA. 1986. pp. 72-89. [ Links ]
8. A Bolshakov, G. M. Pharr. “Influences of pile up on the measurement of mechanical properties by load and depth sensing indentation techniques”. J. Mater. Res. Vol. 13 1988. pp. 1049-1058. [ Links ]
9. J. M. Meza, Jr. Franco., J. M. Vélez. “Calibration of nanoindentation equipment by means of Linear Method”. In preparation. [ Links ]
10. K. D. Bouzakis, N. Michaidilis, S. Hadjiyiannis, G. Erkens. “The effect of specimen roughness and indenter tip geometry on the determination accuracy of thin hard coatings stress-strain laws by nanoindentation”. Mater. Charact. Vol. 49. 2003. pp. 149-156. [ Links ]
11. A. Leyland, A. Matthews, “On the significance of the H/E ratio in wear control: a nonocomposite coating approach to optimised tribological behaviour”. Wear Vol. 246. 2000. pp. 1-11. [ Links ]
12. R. Yu Lo, D. Bogy. “Compensating for elastic deformation of the indenter in hardness test of very hard materials”. J. Mater. Res. Vol. 14. 1999. pp. 2276-2282. [ Links ]
13. W. C. Oliver, G. M. Pharr. “An improved technique for determining hardness and elastic modulus using load and displacement sensing indentation experiments”. J. Mater. Res. Vol. 7. 1992. pp. 1564-83. [ Links ]
14. X. Cay, H. Bangert. “Hardness measurements of thin films-determining the critical ratio of depth to thickness using FEM”. Thin Solid Films Vol. 264. 1995. pp. 59-71. [ Links ]
15. S. Bhowmick, A. Kale, V. Jayaram, S. K. Biswas. “Contact damage in TiN coating on steel”. Thin Solid Films. Vol. 436. 2003. pp. 250-258. [ Links ]
16. J. M. Meza. “Applied indentation techniques to asses mechanical properties of TiN films”. MsC thesis. National University of Colombia. January. 2004. [ Links ]
17. A. G. Evans, E. Charles, Fracture Toughness determination by indentation. J. Amer Ceram.Soc. Vol. 59.1976. pp. 371-372. [ Links ]
* Autor de correspondencia: teléfono: +57+4+415 90 95, fax: +57+4+411 23 72, correo electrónico: jmmmeza@upb.edu.co(J. M. Meza).1


