Servicios Personalizados
Revista
Articulo
Indicadores
-
 Citado por SciELO
 -
 Accesos
Links relacionados
-
 Citado por Google
 -
 Similares en
SciELO
 -
 Similares en Google
Compartir
Revista Facultad de Ingeniería Universidad de Antioquia
versión impresa ISSN 0120-6230versión On-line ISSN 2422-2844
Rev.fac.ing.univ. Antioquia v.38 n.1 Medellín ene./jun. 2006
The nitrogen/phosphorus and the succession of phytoplankton in two lakes located in the alluvial prairie of Main river in Germany
Néstor Aguirre, a*Bernd Werding, b Jaime Palacio a
a Grupo de Investigación en Gestión y Modelación Ambiental GAIA. Facultad de Ingeniería. Universidad de Antioquia. Medellín - Colombia.
b Institut für Allgemeine und Spezielle Zoologie der Justus Liebig Universität Giessen. Stephanstrasse.
(Recibido el 24 de febrero de 2005. Aceptado el 15 de mayo de 2006)
Abstract
Variation in seasonal nitrogen/phosphorus ratio and phytoplankton community succession were compared between March and November1997 in a lake directly connected to the Main River and in another lake without direct connection. Results showed a massive growth of Cyanophyta during summer in association with low N/P ratios (10-5:1), whereas Crysophyta and Chlorophyta abundance was accompanied by high N/P ratios (50-20:1). Evidences suggest that composition and structure of the phytoplankton community are related to phosphorus and nitrogen availability, and also contributes to the appearance of new phytoplanktonic species. However phytoplanktonic community succession were more correlated with the dominance degree of some species.
---------- Key words: nitrogen-phosporus ratio, succession, phytoplankton community structure, Main river.
La relación/nitrógeno fósforo y la sucesión de fitoplancton en dos lagos localizados en la pradera del Río Main (Alemania)
Resumen
Entre marzo y noviembre de 1997 se comparó la variación estacional de la relación nitrógeno/fósforo y de la sucesión de la comunidad fitoplanctónica en un lago conectado directamente al río Main y en otro lago sin conexión directa. Asociado a bajas relaciones N/P (10-5:1) se observó un crecimiento masivo de cianofitas en el verano, mientras que la abundancia de crisofitas y clorofitas estuvo acompañado de altas relaciones N/P (50-20:1). La evidencia sugiere que la composición y estructura de la comunidad fitoplanctónica está relacionada con la disponibilidad de fósforo y de nitrógeno, y además contribuye a la aparición de nuevas especies fitoplanctónicas. Sin embargo, la sucesión de la comunidad fitoplanctónica estuvo más relacionada con el grado de dominancia de algunas especies.
---------- Palabras clave: relación nitrógeno/fósforo, sucesión, estructura de la comunidad fitoplanctónica, río Main.
Introduction
Law of the minimum or limiting nutrient concept suggests that the minimum availability of a chemical substance in an ecosystem, defined by the stechiometrical relationship between mass and concentration, determines the biomass. An increment in the availability of the minimum factor increases the capacity of biomass sustentation, until another resource turns into the minimum factor but limiting factors are not changeable one for another [ 1].
The limiting nutrient concept is based in the principle that, under adequate light and temperature conditions, the algae growth in a mass of water is proportional to the nutrients concentration, and the former is a function of its charge [2]. Hence this concept is related to eutrophication phenomenon, especially in limnetic environments, therefore it could be useful in limnological theory to the elaboration of predictive models that allow the development of strategies for adequate management of those ecosystems.
The OECD Organization for Economic Cooperation and Development model [3] describes the relationship between phosphorus charge and concentration, and the biomass of the phytoplankton. For the control of antropogenic eutrophication it should be considered as an effective strategy, the reduction of the nutrients input into the water system [2].
Phytoplankton absorbs and uses nutrients from water column in an atomic relationship of 106 C: 16 N: 1P [32, 20]. The limitant concentrations of the bioavailable fraction are 20 g L-1 of nitrogen and 5 g L-1 of phosphorus. If both concentrations are higher than that, the nitrogen/phosphorus ratio is used to establish the limiting nutrient [2]. Different positions regarding the hypothesis that there is a deterministic effect of the N:P quotient on the structure of the phytoplankton were presented concerning this matter [4].
Lakes formed in alluvial material extraction zones are secondary biotopes, which are originate from groundwater contributors and not from disembarkation zones [5, 6]. In this kind of ecosystem with a high antropic influence, a secondary succession is expected [7]. In the present work, two lakes formed by the extraction of alluvial material were studied, aiming to establish the seasonal nitrogen/phosphorus ratio variation and the successional changes in the phytoplankton community.
Zone of study
Main River in the Federal Republic of Germany. Lake 1 is located at 49º 54 north latitude and 10º 10 west longitude, close to Ober Eisenheim Main, km 314,75). Lake 2 is located at 49º 53 north latitude and 10º10 west longitude, close to Elgersheim Main, km 310).
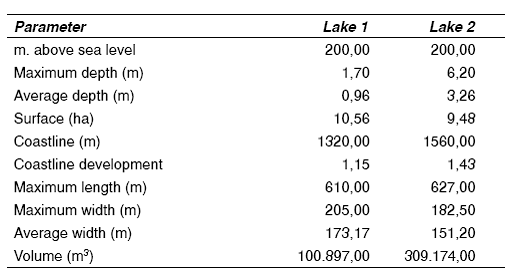
The zone of study is characterized by the presence of weak winds, high temperatures and a elevated number of daylight hours, compared to the bordering areas. The precipitation levels are low and vary from 500 to 600 mm.year-1 [8]. In table 1 the morphological features of the lakes are presented.
Materials and methods
Two stations were chosen in each lake, and in each one, samples were taken 10 cm below the surface, in the photic limit zone, while other samples were taken right above the bottom. The photic limit zone was established based on the Lambert-Beer Law [9, 10]. A Ruttner-Schöpfer bottle with a maximum capacity of one liter was used to take the water samples. The sampling was done monthly between March and November, 1997.
Chemical variables
The analysis of the chemical variables (nitrogen and phosphorus) were performed by spectrophotometry, using a PU 8620 Series equipment, a Phillips UV/Visible Spectrophotometer, Scientific & Analytical Equipment, and by the use of Merck Spektroquant analytical reagents.
Table 1 Morphometric parameters of the lakes
Biological variables
The phytoplankton samples were taken with 10 m diameter mesh size nets and with 15 cm diameter and 50 cm ring length. The quantitative samples were obtained by filtering five liters of water of each depth at each station. The samples were fixed with Lugol solution and refrigerated in the dark at 5 ºC, according to the procedure suggested by Schwoerbel [11]. 48 phytoplankton samples were analyzed for each lake.
The determination of the organisms was brought to the level of species in most cases, using the following bibliographic sources: Das Phytoplankton des Süwasser [12, 13, 14, 15, 16, 17]; Süwasserflora von Mitteleuropa [18, 19, 20, 21, 22, 23, 24, 25, 26, 27]; Bourrelly [28, 29, 30]; Fott [31]; Strebel and Krauter [32]; Pankow [33]; Mauch [34].
The organisms were observed through a Leitz Wetzlar Dialux light microscope up to 1250 X, supplied with an ocular micrometer and a lucid camera. For the study of the diatomophyceae algae, the samples were rinsed with a hydrogen peroxide solution and after that they were fixed with Canadian balsam. The counting of the organisms was made with a Leitz Wetzlar Dialux reverse microscope with the count chamber held at a volume of 0,3 ml. For each algae sample a species accumulation table was built. The organism abundance per volume unit was calculated according to Ross [35].
Results
In November, due to the low temperatures, only one sample from the first station of each lake were obtained. Table 2 shows the results for sample size (n), arithmetic average (MA), standard deviation (SD) and the variation quotient (%CV) for the variables that are summarized.
Table 2 Main statistics data for the nitrogen and phosphorus variables for Lakes 1 and 2

Dissolved nitrogen
In lake 1, the average dissolved nitrogen was 2,01 mg/L, with a variation coefficient of 74% (table 2). While in March and May a slight increasing tendency of those values with depth was observed, on the other months the profiles were orthograde. High dissolved nitrogen concentrations were found in October and November, and the maximum concentration was measured on September in the photic limit zone. The dissolved nitrogen profiles in station 2, lake 1, showed an orthograde behavior with a tendency to increase throughout the year.
In lake 2 the average dissolved nitrogen value was 6,23 mg/L with a variation coefficient of 67%. In station 1, lake 2, orthograde dissolved nitrogen profiles were found. However, while in August an increase of the average nitrogen concentration in the photic zone was observed, on September a progressive increase of this variable with depth was registered.
Station 2 exhibited orthograde profiles, except in August and September, where clinograde profiles were evident. The values increased with time, with a maximum in September in the hipolimnion.
Orthophosphates
Average value of orthophosphates in station 1, lake 1, was 0,46 mg/L, with a variation coefficient of 66%. In consequence, there was a continuous orthophosphate availability throughout the year in this station. In both stations of lake 1 the values were around 0,5 mg/L, but on September a deviation occurred with the presence of higher values.
In lake 2 the average orthophosphates value was 0,66 mg/L and in station 1, an increase with depth was observed. For the period of the study the orthophosphates increased slightly and reached the maximum value by the end of the summer. In station 2 the values increased with depth and the maximum values were also detected in summer.
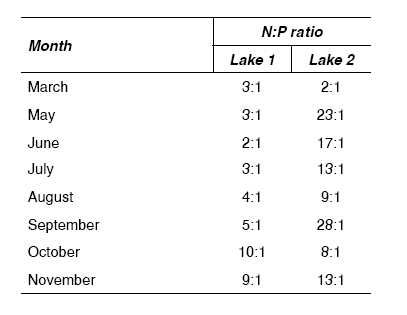
Table 3 shows the data of the variation in the nitrogen and phosphorus ratios for both lakes along the sampling months.
Table 3 N:P ratios in both lakes along the sampling months

Phytoplankton
In the collected samples, a total of 141 morphospecies of the phytoplanktonic community were found. From these, 8 belong to division Cyanophyta, 44 to Chrysophyta, 7 to Euglenophyta, 2 to Dinophyta, 12 to Cryophyta and 68 to Chlorophyta.
Quantitative phytoplankton analysis
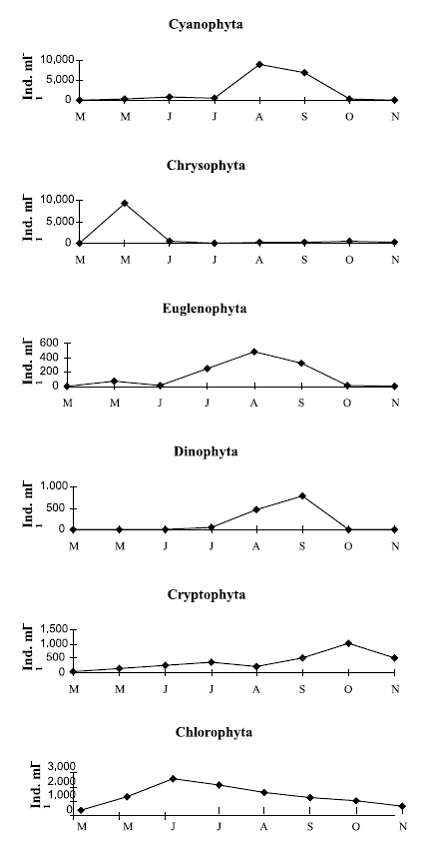
The main phytoplankton groups succession in lake 1 started with the group of Chrysophytes in Spring, followed then by the group of Chlorophytes. In Summer, an increase of Cyanophytes and Euglenophytes occurred. In September, Dinophytes reached a maximum development, along with the dominant presence of Cyanophytes, Euglenophytes and Chlorophytes (figure 1).

Figure 1 Main Phytoplankton groups succession in lake 1
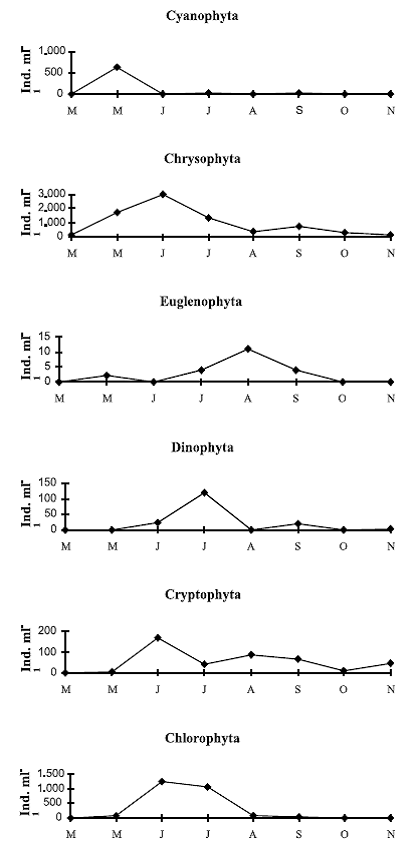
The succession of the main phytoplankton groups in lake 2 started on May with the presence of Chrysophytes and Cyanophytes. Chrysophytes were abundant until June, where Chlorophytes and Cryptophytes appeared simultaneously, in low abundances. On July Chrysophytes and Chlorophytes dominance went on, and from August on, every group was less abundant. Consequently, the tendency in the abundance of the algae groups was alternant and unimodal (figure 2).

Figure 2 Main phytoplankton groups succession in lake 2
Discussion
In lake 1, the nitrate showed the lowest values because of the demand of algae in spring and summer. A little increase in the nitrate concentration in August and September was associated with a massive growth of Cyanophytes especially Aphanizomenon flosaquae and Anabaena spyroides, which can fix atmospheric nitrogen. In short, nitrate did not showed significant variations, either in the water column nor along the study period.
The ammonium concentration reached two maximum peaks associated with depth and with seasonal conditions. Between August and October the concentrations varied from 0,5 to 4 mg/L, which can be considered low to moderate. In summer, when the luminic phase stratification was stable the rise in the oxygen concentration through the photosynthesis process favored significantly the nitrification in the superficial layers, whereas in the hipolimnion, anaerobic conditions permitted an increase of ammonium concentration in the deeper zone. As a result of the water mixing at night, the oxygen produced during daylight was brought to the bottom of the water masses, helping the nitrification occurrence in the deeper zone.
In lake 1 the soluble phosphorus was available throughout the whole study period and reached in September the maximum concentration. The orthophosphates availability along the water column is the result of its interaction with iron and the complete mixing. Despite of the high demand by blue-green and green algae, the orthophosphates were available during the study period.
An interesting aspect was the massive and almost exclusive growth of diatoms during spring in lake 1, and their posterior disappearing over the other months of the year. This fact could be associated to the depletion of soluble silica as a consequence of its high demands on spring by the diatoms. However, this observation should be a subject of further investigation, since the concentration of silica in the water was not measured.
In lake 2, the total nitrogen showed an increasing tendency with depth only on September due to high concentrations of nitrate, whereas in June and July the nitrate values were low associated to a high primary production, in August and September the high concentrations were associated with the decrease in the primary production. In general, the nitrates concentrations did not showed an limitating effect upon the primary production in lake 2.
The nitrites concentrations was generally low and did not vitiated significativly through the water column. The ammonium showed an increasing tendency with depth and reached the maximum concentrations at the bottom. The presence of oxygen in the water column in lake 2 favored the aerobic processes and the permanent nitrification of the ammonium.
In lake 2 the orthophosphate concentration decreased in the subsurface of the water on June and July in lake 2, due to the high demand by Chlorophytes and centric diatoms (Stichococcus cf. bacillaris and Stephanodiscus neoastrea), without ever reaching total depletion. The permanent interchange of water between the lake 2 and the Main river favorized a permanent availability of the soluble forms of nitrogen and phosphorus in this lake.
As in lake 1, in lake 2 the growth of diatoms was associated with the availability of silica in the water. In consequence, after its massive growth in July, these algae group disappeared in other months due to the depletion of this substance.
The successional changes in lake 2 were affected significant by the permanent water interchange with the river and the irregular morphology of the bottom. In contrast, lake 1 presented no constant exchanges with Main river and the morphology of the bottom was more even.
Both lakes are polimictic with orthograde profiles during the cold seasons of the year. Due to that in summer both presented thermal stratification during daylight and a complete mix at night, the nutrients were distributed homogenously in the water column and showed a permanent availability throughout the study.
In both lakes the phosphorus never behaved as a limiting factor in neither of the two lakes, due to the constant supply of this nutrient during the mix in spring and autumn, and the circulation at night in summer. Despite of its decreasing in lake 1, the bioavailable nitrogen did not represent a limiting factor for the algae growth. Nevertheless, this fact helped a wide dominance of nitrogen fixating blue-green algae with massive growths on August and September.
The use of the N:P ratio principle to establish the limiting nutrient could be applied in this study without any restrictions, because the concentrations of nitrogen and phosphorus in both lakes were up to 20 and 5 g/L respectively [2]. According to the N:P proportion (table 3) the algae growth should have been limited by nitrogen in lake 1, and a limitation by phosphorus should have occurred in most samples of lake 2. Nevertheless, in both lakes algae growth reductions were not preceded by nitrogen and phosphorus limiting concentrations. In spite of low N:P proportions showed by lake 1 in summer, in this period was registered a massive growth of Cyanophyta, this fact demonstrates that N:P ratio was not a determinant factor of the growth and structure of phytoplanktonic community in both lakes studied.
If the N:P ratio in these lakes would be a conclusive factor to the growth and structure of the phytoplanktonic community, limitations by the phosphorus should be expected in lake 2. These limitations were not evidenced, since phosphorus was always available in the water column. The successional changes in this lake were associated with other factors, like the direct connection with Main river and its effect on the decrease in the hydraulic retention time, the water temperature and the polymixis of the system, besides other intrinsic factors like the successive changes of the fitoplanckters and the possible depletion of silica because of its demand by diatoms as result of the physiologic activity of this group of organisms.
Our results permit to conclude that, in the particular case of this lakes, the time changes of N:P ratios do not seem to be a determinant factor of phytoplankton growth, and the community behavior can not be either explained by variations in N:P ratios. There are multiple extrinsic and intrinsic factors associated to the phytoplankton successional variation, these factors would have a weighted effect related to the particular characteristics of each environment.
References
1. M. E. Begon, J. L. Harper, C. R. Townsend, Ökologie. Spektrum Akademischer Verlag. Herausgegeben von Klaus Peter Sauer. Heidelberg. 1998. p. 750. [ Links ]
2. J. H. Berndt. Die ökologische Bewertung von niederrheinischen Baggerseen mit Hilfe von Makrozoobenthosarten als Bioindikatoren. Inauguraldissertation an der Universität Köln. Köln, Deutschland. 1989. [ Links ]
3. E. A. Birge, The Heat Budgets of American and European Lakes. Trans. Wis.> Acad. Sci. Arts Lett. N.º 18. Part 1. 1915. pp. 166-213. [ Links ]
4. E. A. Birge, The Work of the Wind in Warming Lake . En: Trans. Wis. Acad. Sci. Arts Lett. N.º 18. Part 2. 1916. pp. 341-391. [ Links ]
5. P. Bourrelly, Les Algues deau Douce. Initiation à la Systématique. Tome I: Les Algues Vertes. Éditions N. Boubée & Cie. Paris. 1966. p. 511. [ Links ]
6. P. Bourrelly, Les Algues deau Douce. Initiation à la Systématique. Tome II: Les Algues Jaunes et Brunes. Chrysophycées, Phéophycées, Xanthophycées et Diatomées. Éditions N. Boubée & Cie. Paris, 1968. p. 438. [ Links ]
7. P. Bourrelly, Les Algues deau Douce. Initiation à la Systématique. Tome III: Les Algues Bleues et Rouges. Les Euglénoides, Peridinies et Cryptomonadines. Réimpr. rev. augm. (Boubée) Paris, 1985. p. 606. [ Links ]
8. C. Diercke, Weltatlas. 1974. Braunschweig. [ Links ]
9. H. Ettl, J. Gerloff, H. Heynig, D. Mollenhauer (Hrsg.). Süßwasserflora von Mitteleuropa.-bisher 1 Bände, (G. Fischer) Stuttgart. 1985. Begründet von A. Pascher. [ Links ]
10. H. Ettl, J. Gerloff, H. Heynig, D. Mollenhauer (Hrsg.). Band 1 Chrysophyceae und Haptophyceae. 1985. [ Links ]
11. H. Ettl, J. Gerloff, H. Heynig, D. Mollenhauer (Hrsg.). Band 2/1 Bacillariophyceae (Naviculaceae). 1997. [ Links ]
12. H. Ettl, J. Gerloff, H. Heynig, D. Mollenhauer (Hrsg.). Band 2/2 Bacillariophyceae (Epithemiaceae, Bacillariaceae, Surirellaceae). 1997. [ Links ]
13. H. Ettl, J. Gerloff, H. Heynig, D. Mollenhauer (Hrsg.). Band 2/3 Bacillariophyceae (Centrales, Fragilariaceae, Eunotiaceae). 1991. [ Links ]
14. H. Ettl, J. Gerloff, H. Heynig, D. Mollenhauer (Hrsg.). Band 2/4 Bacillariophyceae (Achnanthaceae. Kritische Ergänzungen zu Navicula (Lineolatae) und Gomphonema. Gesamtliteraturverzeichnis für Teil 1-4). 1991. [ Links ]
15. H. Ettl, J. Gerloff, H. Heynig, D. Mollenhauer (Hrsg.). Band 6 Dinophyceae (Dinoflagellida). 1990. [ Links ]
16. H. Ettl, J. Gerloff, H. Heynig, D. Mollenhauer (Hrsg.). Band 9 Chlorophyta I (Phytomonadina). 1983. [ Links ]
17. H. Ettl, J. Gerloff, H. Heynig, D. Mollenhauer (Hrsg.). Band 10 Chlorophyta II (Tetrasporales, Chlorococcales, Gloeodendrales). 1988. [ Links ]
18. H. Ettl, J. Gerloff, H. Heynig, D. Mollenhauer (Hrsg.). Band 14 Chlorophyta VI (Oedogoniophyceae: Oedogoniales). 1985. [ Links ]
19. H. Ettl, J. Gerloff, H. Heynig, D. Mollenhauer (Hrsg.). Band 16 Chlorophyta VIII (Conjugatophyceae I: Zygnemales). 1984. [ Links ]
20. R. H. Fleming, The Compositiong of Plankton and Units for Reporting Population and Production. Proceedings. En: 6th Pacific Scientific Congress California. N.º 9. 1940. pp. 535-40. [ Links ]
21. B. Fott, Studies in Phycology. E. Schweizerbart´sche Verlagsbuchhandlung (Nägele u. Obermiller). Stuttgart, 1969. p. 304. [ Links ]
22. G. Huber-Pestalozzi (Hrsg.). Das Phytoplankton des Süßwassers.-In: A.Thienemann, H.-J. Elster, W. Ohle, (Hrsg.): Die Binnengewässer, bisher 16 Teile, (Schweizerbart) Stuttgart. 1938. [ Links ]
23. G. Huber-Pestalozzi (Hrsg.). Band XVI, Teil 1. Allgemeiner Teil Blaualgen. Bakterien. Pilze. 1938. p. 341 [ Links ]
24. G. Huber-Pestalozzi, (Hrsg.). Band XVI, Teil 2, 1. Hälfte. Chrysophyceen. Farblose Flagellaten. Heterokonten. 2. Unveränderter Nachdruck.1976. p. 365. [ Links ]
25. G. Huber-Pestalozzi (Hrsg.). Band XVI, Teil 4. Euglenophyceen. und CXIV, Taf. 1955. p. 606. [ Links ]
26. G. Huber-Pestalozzi, (Hrsg.). Band XVI, Teil 5. Chlorophyceae (Grünalgen) Ordnung: Volvocales. CLVIII, Taf. 1961. p. 774. [ Links ]
27. G. Huber-Pestalozzi, (Hrsg.). Band XVI, Teil 7, 1. Hälfte. Von J. Komárek und B. Fott. Chlorophyceae (Grünalgen) Ordnung: Chlorococcales.1983. p. 1044. [ Links ]
28. W. Lampert, U. Sommer, Limnoökologie. Georg Thieme Verlag Stuttgart. 1993. p. 440 [ Links ]
29. W. Lampert,.Forum: Nutrient ratios. Editors comment. – En: Arch. Hydrobiol. N.º 146. 1999. [ Links ]
30. E. Mauch, Die Bestimmung des Phytoplanktons in Flüssen und Seen. Lauterbornia. Heft 29. 51 S. 5 Taf. Dinkelscherben. Deutschland, 1997. [ Links ]
31. OECD (Organization for Economic Cooperation and Development). Eutrophication of Waters. Monitoring, Assessment and Control. Final Report. OECD Cooperative Programme on Monitoring of Inland Waters (Eutrophication Control), Environmental Directorate, OECD, Paris, 1982. p. 154. [ Links ]
32. H. Pankow, Ostsee- Algenflora. 1. Auflage. Gustav Fischer Verlag Jena. 1990. [ Links ]
33. A. C. Redfield, On the Proportions of Organic Derivatives in Sea Water and their Relations to the Composition of Plankton. En: James Johnstone Memorial Volume. Liverpool, United Kingdom, 1934. pp. 177-192. [ Links ]
34. J. Ross, Prácticas de Ecología. Barcelona, 1979. Ediciones Omega. [ Links ]
35. J. Schwoerbel, Methoden der Hydrobiologie Süsswasserbiologie. Gustav Fisher Verlag Stuttgart. 1993. [ Links ]
36. O. Siebeck, Einführung in das Symposium in: Baggerseen und Naturschutz. Akademie für Naturschutz und Landschaftsplege, Lufen/Salzach. 1980. [ Links ]
*Autor de correspondencia. Teléfono: (97)+4+210 51 96, fax: +57+4+210 51 96, correo electrónico: naguirre@udea.edu.co (N. Aguirre)


