Serviços Personalizados
Journal
Artigo
Indicadores
-
 Citado por SciELO
 -
 Acessos
Links relacionados
-
 Citado por Google
 -
 Similares em
SciELO
 -
 Similares em Google
Compartilhar
Revista Facultad de Ingeniería Universidad de Antioquia
versão impressa ISSN 0120-6230versão On-line ISSN 2422-2844
Rev.fac.ing.univ. Antioquia n.55 Medellín set. 2010
Experimental analysis of the vibration on the draft tube of a Francis hydraulic turbine during operation at different power levels
Análisis experimental de la vibración en el tubo de aspiración de una turbina hidráulica Francis durante operación a diferentes niveles de potencia
Fernando Casanova García*, Carlos Alberto Mantilla Viveros
Universidad del Valle, Escuela de Ingeniería Mecánica, Calle 13 N.° 100-00, Edificio 351, Oficina 2007, Cali, Valle, Colombia.
Abstract
Severe vibrations are present on the draft tube of a 95 MW hydraulic turbine operating at partial load. Frequent failures on structural elements of the power plant are produced, due to the hydraulic instability inside the draft tube; mainly when the machine operates at partial load.
Pressure inside the draft tube and stress on the external draft tube wall were measured at several power levels to identify the power where the conditions are critical for the structure. Also, measurements were conducted at partial load with air injection over the stay vanes and pressure relief on the spiral case. It was found that air injection effectively reduced vibrations while the pressure relief on the spiral case did not produce any useful effect.
Keywords: power plant, vibrations, vortex, dynamic stress analysis
Resumen
En el tubo de aspiración de una turbina hidráulica de 95 MW operando a carga parcial se presentan fuertes vibraciones. Debido a la inestabilidad hidráulica dentro del tubo se presentan fallas frecuentes en elementos estructurales de la planta, principalmente cuando la máquina opera a carga parcial. En este trabajo se midieron las presiones dentro del tubo de aspiración y los esfuerzos en la pared externa del tubo de aspiración a varios niveles de potencia para identificar la potencia donde las condiciones son críticas para la estructura. También, se realizaron mediciones a carga parcial con inyección de aire sobre los alabes fijos y con alivio de presión en el caracol. Se encontró que la inyección de aire reduce efectivamente las vibraciones mientras que el alivio de presión en el caracol no produce ningún efecto útil.
Palabras clave: planta de potencia, vibraciones, vórtices, análisis dinámico de esfuerzos
Introduction
Francis turbines are used in many hydroelectric power plants to transmit energy stored in the water to a generator, which converts it into electrical energy. These turbines, when working at partial load, present pressure pulsations that are due to the Von Carman Vortex in the vanes and Vortex Rope in the draft tube [1,2]. These phenomena generate strong vibrations and noise that may lead to failures on the mechanical elements of the machine.
Currently, there is a trend to operate turbines in conditions far from their best efficiency point imposed by the variable demand on the energy market; therefore, it is important to determine the range of load where the turbine presents instability and seek ways of reducing this instability or adjusting the design so the structural elements can withstand the conditions at partial load.
Several methods have been proposed to decrease the vortex and the vibrations in these kinds of turbines. The main of said methods is air injection over the stay vanes [3], or air admission into the draft tube [1]. The literature [4] reported improvement in the stability of a 90 kW turbine model by using an active control with a rotating valve exciter. Other study [5] presented a method to decrease the vortex rope by using a jet issued from the crow tip. The method is evaluated with a numerical model of a turbine where the jet proved to be effective. Later, Susan-Resiga and colleages [6] presented the development of a test rig where an artificial vortex rope was generated. Experimental tests on the rig revealed that a jet injected axially at the conical diffuser inlet effectively suppresses vortex breakdown.
This paper presents results of field tests made on a hydroelectric power plant with three 95 MW Francis turbines; all evidencing strong vibration and noise that frequently lead to mechanical failures. The runner diameter is 3.8 m and has 13 blades.
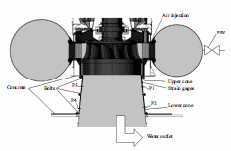
The draft tube on each unit is composed of two parts: the part near the turbine is formed by two uncovered cones made of a low-carbon steel wall 18 mm thick and the other part, which is far from the turbine, is embedded in concrete. The two uncovered cones are joined to each other by bolts and in the same manner are joined to an upper and a lower flange embedded in concrete. Between the lower cone and the lower flange, a segmented ring with wedge form in the cross section is assembled to compress the cone against the flanges and to guarantee fixation and sealing. A sketch of the assembly of the two cones is shown in figure 1.
Figure 1 Sketch of the non-embedded part of the draft tube
Most specifically, when this machine operates at powers between 50 and 65 MW, strong vibrations have been observed and these have frequently led to fracture of the upper bolts. In order to assess the influence of the power operation on the vibration and pressure fluctuations inside the draft tube, pressure at four points on the cone and stress over the upper cone wall were measured at several power levels. Moreover, the effect of air injection over the vanes, and the pressure relief in the spiral case were also evaluated. Pressure relief was performed by using the pressure relieve valve (PRV), which is currently used to prevent overpressure on the spiral case when the flow from the spiral case to the runner is suddenly stopped.
Experimental
In order to know the stress variations on the cone wall during plant operation, strains on the wall of the upper cone were measured by using an FCA- 3-11 TML strain gage rosette, which has three strain gages in three different directions. The rosette was aligned to allow reading the vertical, horizontal, and 45°-angle strain. With these three strains, stress was calculated by using the equations for plane stress conditions. Each arm of the rosette was connected in quarter bridge and registered with a Dynamic Strain Recorder, TML reference DC-104R.
Internal pressure was measured on four points: two on the upper cone and two on the lower aligned with the water outlet. In figure 1, the pressure sensors are labelled as P1, P2, P3, and P4. P1 corresponds to the pressure sensor located at the upper cone on the side over the water outlet. Pressure was measured by using PX305- 300 GI Omega pressure transducers with a range of 0-300 psi (0-2,066 kPa). Pressure signals were registered by using a NetDAQ 2645A Fluke data acquisition system.
The power plant has three units located in straight line in front of the dam. Measurements were conducted on the unit located in the center (unit two), because it evidenced the worst noise and vibration conditions.
Field tests were carried out in two phases. Phase one took place with units one and three turned off, and phase two was done while units one and three where working at 95 MW.
Prior to the tests, unit two was turned off and the water was removed from the tube. With the cone without water, the strain gages were installed and the zero strain condition for the strain gages and the pressure transducers was set.
Three tests were made for each phase: the first was conducted with power at 10, 20, 30, 40, 50, 55, 60, 65, 70, 80, 90, and 100 MW; in the second test, measurements were taken with power at 60 MW and by opening the PRV at 5, 10, 15 %; in the third test, measurements were done while the unit was working at 60 MW and air was injected on a single point over the runner blades. The air was taken from a storage tank where the air was compressed at 5.45 MPa.
During the test series, the headwater level was at 1,147.18 m with a 0.02 m variation. The tail water level began at 1,028.36 m and finished at 1,032.4 m. The density of the water in the test location was 994 kg/m3. The hydraulic head at the turbine was 115.27 ± 0.1, which was calculated by taking into count the head lost.
After the tests described above, measurements were taken while power on the unit was increased from 0 to 100 MW and again turned down to 0 MW.
Results and discussion
Pressure measurements
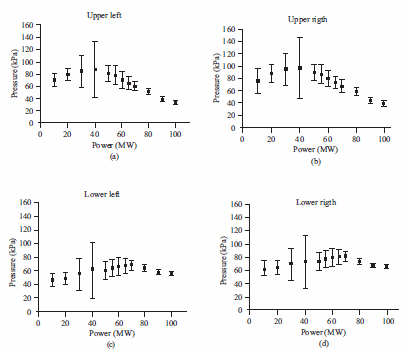
figure 2 shows the average pressure and its corresponding standard variation as a function of power for the tests conducted while units one and three were stopped. The maximum pressure fluctuation in the four positions was obtained at 40 MW. Note in the figure that for low powers, the pressure is higher on the upper positions and for power above 60 MW the pressure on the upper positions is lower. This means that at low power the pressure is mainly the dynamic component, which is higher in this condition due to the vortex. At power greater than 60 MW, the dynamic component decreases and the static component is important. Given that the static component is due to the water level; then, pressure is higher on the lower positions.
Figure 2 Pressure as a function of power. Units one and three stopped
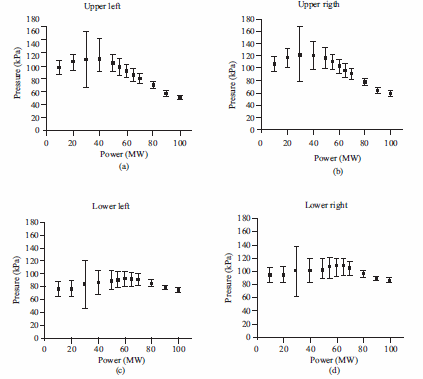
A slightly different behavior for pressure was found when units one and three were working at 95 MW, as seen in figure 3. Under this condition, in general, pressure was higher than when those units were stopped. Another difference is that the maximum pressure fluctuation was registered at 30 MW for the four points, rather than at 40 MW as in phase 1.
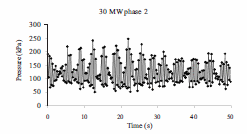
In all conditions tested, pressure was greater on the right side. From the conditions tested, the most critical was when the machine was working at 30 MW while units one and three were working at 95 MW. These results are shown in figure 4. By applying the Fast Fourier Transform to these data, frequencies were obtained of 0.29 and 2.2 Hz; both lower than the runner frequency (3 Hz). The amplitude was higher at 2.2 Hz than at 0.29 Hz. According to the literature [1, 7, 8], the vortex rope in the draft tube is the main contributor of these low-frequency pulsations; although 0.29 Hz corresponds to approximately 0.1 times the runner frequency, out of the range between 0.25 and 0.35 times the runner frequency mentioned by Escaler and colleages [7].
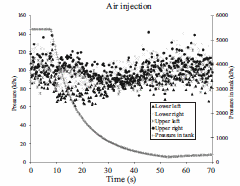
The opening of the PRV did not reveal any important effect on pressure. However, it was found that air injection considerably reduced the average and the fluctuation of pressure. figure 5 shows the pressure inside the cone and the pressure in the air storage tank. The beginning of the air injection is indicated by the decrease in the pressure of the air storage tank. In this figure, it can be seen that the average and the alternating pressure decrease while the air was injected. The vertical and horizontal lines in the figure indicate that the effect of air injection is important until when the pressure in the tank was 500 kPa. Up to that pressure, the average and the variation of the pressure was considerably decreased. For example, taking upper right pressure for the first 10 seconds, the average and the standard deviation were 106.1 and 12.25 kPa, respectively; whereas, for the time between the 30 and 40 seconds the average and standard deviation were 93 and 7.15 kPa, respectively. That means a reduction of 12% in the average pressure and 41% in the standard deviation of the pressure. Due to the lack of an air flow meter in the air injection system, air flow was calculated by using Van Der Waal's real gas equation [9] to calculate the air quantity inside the tank at 31 and 38 seconds (figure 5), knowing the tank volume (2.95 m3), and the temperature at those pressures (26 °C). Air flow was calculated as the difference between the air quantity at 31 seconds and at 38 seconds divided by 7 seconds. The air flow calculated was 0.207 m3/s. The water discharge in the turbine is 60.8 m3/s; therefore, there is a ratio between air discharge and water discharge of 0.34%. This air discharge effectively reduced the pressure pulsation even though it was lower than the ratio of 0.5% suggested in Ref. [1] as the ratio where the lowest amplitude is obtained. In fact, in figure 5, it can be noted that the lowest amplitude is between the 30th and 40th seconds, where the air flow was near that calculated above; but at times lower than 30 seconds, where the pressure is higher and, therefore, it is supposed that the air flow is higher, the pressure fluctuation is not as reduced as during the 30thand 40th seconds.
Figure 3 Pressure as a function of power on the four points measured when units one and three were working at 95 MW
Figure 4 Pressure fluctuation in the upper right point with unit two working at 30 MW and units one and three working at 95 MW
Figure 5 Pressure inside the cone and pressure in the air storage tank as a function of time during air injection
Stress on the wall
With the strain measured in the three directions, the stress was calculated by using the plane stress equations and the steel elastic properties: Young's Module 200 Gpa, and Poisson ratio 0.29.
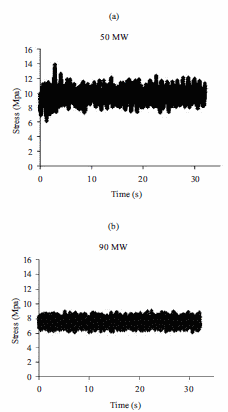
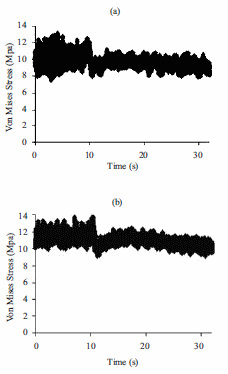
The influence of power on stress was clear. figure 6 shows the von Mises stress at powers of 50 and 90 MW, while units one and three were stopped (phase one). Clearly, at 50 MW (partial load), the average and the fluctuation of the stress are higher than those registered at 90 MW. At 50 MW the condition of the structure is critical because it can cause break of the draft tube connecting bolts as is shown elsewhere [10].
Figure 6 Von Mises stress (a) 50 MW (b) 90 MW
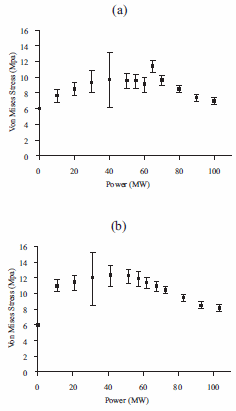
figure 7 shows the average von Mises stress as a function of power in the two conditions: with units one and three turned off (figure 7 a) and with those units working at 95 MW (figure 7 b). The standard deviation is shown for each average value. It is observed that, in general, the stress is higher when units one and three are working. The maximum fluctuation of the stress - when units one and three were stopped - was obtained at a power of 40 MW and - when those units were working - the maximum fluctuation was at 30 MW. A clear increase of the average and the fluctuation was observed at partial load, along with an important decrease of the average and almost no fluctuation of the stress for powers above 80 MW. The datum at 0 MW corresponds to the stress measured when the machine was stopped and after the draft tube was filled with water; hence, corresponding to the stress due to hydrostatic pressure.
Figure 7 Von Mises stress on the cone wall as a function of power (a) units one and three turned off (b) units one and three working at 95 MW
The average stress - with units one and three working - was higher than the stress with those units stopped. Similar behavior was found in the results of pressure inside the cone. Even though the average stress increases with units one and three working, the stress fluctuation holds practically the same. Thus, it can be said that the increase of average stress and pressure are due to the increase of hydrostatic pressure given the higher tail water when the other two units are working.
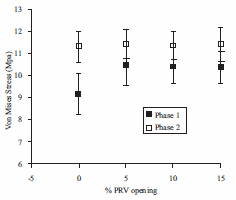
Figure 8 shows the von Mises stress in the cone wall as a function of the PRV opening at 60 MW power. It can be seen that the opening of this valve did not produce any beneficial effect on the stress. Even when units one and three were working, the opening of the PRV produced increase in the average stress. The increase in the average stress when the other two units were operating can also be observed in figure 8.
Figure 8 Von Mises stress as a function of the PRV opening under both conditions tested
Similar to the pressure inside the cone, the stress on the wall was reduced with air injection. Figure 9 a, shows the von Mises stress on the cone wall during air injection when unit two was operating alone. Figure 9 b shows the stress when the other two units were working at 95 MW. Both measurements were taken while unit two was operating at 60 MW. The stress amplitude decreased from values as high as 2.65 Mpa, without air injection, to values as low as 0.95 Mpa, with air injection.
Figure 9 Von Mises stress on the cone wall during air injection: (a) with units one and three stopped; (b) with units one and three operating at 95 MW
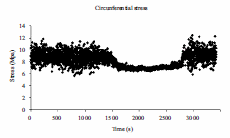
From the conditions tested, the most critical for the cone wall was when unit two was operating at 30 MW and units one and three were operating at 95 MW. Under those conditions, the average von Mises stress was 11.9 MPa and the amplitude stress was 8.2 MPa. Therein, the frequency of the stress was 2.21 Hz; similar to that found in the pressure fluctuation (2.2 Hz). The low frequency, found in the pressure, was not detected in the stress measurements. A 39 Hz frequency was found when the machine was working at high powers (90-100 MW) and when the power was increased from 0 to 100 MW and decreased again to 0 MW. The 39 Hz frequency matches exactly with the blade passing frequency (13 blades and 3 Hz runner frequency) and it is probably due to the von Karman vortex on the blades, which affects the tube wall. In this latter experiment, a clear decrease in the stress was found when the machine was at full load, as seen in figure 10.
Figure 10 Circumferential stress on the tube wall varying the power
Conclusions
A clear increase in the average and amplitude of the pressure inside the draft tube and the stress on the wall was found at partial load and the worst situation was between 30 and 50 MW, when units one and three were working at 95 MW. The vibration at that partial load has a low frequency and should be due to the vortex rope.
Air injection was an effective way to decrease pressure pulsation and wall stress. An air flow of the water discharge proved sufficient to improve the hydraulic stability.
Opening the PRV to release pressure on the spiral case did not produce any beneficial effect on vibrations at 60 MW.
References
1. Z. Qian, J. Yang, W. Huai. ''Numerical simulation and analysis of pressure pulsation in Francis hydraulic turbine with air admission''. Journal of Hydrodynamics. Ser. B. Vol. 19. 2007. pp. 467-472. [ Links ]
2. C. Nicolet, J. Arpe, F. Avellan. ''Identification and modelling of pressure fluctuations of a Francis turbine scale model at part load operation''. 22nd IAHR Symposium on Hydraulic Machinery and Systems. 2004. Stockholm (Sweden). pp. 1-14. [ Links ]
3. H. Gunter, J. C. Zanutto, W. Ponge-Ferreira. ''Hydraulic power plant machine dynamic diagnosis''. Shock and Vibration. Vol. 13. 2006. pp. 409-427. [ Links ]
4. G. Blommaert, J. E. Prenat, F. Avellan, A. Boyer. ''Active control of Francis turbine operation stability''. Proceedings of the 3rd ASME/JSME Joint Fluids Engineering Conference. 1999. San Francisco (CA). pp. 1-8. [ Links ]
5. R. Susan-Resiga, T.C. Vu, S. Muntean, G.D. Ciocan, B. Nennemann. ''Jet control of the draft tube vortex rope in Francis turbines at partial discharge''. 23rd IAHR Symposium. 2006. Yokohama (Japan). pp. 1-14. [ Links ]
6. R. Susan-Resiga, A. Bosioc, T. Milos, S. Bernad, S. Muntean, A. Stuparu, A. Baya, L.E. Antón. ''Swirling flow apparatus and test rig for flow control in hydraulic turbines discharge cone''. 2nd IAHR International Meeting of the Workgroup on Cavitation and DynamicProblems in Hydraulic Machinery and Systems. Timisora. Romania. 2007. pp. 24-26. [ Links ]
7. X. Escaler, E. Egusquiza, M. Farhat, F. Avellan, M. Coussirat. ''Detection of cavitation in hydraulic turbines''. Mechanical Systems and Signal Processing. Vol. 20. 2006. pp. 983-1007. [ Links ]
8. F. Wang, X. Li, J. Ma, M. Yang. ''Experimental investigation of characteristic frequency in ustteady hydraulic behavior of a large hydraulic turbine''. Journal of Hydrodynamics. Vol. 21. 2009. pp. 12-19. [ Links ]
9. Y. A. Cengel, M. A. Boles. ''Thermodynamics: An engineering Approach''. 4a ed. Ed. McGraw-Hill. New York. 2001. pp. 2.43-2.44. [ Links ]
10. F. Casanova, ''Failure analysis of the draft tube connecting bolts of a Francis-type hydroelectric power plant''. Engineering Failure Analysis. Vol. 16. 2009. pp. 2202-2208. [ Links ]
(Recibido el 21 de Marzo de 2009. Aceptado el 16 de abril de 2010)
1Autor de correspondencia: teléfono: + 57 + 2 + 321 22 62, correo electrónico: bando1271@yahoo.es (F. Casanova)


