Serviços Personalizados
Journal
Artigo
Indicadores
-
 Citado por SciELO
 -
 Acessos
Links relacionados
-
 Citado por Google
 -
 Similares em
SciELO
 -
 Similares em Google
Compartilhar
Revista Facultad de Ingeniería Universidad de Antioquia
versão impressa ISSN 0120-6230versão On-line ISSN 2422-2844
Rev.fac.ing.univ. Antioquia n.62 Medellín jan./mar. 2012
ARTÍCULO ORIGINAL
A method for estimating the position and direction of a leader of a set of moving objects
Un método para estimar la posición y la dirección del líder en un conjunto de objetos móviles
Francisco Javier Moreno Arboleda1*, John Freddy Duitama Muñoz2, Edison Camilo Ospina1
1Universidad Nacional de Colombia. Facultad de Minas. Carrera 80 No. 65223 Bloque M8A. Medellín, Colombia.
2Universidad de Antioquia. Facultad de Ingeniería. Calle 67 N.° 53-108 Bloque 21 Lab. 316. Medellín, Colombia.
*Autor de correspondencia: teléfono: + 57 + 4 + 425 5376, fax: + 57 + 4 + 425 5365, correo electrónico: fjmoreno@unal.edu.co (F. Moreno)
(Recibido el 25 de agosto de 2011. Aceptado el 27 de febrero de 2010)
Abstract
Movement patterns can be identified when studying a group of moving entities such as a group of people, a flock of birds, a school of fish, a convoy of vehicles, among others. In this paper, it is analyzed a pattern, known as leadership. Informally, this pattern is characterized by a moving entity called leader that motivates or represents the behavior of the group in order to reach a goal during a period. A formal method is proposed to estimate the position and the direction where a leader should be located and headed at a timepoint in order to lead a group. These estimations can also be useful to check the consistency of the data about a leadership pattern, and to estimate the missing information (position and direction) of a leader at a specific time, i.e., an imputation process. In order to show the expediency of the proposal, a series of experiments were implemented and conducted using Netlogo, a programmable modeling environment for simulating natural and social phenomena.
Keywords: Moving objects, movement patterns, flocks, leadership
Resumen
Patrones de movimiento pueden ser identificados cuando se estudia un grupo de entidades móviles, como un grupo de personas, una bandada de pájaros, un banco de peces, un convoy de vehículos, entre otros. En este artículo, se analiza un patrón, conocido como liderazgo. Informalmente, este patrón se caracteriza por una entidad móvil llamada líder que motiva o representa el comportamiento de un grupo con el fin de alcanzar un objetivo durante un período. Se propone un método formal para estimar la posición y la dirección donde un líder debería estar ubicado y orientado en un punto del tiempo con el fin de liderar un grupo. Estas estimaciones pueden también ser útiles para verificar la consistencia de los datos de un patrón de liderazgo y para estimar la información faltante (posición y dirección) de un líder en un tiempo específico, i.e., un proceso de imputación. Con el fin de mostrar la conveniencia de la propuesta, se implementó y se desarrolló una serie de experimentos mediante Netlogo, un entorno programable de modelado para la simulación de fenómenos naturales y sociales.
Palabras clave: Objetos móviles, patrones de movimiento, bandadas, liderazgo
Introduction
Movement patterns can be identified when studying a group of moving entities such as a flock of birds, a school of fish, a convoy of vehicles, among others [1, 2]. A pattern, known as leadership has been recognized in [3]. This pattern is characterized by a moving entity called leader that motivates or represents the behavior of the group in order to reach a goal during a period. A leadership pattern can be defined using some temporal constraints and a geometrical arrangement between the leader entity and the other entities in the group, called followers.
Given a group of moving entities and a timepoint t, a method is proposed to estimate the position and the direction where a leader should be located and headed at t in order to lead this group. This problem has been identified in a short oral communication [4]. The estimations are based on the leadership pattern definition proposed by Andersson [3].
The method may be applied to locate and destroy the leader of a troop in military operations [5] or in games such as Battlefield and Squad Leader, and to locate the lead robot for a dissociated trailing robot [6] or for an animal that fell behind in a flock.
Motivating problems
Problem 1: Finding a Position/Direction for a Leader
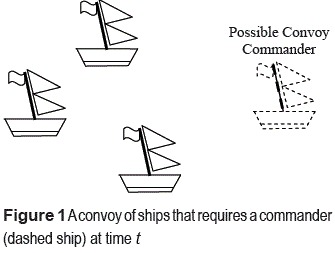
Consider a convoy of ships at a time t (figure 1). The position and direction of each ship is known at t. The idea is to determine the position and direction of a convoy commander at t to lead this group. Note that the position and direction of the commander must consider the current position and direction of each ship (follower) of the convoy, so that each follower can ''see'' (perceive) and follow the commander. Figure 1 shows a convoy of ships and the position of a possible leader (represented as a dashed ship).
Problem 2: Consistency Checking
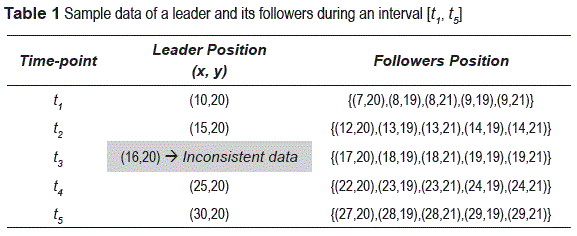
Suppose there are data related with the position and the direction of a leader entity and its followers during a leadership period (table 1). If the position and direction of the leader are constrained by the position and direction of its followers, the data can be checked in order to identify possible inconsistencies. For example, assume that a leader should always be in front of its followers. Therefore, the data at time t3 in table 1 would be wrong because these data indicate that the leader was behind of its followers. Once inconsistencies are identified, the goal is to try to correct them. Note that even in a small data sample (five records), the detection of this type of inconsistencies is not evident.
Problem 3: Leader's Data Imputation
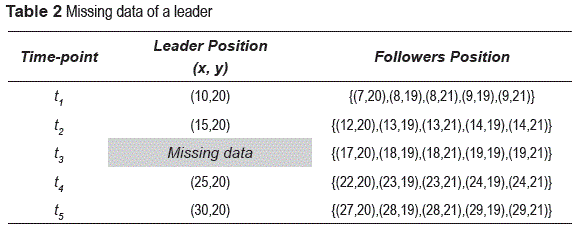
Consider again table 1 and suppose that the data for the leader position at time t3 is missing (table 2). Suppose that there was a leadership pattern during the interval [t1, t5]. In addition, the constraints of position and direction of the leader with regard to the position and direction of each of its followers are also known. The idea is to try to estimate missing data of the leader, i.e., to impute its values [7].
The original model
Next, the essential elements of Andersson's model [3] are presented. Consider a set E of n entities{e1, e2,..., en} moving in a space, usually a geographic region, during an interval [t1, tf]. This space is represented by the Euclidean plane. The time is represented in a continuous form. Tp denotes the infinite set of time-points: {t | t  [t1, tf]}. On the other hand, Ts denotes the discrete set of time-points {t1,t2 tf,..., tf}. Each ti
  Ts, represents a time-step and corresponds to the time-point in which the position (and possibly other data) of the moving entity was recorded. (ti-1, ti), ti
  Ts, i ≠1; represents a unit-time-interval. The size of (ti-1, ti) is equal to the size of (tj-1, tj), ∀ tj
  Ts, j ≠1.
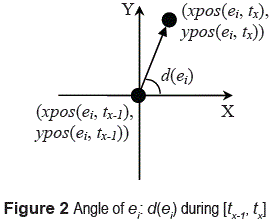
The coordinates of an entity at a time-point t are given by a pair of functions xpos and ypos, both with signature: E x Tp → Real. It is assumed that between two consecutive time-steps, the entity moves along a straight line and with constant velocity [3]. Let t be a time-point and tx  Ts, x ≠ 1; the angle of ei, denoted d(ei), at t is defined by the line segment that goes from (xpos(ei, tx-1), ypos(ei, tx-1)) to (xpos(ei, tx), ypos(ei, tx)), where tx-l < t < tx (figure 2). The angle d(ei) is between [0, 2π).
The front-region of an entity ei is a region associated with ei at a time-point t (t  Tp, t
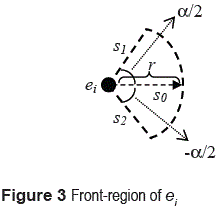
Tp, t  Ts) that represents the region of perception of the entity, e.g., its visual range. The front-region of ei is defined as follows: consider three line segments s0, s1<, and s2, each one of length r. Each segment has an endpoint in the position (xpos > (ei, t), ypos(ei, t)). The direction of the segment s0 is equal to the angle d(ei) at t. The segments s1 and s2 form angles of α/2 and -α/2 (α ≤ 2π) with regard to the segment s0, respectively. The circular sector (wedge-shaped region) of radius r, bounded by s1 and s2, forms the frontregion of ei at t and it is denoted front(ei) (figure 3).
An entity ej is in front of an entity ei, at a timepoint t (t  Tp, t
Tp, t  Ts), if ej is in the front-region of ei i.e., (xpos >(ej, t), ypos(ej, t)) is inside front(ei); this is written ej
  front(ei) and it is said that ei follows ej (ei is a follower of ej) at t. An additional requirement to state that ei follows ej can be enforced: let β
  [0, π], the entity ei follows ej at t if i) ej
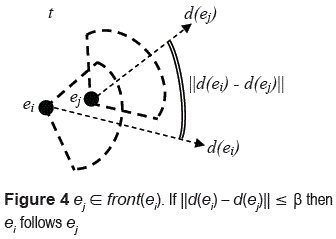
  front (ei) at t and ii) || d(ei)- d(ej)|| ≤ β, where d(ei) and d(ej) are the directions of ei and ej at t (figure 4). An entity ei follows an entity ej during an interval [ta, tb], ta and tb timepoints, if and only if ei follows ej at t, ∀t
  [ta, tb], t
  Ts. Note that, if ei follows ej at t, where t is a time-point between two consecutive time-steps, i.e., tx-l < t < tx (t
  Ts, x ≠ 1) then it holds that ei follows ej during any time-point in (tx-1, tx)and; therefore, during any subinterval of (tx-1, tx).
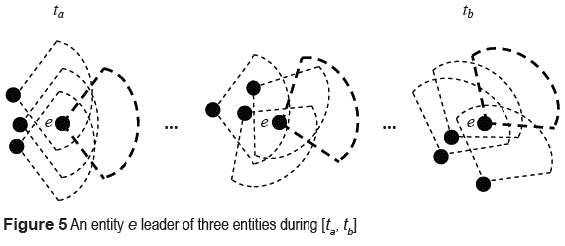
Finally, the concepts of leader and leadership pattern are presented. An entity ei is a leader during an interval I = [ta, tb] if: i) ei does not follow any entity during I and ii) ei is followed by a number m of entities at each time-point of I. There is a leadership pattern if ei has at least m followers at each time-point of I and the size of I is at least k unit-time-intervals. Figure 5 shows an entity e leader of three entities during an interval [ta, tb].
Estimating the position and direction of a leader
Estimation of the leader position
Let (xpos(eleader, t ), ypos(eleader, t)) be the position of a leader entity eleader at the time t with regard to a group of followers F. Because each entity ei  F must be a follower of eleader then eleader
  front(ei) ∀ei
  F. That is , the position of eleader at t must be contained in the front region of each ei
  F: (xpos(eleader, t), ypos(eleader, t))
  front(ei), ∀ ei
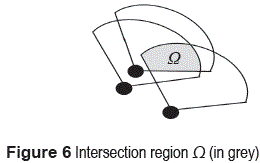
  F. Therefore, if eleader is a leader at t for the entities in F then eleader must be located in a region Ω, i.e., the intersection of the front regions of each entity in F: (xpos(eleader, t ), ypos(eleader, t))
  Ω (figure 6).
Using the associative property of the intersection operator (n-fold intersection) [8], the region Ω for n entities can be expressed as:

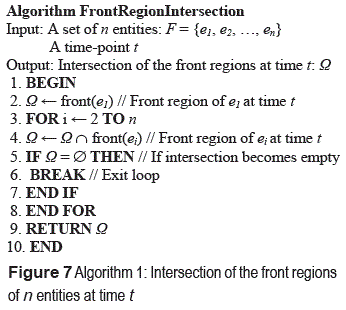
Note that if Ω= Ø then it is not possible to find a position for a leader with regard to the set of entities in F. In figure 7, an algorithm is presented to find the intersection Ω of the front regions of n entities at time t. The order of the algorithm is O(n). The center of mass of Ω can be an estimation for the position of eleader.
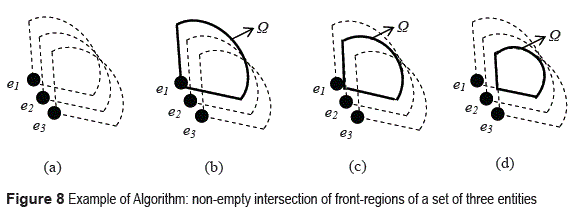
Example 1 Consider a set of three entities with their respective front regions at time t as shown in figure 8a. In line 2, the Algorithm 1 takes front(e1) as the intersection region Ω as is shown in figure 8b (bold shape). Next, the following steps are performed: 1) It is found the intersection between Ω and front(e1) at t (figure 8b). 2) It is found the intersection between Ω and front(e3) at t (figure 8c). 3) Loop finishes and Ω is returned (bold shape in figure 8d).
Estimation of the direction of a leader
In addition to estimate the position where a leader must be located at time t with regard to a set of followers, the challenge is also to estimate its direction considering the constraints presented (figure 4).
Let d(eleader) the direction of an entity eleader at time t. If an entity ei  F is a follower of eleader then ‖d(ei) - d(eleader)‖ ≤ β . This condition can be written as d(eleader)
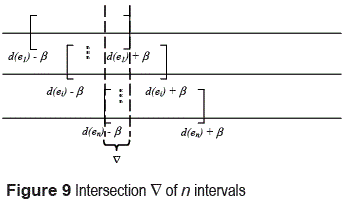
  [ d(ei) - β, d(ei) +β]. That is, if eleader is a leader at time t for the set of entities in F then the direction of eleader must be included in the interval defined by each entity in F. This is an analogous problem to the one where the position for eleader was estimated. Therefore, d(eleader) must be included in the intersection
  of the intervals defined by the entities in F (figure 9): the value of d(eleader) must be included in the interval delimited between the dashed lines.
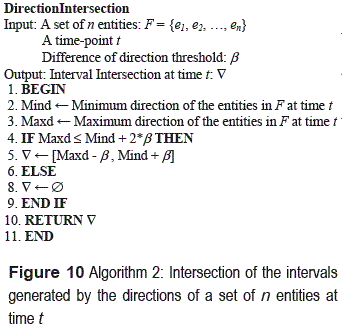
Let Mind and Maxd be the minimum and the maximum of the directions of the entities in F, respectively.  is a non-empty interval if the intersection between the intervals defined by Mind and Maxd is not empty. That is, if Maxd – β ≤ Mind + β. Therefore, the intersection of these intervals is non-empty if Maxd ≤ Mind + 2β, giving rise to an intersection interval
  : [Maxd - β , Mind + β]. Similarly to the problem of the intersection of front regions, if Maxd > Mind + 2β then it is not possible to find a direction for a leader with regard to the set of entities in F. In figure 10 an algorithm is presented to find the intersection of the intervals of n entities at a timepoint t. The order of this algorithm is also O(n). An estimation for the direction of eleader is the midpoint of the intersection interval
  : d(eleader) = (Maxd - β + Mind + β)/2 = (Maxd + Mind)/2.
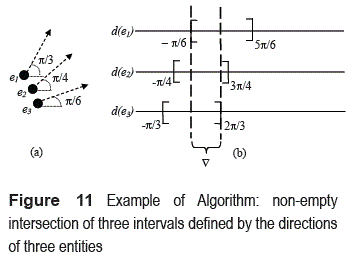
Example 3 Consider a set of three entities with their respective directions (figure 11a). Suppose that the leader must maintain a difference of direction with regard to its followers equal to β = π/2. Therefore, the intervals defined by the directions of e1, e2, and e3 are d(e1) = π/3 then [π/3 - π/2, π/3 + π/2] = [-π/6, 5π/6]; d(e2)= π/4 then [π/4 - π/2, π/4 + π/2] = [-π/4, 3π/4]; d(e3)= π/6 then [π/6 - π/2, π/6 + π/2] = [-π/3, 2π/3].
Because Mind = π/6 and Maxd = π/3 then π/3 ≤ π/6 + 2(π/2); therefore, the intersection interval  is [-π/6, 2π/3] (figure 11b).
Experiments
To show the expediency of the proposal, the algorithms were implemented and a set of experiments on various data sets were conducted. The algorithms were implemented using Oracle Spatial features [9].
On the other hand, the obtention of real data for the experiments was difficult. Therefore, the data collection was simulated using the flocking model built in the Netlogo Library [10]; an approach that has been followed in previous works [3, 11, 12].
This flocking model is based on three rules: alignment, which establishes the tendency of an entity to turn in the same direction that its nearby entities; separation, which express that an entity will turn to avoid another entity which is getting too close, and cohesion, which means that an entity will move towards its nearby entities. The Netlogo simulation module also defines additional parameters to influence the behavior of the entities. Some of them are vision which represents the radius r of vision of an entity, minimum-separation which establishes the minimum distance between two entities in the space, and three turn-angles defined by max-align-turn, max-cohere-turn, and max-separate-turn to control the maximum angle that an entity can turn.
Appropriate modifications were incorporated to Netlogo in order to detect leadership patterns, e.g., parameters such as β, α, and min-num-followers (which represents the minimum number of followers to consider an entity as a leader of a group during a period) were included.
To evaluate the algorithms FrontRegionInter-section and DirectionIntersection the following approach was applied: for each leadership pattern that was found, the algorithms were applied to estimate the position and direction of the leader at a specific time-point; then, these results were compared with the simulated ones.
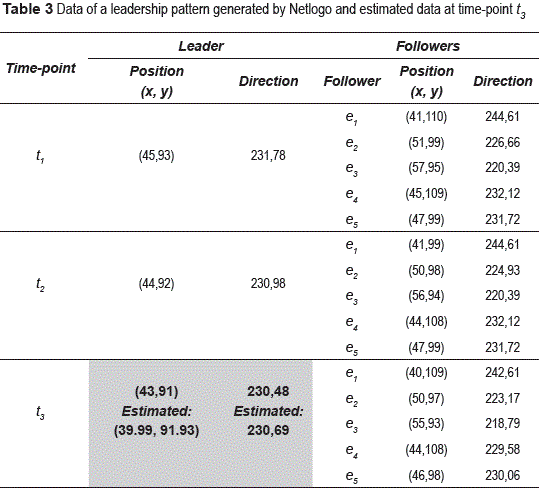
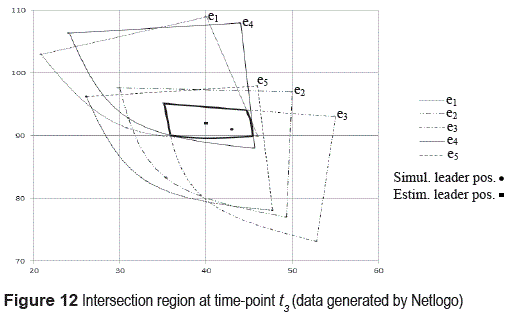
Table 3 shows an example: min-num-followers was set to 5 during [t1 ,t3], and the data of a leader at t3 were estimated. To compare the simulated results with the calculated ones, the following actions were considered: i) positions were compared using the distance between two points. For example, the distance between the simulated position (43, 91) and the estimated position (39.99, 91.93) was 3.1, and ii) directions were compared using the absolute value of the difference between the simulated angle and the calculated one. For example, the difference between 230.69 and 230.48 was 0.23 degrees. Figure 12 shows the intersection region at t3.
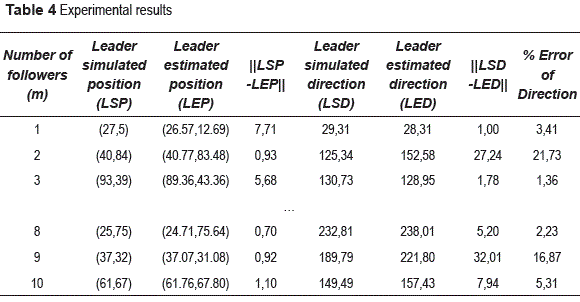
The experiments were conducted with different numbers of followers (0 < m < 11), β = π/2, r = 20, α= π/2, and minimum-separation = 3. The max-align-turn, max-cohere-turn, and max-separate-turn, angles were set to 5, 3 and 1.5 degrees, respectively. Table 4 shows a partial version of the results.
Table 4 shows how the number of followers affected the estimation of the position and direction of the leader entity. The results showed a better estimation of both parameters when the number of followers increases. This is reasonable because the more followers there are, the greater the number of regions to intersect and Ω tends to be smaller.
On the other hand, the estimation of the direction did not show in some cases a ''good'' estimation due possibly to the early alignment of the entities. That is, in the first time-steps, when some estimations were done, the entities just begin to align and  tends to be wider. Even so, the differences between the simulated and calculated data were ''small''.
Conclusions and future work
Based on the leadership pattern proposed by Andersson [3], a formal method was proposed to estimate the position and the direction for the leader of a group of entities at a time-point t. The estimations can help to check data consistency, to estimate missing information (an imputation process) or, simply, to determine where to place and head an entity which is intended to lead the group.
The experiments showed the expediency of the algorithms. Although more extensive experiments are needed, the results suggested that as the number of followers increase, the distance between the estimated and simulated position decreases. With regard to the estimation of the direction, the experiments did not show an analogous behavior; even though most of the times the estimations were very close to the simulated ones.
Next, some directions for future work are considered. To propose alternative methods for estimating the position and the direction of a leader and compare them with the current method. Another interesting issue is to conduct experiments to analyze the effect of parameters such as r, β, and α, that were kept constant here. Experiments with real data are also a must as well as its comparison with Netlogo simulations.
Finally, in most of the flocking systems, followers usually need to know which members are their leaders. However, other approaches [13-15] have analyzed the behaviour of a leader in flocking systems where the followers (or some of them) do not know which entity is the leader.
Acknowledgements
This paper is a partial result of the project ''Optimización de Sistemas de Conocimiento en Ingeniería'', convocatoria nacional para el fortalecimiento de los grupos de investigación y creación artística de la Universidad Nacional de Colombia, 2011-2012
References
1. S. Dodge, R. Weibel, A. Lautenschuz. ''Towards a Taxonomy of Movement Patterns''. Information Visualization. Vol. 7. 2008. pp. 240-252. [ Links ]
2. M. Benkert, J. Gudmundsson, F. Hübner, T. Wolle. ''Reporting Flock Patterns''. Lecture Notes in Computer Science. Vol. 4168. 2006. pp. 660-671. [ Links ]
3. M. Andersson, J. Gudmundsson, P. Laube, T. Wolle. Reporting Leadership Patterns Among Trajectories. SAC: Symposium on Applied Computing. New York (USA). 2007. pp. 3-7. [ Links ]
4. F. Moreno, E. Ospina.''On Estimating the Position and Direction of a Leader of a Group of Entities''. Mathematical Modelling in Engineering & Human Behaviour. Oral communication. Valencia. 2011. pp. 1-2. [ Links ]
5. L. Saul. Convoy Leader Training: Tactics, Techniques and Procedures. Center for Army Lessons Learned (CALL) Handbook. U.S. Army. 2003. pp. 1-81. [ Links ]
6. N. Farrington, H. Nguyen, N. Pezeshkian. Intelligent Behaviors for a Convoy of Indoor Mobile Robots Operating in Unknown Environments. SPIE: Mobile Robots XVII. Philadelphia. 2004. pp. 26-28. [ Links ]
7. A. Farhangfar, L. Kurgan, W. Pedrycks. ''A Novel Framework for Imputation of Missing Values in Databases''. IEEE Transactions on Systems Man and Cybernetics. Vol. 37. 2007. pp. 692-709. [ Links ]
8. M. Ian, D. Hoey. Geometric Intersection Problems. FOCS: Annual Symposium on Foundations of Computer Science. Houston. 1976. pp. 208-215. [ Links ]
9. C. Murray. Oracle Spatial. User's Guide and Reference 10g. Release 2 (10.2). Ed. Oracle. 2006. pp. 29-46. [ Links ]
10. U. Wilensky. NetLogo Flocking Model. Center for Connected Learning and Computer-Based Modeling' Northwestern University. Disponile en: http://ccl.northwestern.edu/netlogo/models/Flocking. Cosultado en Febrero 5 de 2011. [ Links ]
11. S. Momen B. Amavasai' N. Siddique. Mixed Species Flocking for Heterogeneous Robotic Swarms. IEEE Eurocon: The International Conference on Computer as a Tool. Warsaw. 2007. pp. 2329 - 2336. [ Links ]
12. F. Stonedahl, U. Wilensky. Finding Forms of Flocking: Evolutionary Search in ABM Parameter-Spaces. AAMAS: International Conference on Autonomous Agents and Multi-Agent Systems. Toronto. 2011. pp. 61-75. [ Links ]
13. W. Zongyao, G. Dongbing. Distributed Cohesion Control for Leader-follower Flocking. FUZZ-IEEE: IEEE International Conference on Fuzzy Systems. London. 2007. pp. 23-26. [ Links ]
14. S. Housheng, W. Xiaofan, L. Zongli. Flocking of Multi- agents with a Virtual Leader Part I: With a Minority of Informed Agents. IEEE Conference on Decision and Control. New Orleans. 2007. pp. 2937-2942. [ Links ]
15. H. Su, G. Chen, X. Wang, Z. Lin. Adaptive Flocking with a Virtual Leader of Multiple Agents Governed by Nonlinear Dynamics. CCC: Chinese Control Conference. Beijing. 2010. pp. 29-31. [ Links ]


