Serviços Personalizados
Journal
Artigo
Indicadores
-
 Citado por SciELO
 -
 Acessos
Links relacionados
-
 Citado por Google
 -
 Similares em
SciELO
 -
 Similares em Google
Compartilhar
Revista Facultad de Ingeniería Universidad de Antioquia
versão impressa ISSN 0120-6230
Rev.fac.ing.univ. Antioquia no.66 Medellín jan./mar. 2013
ARTÍCULO ORIGINAL
Long term performance of existing asphalt concrete pavement sections
Desempeño a largo plazo de secciones de pavimentos existentes de concreto asfáltico
Shad M. Sargand1. Carlos A. Vega-Posada2*. Luis G. Arboleda-Monsalve3
1Ohio Research Institute for Transportation and Environment, Ohio Univ., Athens, OH 45701.
2Facultad de Ingeniería, Universidad de Antioquia, Calle 67 N.° 53-108. Medellín, Colombia.
*Autor de correspondencia: teléfono: + 57 + (4) + 219 85 70, correo electrónico: cvega@udea.edu.co. (C Vega)
3Dept. of Civil and Environmental Engineering, Northwestern Univ., Evanston, IL 60208.
(Recibido el 21 de agosto de 2012. Aceptado el 18 enero de 2013)
Abstract
Highway pavements are designed to withstand the projected traffic loads while providing a high quality level of service. The large loads that pavements experience during the design life in conjunction with variable climate and moisture conditions accelerate the deterioration process and might cause premature failure of the pavements. In this research, a forensic study to assess the current performance of several asphalt concrete (AC) pavements is conducted. The structural condition of the AC sections, located in the State of Ohio, United States, was determined by means of the Falling Weight Deflectometer (FWD) testing method. The evaluation and interpretation of the FWD tests permit the assessment of potential short or medium-term rehabilitation projects. The methodology of analysis and data interpretation presented in this paper for the case of 110 km of asphalt concrete pavement in the State of Ohio, stands as a valuable technique in Colombia to determine, with actual field measurements, the condition and potential rehabilitation of the infrastructure system that is required to guarantee the sustainable economic development of the country.
Keywords: Pavement, rehabilitation, flexible pavements, testing methods, field tests, pavement rating, falling weight deflectometer
Resumen
Los pavimentos de carreteras están diseñados para soportar las cargas proyectadas del tráfico y a la vez proporcionar alta calidad para los niveles de servicio. Las grandes cargas que los pavimentos experimentan durante su existencia en conjunto con las condiciones variables de clima y humedad aceleran el proceso de deterioro y podrían causar fallas prematuras a los pavimentos. En esta investigación se realiza un estudio de patología para evaluar el desempeño actual de varios concretos asfalticos. La condición estructural de secciones de concreto asfaltico, localizados en el Estado de Ohio, Estados Unidos, se realizan por medio del método de ensayo del Deflectómetro de Impacto (FWD). La interpretación de los ensayos con FWD permite la evaluación de potenciales rehabilitaciones a corto y mediano plazo. La metodología de análisis e interpretación de resultados presentados en este artículo para el caso de los 110 km de pavimento de concreto asfaltico en el Estado de Ohio, se muestra como una técnica valiosa en el caso colombiano para determinar, con mediciones reales de campo, la condición y potencial rehabilitación del sistema de infraestructura que se requiere para garantizar el desarrollo económico sostenible del país.
Palabras clave: Pavimentos, rehabilitación, pavimentos flexibles, métodos de ensayo, ensayos de campo, evaluación de pavimentos, refractómetro de impacto
Introduction
Highway pavements are designed to withstand the measured and projected traffic loads while providing a high quality level of service during their expected design life. However, actual traffic loads imposed on the pavement may exceed the projected design loads. These increased loads result in pavements that are subjected to higher stresses and strains, accelerating the deterioration process, and thereby causing a premature failure of the pavements. Due to the quality of the material and assumptions, a pavement performance may exceed, meet or fall short of expectations. Flexible pavements are designed to allow layer deformations under traffic loads. The main structural body of flexible pavements consists of three layers resting on the soil structure; each layer is designed with different criteria depending on its mechanic properties and stresses. The entire pavement system is designed to efficiently support the stresses and strains generated by the traffic and environmental loads during its design period. For flexible pavements, the maximum stresses due to the induced load occur on the top of the asphalt layer and then decrease as the pavement depth increases because the load is distributed in a larger area, thereby decreasing the demands of the base and subbase layers [1].
In recent decades, scientists have begun to focus on pavement performance in order to improve its service life or performance. Several researchers have focused on depicting the behavior of pavements in order to explain deviations in the actual and predicted behavior. However, the forensic investigation of pavements is a complex subject that requires a thorough investigation of each variable which influences pavement performance. There are several variables that influence pavement performance such as pavement type, base and subgrade material properties, traffic loads, climate conditions, asphalt content, viscosity, permeability, aggregate type, gradation, thermal and moisture gradients, among others.
Researchers have been conducting forensic investigations for several years to determine the origin of distress mechanisms in pavements. These investigations are expensive due to the traffic control requirements, sophisticated equipment needs, staff mobilization, and field and laboratory experiments [2]. From the variety of distress mechanisms developed on the flexible pavement surface, rutting distress mechanisms have drawn researcher's attention for several decades. Rutting can be produced by the failure of any of the pavement layers (e.g., subgrade, subbase layer, base layer, or asphalt layer) and the extent of rutting highly dependent on the season. For example, the asphalt layer is more vulnerable to rutting in hot summer weather because the asphalt mix becomes weaker with high temperatures, allowing the asphalt layer to deform permanently or accumulate surface deformation under normal traffic loads [3]. On the other hand, the base is more vulnerable during wet spring weather than in other seasons [3, 4].
In order to develop useful equations to analyze the asphalt concrete pavement performance several assumptions must be made. One of the assumptions is that pavement performs linearly under loads; however, it has been determined from field and laboratory experiments that pavement layers do not perform linearly and elastically [5]. This is especially true for the asphalt concrete layer because of its viscous composition. This viscous behavior can be noticed on the surface pavement with rutting distresses; the accumulation of pavement deformation is an indication of the visco-elastoplastic property of asphalt pavements. A visco-elastoplastic method to determine the pavement performance considering the temperature, duration and magnitude of the load, and pavement thickness was presented in [5].
In an effort to collect reliable and consistent data that can lead to a better understanding ofpavement performance, some road sections in the State of Ohio have been partially instrumented with different types of devices such as environment sensors, linear variable differential transformers (LVDT), strain gauges, rosettes, etc. [6-12]. The collected data has been used in combination with nondestructive and laboratory tests to assess the pavement performance under existing traffic and climate conditions. In this ongoing project, they have found that AC pavements with normalized deflections > 8.6 mm/MN (1.50 mils/kip) have performed poorly; meanwhile pavements with normalized deflections < 5.7 mm/MN (1.0 mils/ kip) have shown a good performance.
In this research, a forensic study to assess the current performance of several roads located in the State of Ohio was conducted. The performance for the selected pavements was classified into two groups; pavements with excellent performance and pavements with average performance. Pavements with excellent performance are those which are exceeding design expectations or exhibiting little distress even after the service life period. On the other hand, average pavements are those which have required minimal maintenance or exhibited moderate distress prior to the end of the pavements service life. The Falling Weight Deflectometer (FWD) test was used to evaluate the pavement structural condition and to back- calculate the modulus of elasticity for each of the pavement layers at every location.
Field testing and sites description
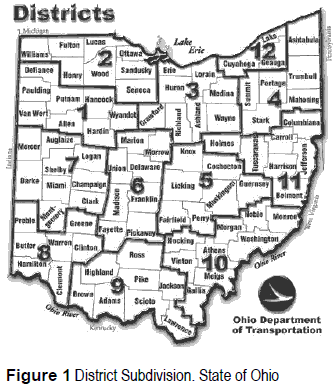
The Ohio Department of Transportation (ODOT) is in charge of the planning, designing, monitoring and maintenance of the roadways located in the State of Ohio. In order to facilitate these responsibilities, ODOT had divided the State into twelve districts as shown in figure 1. The current structural condition of nineteen asphalt concrete sections distributed along the state was investigated. These sections were grouped into fourteen sections according to the district location.
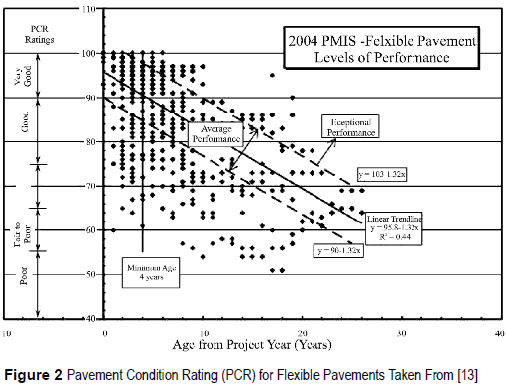
Figure 2 shows the Pavement Condition Rating (PCR) performance data for flexible pavements in the State of Ohio [13]. The selected sections and performance classification presented in the present study were a subset of data of those used to define the PCR chart in the State of Ohio. The PCR index describes the pavement distress mechanisms in terms of severity and frequency and is calculated as:

Where: n is the number of observable distresses and deduct is equal to the product of weight for distress, weight for severity and weight for extend. The pavement condition rating is measured on a scale from 0 to 100, zero being a pavement in poor condition and "100" indicating very good condition.
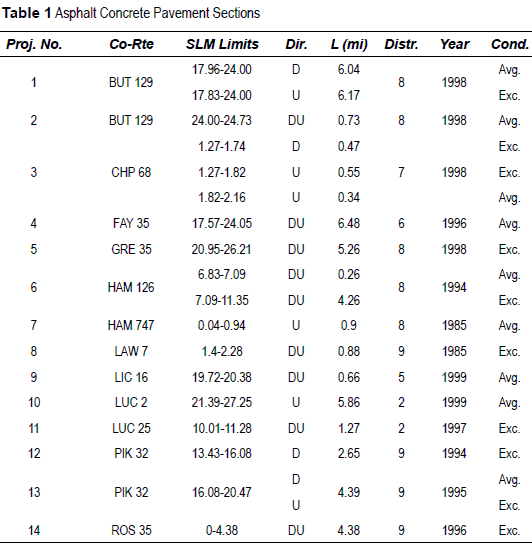
Table 1 shows the location, length, district, county, roadway and district locations are and initial condition of the asphalt concrete referred as "Co-Rte" and "Distr." respectively. (AC) pavement sections. In table 1, the The directions are referred as upstation (U), downstation (D) or with the dual index (DU) for the cases when the section is tested in both directions. The year refers to the construction date. The condition refers to the initial performance condition of the section as giving by the PCR index.
Testing equipment
A Falling Weight Deflectometer (FWD) equipment was used to assess the current structural pavement condition. The FWD applies a dynamic load on the pavement surface by dropping a weight that is transmitted through a circular loading plate. Such dynamic load simulates the effect of a wheel load on the pavement surface by generating temporally pavement deformations, which are recorded by sensors located radially at 2.5 m from the point of application of the load.
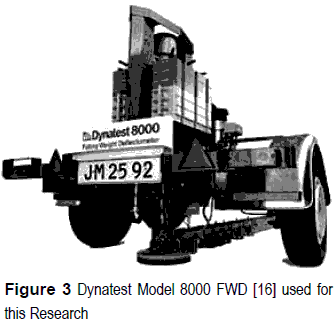
The magnitude of the impulse load transmitted by the FWD device to the pavement can vary from 30 kN to 250 kN by varying the weight and drop height [14]. The FWD testing method is widely used because is easy to implement, reliable, and cost-effective with respect to other methods [15]. Figure 3 shows the FWD model used in this research project and consists of seven sensors that measure and record deflections, in which the last two (sixth and seventh) are used to estimate the stiffness of the subgrade [16].
Data interpretation
The modulus of elasticity of the subgrade was back-calculated using the area value approximation presented in [17]. The normalized area value can be obtained as:

Where: D0, D300, D600, and D900, are the deflections at the center of the load, at 300 mm, at 600 mm, and at 900 mm from the point of application, respectively.
The following pavement condition can be inferred from the normalized area values: i) low area value and low maximum deflection, the pavement structure is considered weak while the subgrade is strong; ii) low area value and high maximum deflection, the pavement structure and the subgrade are considered weak; iii) high area value and low maximum deflection, the pavement structure and the subgrade are considered strong; and iv) high area value and a high maximum deflection, the pavement structure is considered strong while the subgrade is weak.
The equations to calculate the modulus of elasticity of the subgrade are presented in [17]. Using the deflection recorded from sensor six, which is located at 610 mm from the loading plate, the modulus of elasticity (calibrated in U.S. units) is:

Using the deflection recorded from sensor seven, which is located at 915 mm from the loading plate, the expression for the modulus of elasticity (calibrated in U.S. units) is:

Where: d24 and d36 must be given in microinches (μ-in.)
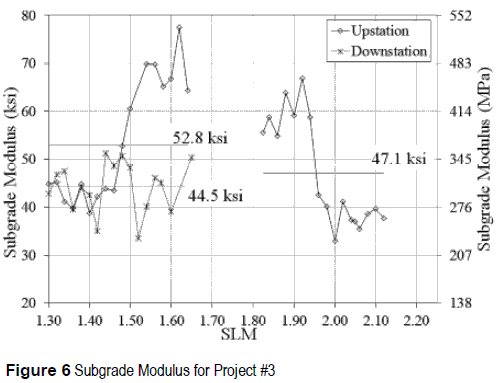
The modulus of elasticity of the subgrade reported in this publication was obtained by taking an average of the value obtained from both sensors (six and seven, Eqs. (3-4)). It is common practice to normalize the recorded deflections from the FWD tests with respect to the applied load in order to have a standardized comparison between deflections obtained using different loads. The normalized deflections for each geophone are given in [18], calibrated in U.S units, as follows:

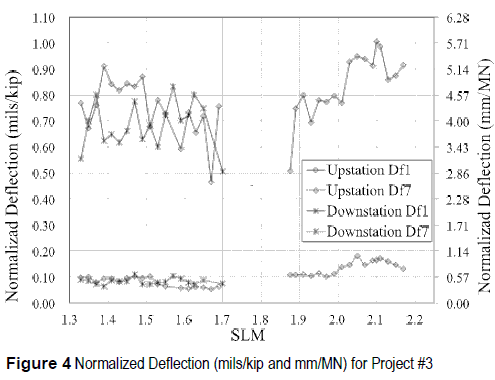
Where: Dfi represents the geophone reading (i = 1,2,...7) and the load was normalized to 9000 lb (40 kN). The normalized deflection of geophones 1 and 7 provides an indication of the structural condition, at the time of testing, of the asphalt concrete layer and the soil subgrade respectively.
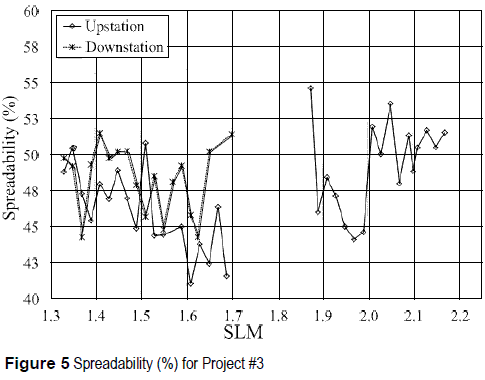
An additional representative parameter involved in the pavement performance is the spreadability (SPR). Spreadability parameter assists in estimating the bending stiffness of pavements and is given in [18] as follows:

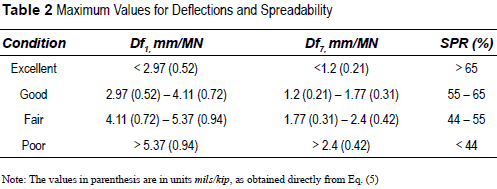
Where: Dfi is the reading of the geophone 1 which is located at the center of the loading plate. A high value of SPR indicates low stress and strains acting on the subgrade. Tabla 2 shows the deflections and spreadability ranges typically used to classify the pavement condition based on FWD recorded data as proposed in [19]. Those ranges are used in this publication to determine pavement condition of the proposed sections.
Pavement responses
The normalized deflections for sensors 1 and 7 (Df1 and Df7), spreadability, and the subgrade modulus of elasticity for the AC pavement sections were determined using FWD tests. For an easy reference, a typical set of plots for project # 3 are shown in figures 4, 5 and 6 [20]. For this case in particular, the structural condition of the asphalt concrete layer can be classified as fair in the upstation direction and good in the downstation direction whereas the subgrade structural condition can be classified as excellent in both directions. In general, the pavement ability to distribute the applied load can be classified as fair, indicating a deficiency in the stiffness of the base or subbase layers. The average modulus of elasticity of the subgrade was determined as 44.5 ksi (307 MPa). 52.8 ksi (364 MPa). and 47.1 ksi (325 MPa) for station limits (SLM) 1.27-1.74 (downstation). SLM 1.27-1.82 (upstation). and SLM 1.82-2.16 (upstation). respectively.
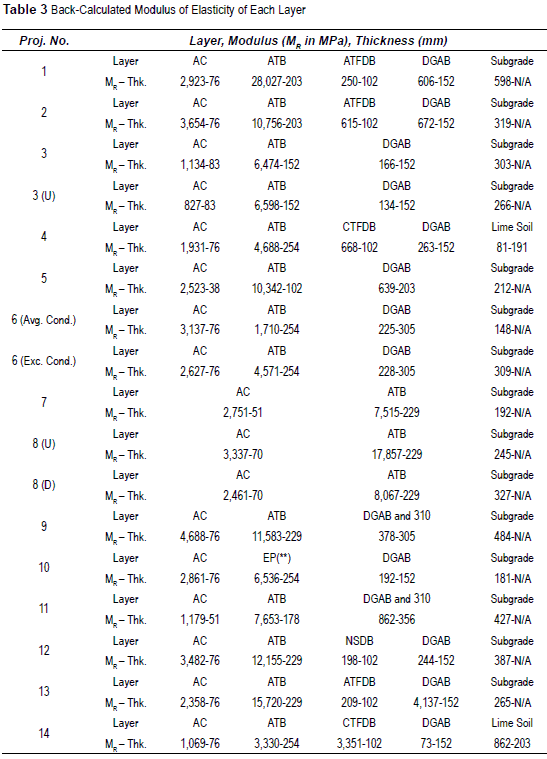
Table 3 presents the pavement built-up of each project. The columns from left to right (being the leftmost column the corresponding to the shallowest layer) represent the thickness, material specification, and back-calculated modulus of elasticity of each pavement layer. The following abbreviations are used for the material specification: i) AC: Asphalt Concrete; ii) ATB: Asphalt Treated Base; iii) DGAB Dense Graded Aggregate Base; iv) CTFDB Cement Treated Free Draining Base; v) PATB Permeable Asphalt Treated Base; vi) ATFDB Asphalt Treated Free Draining Base; and "310" Bituminous Aggregate Base. An extensive definition of the material specifications can be found in [21].
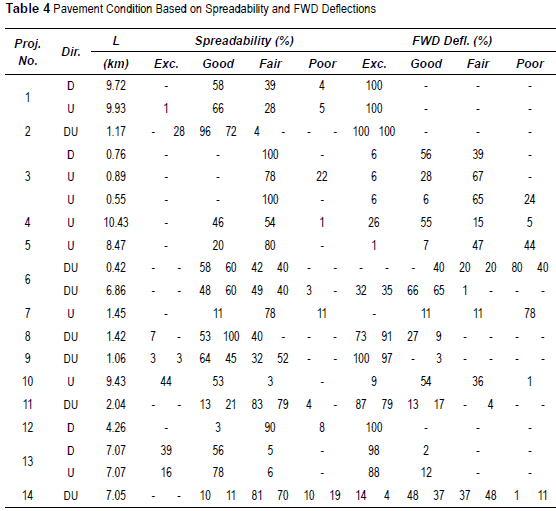
Table 4 summarizes the pavement condition based on spreadability and FWD deflections. The results from both criteria can be evaluated together to assess the actual pavement structural condition and the need of a short-term or medium- term rehabilitation.
Summary and conclusions
The long term performance of nineteen asphalt concrete pavement sections located in the State of Ohio was studied. The pavement performance is highly influenced by factors such as climate conditions, material properties, section thickness, construction practices, traffic loads, among others. The total length of the AC pavement sections studied was 68.4 mi (110 km). The subgrade modulus of elasticity of some sections is higher than expected. This is because the FWD tests were conducted during summer and fall seasons when the temperature was around 90 degrees Fahrenheit or higher. High temperatures affect the subgrade modulus of elasticity leading to lower values in the deflection recorded by the sensors therefore improving the subgrade response [22]. The structural condition of the pavement sections was divided into four categories: Excellent,
Good, Fair, and Poor. The distress mechanisms most likely will be developed in sections where the structural pavement condition was classified as poor or fair. This classification is useful to define places in which cores could be extracted in order to provide details about differences in the pavement response under similar material properties and traffic loading. A summary of the structural condition of the asphalt concrete sections of the present study is as follows: Excellent: 51.6% (56.81 km), Good: 26.9% (29.61 km), Fair: 15.2% (16.74 km), and Poor: 6.4% (6.92 km). In general terms, the distresses reflected on the pavement surface most likely are due to a deficiency in the stiffness of the base or subbase layers rather than a stiffness deficiency in the AC or subgrade layers.
A similar methodology of analysis and data interpretation, as shown for the cases in the State of Ohio presented in this paper, can be implemented in Colombia to determine with spreadability and deflection criteria obtained from standard FWD field measurements, the actual condition and necessity of future rehabilitation projects on the existing infrastructure.
References
1. T. Fwa. The Handbook of Highway Engineering. NY: CRC Press/Lewis Publishers. New York, USA. 2006. pp. 888. [ Links ]
2. D. Chen, T. Scullion. "Nondestructive Testing Technologies to Assist in Selecting the Optimal Pavement Rehabilitation Strategy". Journal of Testing and Evaluation. Vol. 32. 2007. pp. 211-219. [ Links ]
3. T. Masada, T. Sargand, B. Abdalla, J. Figueroa. Material Properties for Implementation of Mechanistic-Empirical (M-E) Pavement Design Procedures. Ohio Department of Transportation & Federal Highway Administration. ORITE. Department of Civil Engineering. Athens, OH (USA). 2004. pp. 311. [ Links ]
4. T. White, J. Haddock, A. Hand, H. Fang. Contribution of Pavement Structural Layers to Rutting of Hot Mix Asphalt Pavements. NCHRP Report No. 468. Transportation Research Board of the National Academic Press. Washington D.C., USA 2002. pp. 57. [ Links ]
5. Y. Lu, L. Lu, P. Wright. "Visco-Elastoplastic Method for Pavement Performance Evaluation". Proceeding of the Institution of Civil Engineers Transport. Vol. 153. 2002. pp. 227-234. [ Links ]
6. S. Sargand. Development of an Instrumentation Plan for the Ohio SPS Test Pavement. Report FHWA/ OH-94/019. Ohio Department of Transportation and FHWA. Athens. OH (USA). 1994. pp. 127. [ Links ]
7. S. Sargand, R. Green, I. Khoury. Instrumenting Ohio Test Pavement. Transportation Research Board. Washington D.C., USA. 1997. pp. 23-30. [ Links ]
8. S. Sargand. Coordination of Load Response Instrumentation of SHRP Pavements. Report FHWA/ OH-99/009. Ohio Department of Transportation and FHWA. Athens, OH (USA). 1999. pp. [ Links ]
9. S. Sargand, W. Edwards. Accelerated Testing of Ohio SHRP Sections 390101, 390102, 390105, and 390107. Final Report FHWA/OH-2004/012. Ohio Department of Transportation and FHWA. Athens, OH (USA). 2004. pp. 188. [ Links ]
10. S. Sargand. W. Edwards. Evaluation of Pavement Performance on DEL 23. Final report FHWA/OH- 2007/05. Ohio Department of Transportation and FHWA. Athens, OH (USA). 2007. pp. 424. [ Links ]
11. J. Figueroa. Characterization of Ohio Subgrade Types. Final Report No. FHWA/OH-94/006. Ohio Department of Transportation and Federal Highway Administration, Department of Civil Engineering, Case Western Reserve University. Cleveland, OH (USA). 1994. pp. 181. [ Links ]
12. J. Figueroa. Monitoring and Analysis of Data Obtained from Moisture-Temperature Recording Stations. State Job No 14589/14694. Department of Civil Engineering, Case Western Reserve University. Cleveland, OH (USA). 1997. pp. 148. [ Links ]
13. E. Chou, J. Tack, J. Yu, J. Wielinski. Evaluation of the Variation in Pavement Performance between ODOT Districts. Report FHWA/OH-2004/01. Department of Transportation, University of Toledo. Ohio (USA). 2004. pp. 338 [ Links ]
14. S. Salimath. Evaluation of Soil Stiffness. Master's Thesis. Ohio University. Athens, OH (USA). 2002. pp. 183. [ Links ]
15. A. Claessen, C. Valkering, R. Ditmarsch. Pavement Evaluation with the WeightDeflectometer. Proceedings, Technical Sessions. The Association of Asphalt Paving Technologists. University of Minnesota. Minneapolis, USA. 1976. pp. 122-15. [ Links ]
16. Dynatest International. "Dynatest FWD/HWD Test Systems". Retrieved from www.dynatest.com/hardware/fwd_hwd.htm. Consultado January. 24. 2008. [ Links ]
17. M. Pierce. Development of a Computer Program for the Determination of the Area Value and Subgrade Modulus Using the Dynatest FWD. Washington State Department of Transportation. Olympia, Washington (USA). 1999. pp. 59. [ Links ]
18. S. Sargand. Determination of Pavement Layer Stiffness on the OHIO SHRP Test Road Using NonDestructive Testing Techniques. Final report FHWA/ OH-2002/031. Ohio Department of Transportation and FHWA. Athens, OH (USA). 2002. pp. 170. [ Links ]
19. W. Edwards, R. Green, J. Gilfert. Implementation of a Dynamic Deflection System for Rigid and Flexible Pavements in Ohio. FHWA/OH-89/020. Ohio Department of Transportation and FHWA. Athens, OH (USA). 1989. pp. 161. [ Links ]
20. C. Vega. Long Term Performance of Existing AC and PCC Pavements in Ohio. Master's Thesis. Ohio University. Athens, OH (USA). 2008. pp. 203. [ Links ]
21. Ohio Department of Transportation. Construction and Material Specifications. Department of Transportation. Columbus. OH (USA). 2008. pp. 666. [ Links ]
22. M. Hossain, B. Long, J. Gisi. NDT Evaluation of Seasonal Variation of Subgrade Response in Asphalt Pavements. Ames, IA: Semisequicentennial Transportation Conference Proceedings. Iowa State University. Ames, Iowa (USA). 1996. pp. 101-104. [ Links ]


