Serviços Personalizados
Journal
Artigo
Indicadores
-
 Citado por SciELO
 -
 Acessos
Links relacionados
-
 Citado por Google
 -
 Similares em
SciELO
 -
 Similares em Google
Compartilhar
Revista Facultad de Ingeniería Universidad de Antioquia
versão impressa ISSN 0120-6230
Rev.fac.ing.univ. Antioquia no.68 Medellín jul./set. 2013
ARTÍCULO ORIGINAL
Static and dynamic characteristics of turbulent flow in a closed compound channel
Características estáticas e dinámicas del flujo turbulento en canales compuestos cerrados
Jhon N. V. Goulart1*, Carla T. M. Anflor1, Sergio V. Möller2
1University of Brasilia. Área Especial de Indústria - Setor Leste. CEP: 72.444210. Gama, DF, Brazil.
2University of Rio Grande do Sul. Rua Sarmento Leite, 425. CEP: 90050170. Porto Alegre, RS, Brazil.
*Autor de correspondencia: teléfono: + 55 + 61 + 8552 6433, fax: + 55 + 61 + 3522 4821, correo electrónico: jvaz@unb.br (J. Goulart)
(Recibido el 23 de abril de 2012. Aceptado el 5 de agosto de 2013)
Abstract
La técnica de anemometría de hilo caliente se emplea para estudiar la distribución de velocidades y las características dinámicas del flujo en dos tipos de canales compuestos cerrados. Los canales compuestos fueron construidos utilizando dos tubos rectangulares, unidos a las paredes de un canal de viento, separados por una distancia d. En esta configuración, una distancia estrecha conecta al subcanal. Los resultados revelaron un flujo interesante que fue bastante similar a una capa de mezcla. Todos los perfiles de velocidad axial presentaron puntos de inflexión en la interface entre el subcanal principal. Mediante el uso de las cantidades medias del flujo turbulento se puede describir los perfiles de velocidad axial por una función tangente hiperbólica. Se sugirió también un número Strouhal. Independientemente del tipo de canal, la frecuencia adimensional fue casi constante, resultando en un número Strouhal de aproximadamente 0.10.
Keywords: Compound channels, mixing layer, hot-wire anemometry, coherent structures
Resumen
Este artículo describe una biblioteca de bloques parametrizables (XSGImgLib) para la implementación de tareas de procesado de imágenes en FPGA. Se ha utilizado la técnica de diseño basado en modelos proporcionada por Xilinx System Generator (XSG) para diseñar diferentes bloques de procesado que implementan operaciones puntuales (binarización) y basadas en vecindad (filtros lineales y no-lineales) para imágenes en escala de grises. La parametrización de los bloques permite configurar la precisión de los datos de entrada/salida, el tamaño de la ventana, la estrategia de normalización y distintas opciones de implementación (optimización en área o velocidad). El artículo muestra los resultados de implementación para las diferentes opciones de configuración y ejemplifica la combinación de los bloques de procesado en el desarrollo de un sistema para segmentado de imágenes.
Palabras clave: Canales compuestos, capa de mezcla, anemometría de hilo caliente, estructuras coherentes
Introduction
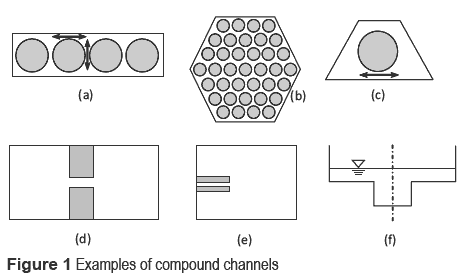
Compound channels are characterized by the presence of a narrow region connecting one or more main subchannels. The narrow gaps are responsible for mass, energy and momentum exchange between the subchannels. Figure 1 provides some examples of compound channels.
The remarkable features of these types of channels are the unusual Reynolds stress distributions and the periodical patterns of the velocities, which are called flow pulsations. For a long time, secondary flows were thought to be the only flows responsible for the increased mixing rates in the gap. A considerable amount of research was aimed at measuring secondary flows. The main results showed that these values ranged from 0.1% up to 2% of the bulk axial velocity. Some authors believe this range is low to promote momentum and heat transport through the gaps [1].
Large-scale structures occurrence was already reported by Knight and Shiono [2], Soldini et al [3] and other hydraulic engineers who have studied open compound channels. The works from Meyer and Rehme [4], Wu and Trupp [5], Guelouz and Tavoularis [6] and Pitot and Tavoularis [7] related to closed compound channels showed similar results to those found in open channels.
Flow pulsations were reported for the first time by Rowe et al [8] when the authors studied turbulent flow in a rod bundle. According to the authors, the frequency associated with this phenomenon increased when the gap width was reduced. With hot-wire probes, Möller [9] confirmed Rowe's findings. Möller's results also showed that flow pulsations were associated with a strong vorticity field near the gap.
Quasi-periodical flow pulsations were also found in other types of compound channels. Wu and Trupp [5] performed hot-wire measurements in a trapezoidal channel containing a single tube. The results showed pronounced peaks in the spectra, which confirm the strong dependence of the frequency on geometrical parameters and the flow velocity. After that, Meyer and Rehme [4, 10] performed measurements in unusual compound channels. Using hot-wire anemometry, the authors studied the flow characteristics in a channel with two or more parallel fins attached to a side wall. Test sections were characterized using the dimensionless parameter p/d, with p being the depth of the slot formed by the plates and d being the distance between plates. Test sections with p/d values ranging from 1.66 to 10.0 were investigated. Regarding mean turbulent quantities, all features stressed in the previous papers were confirmed. When attention was given to large-scale structures, the authors observed flow pulsations for test sections with p/d ≥ 2. The results were confirmed using flow visualizations. A correlation for the Strouhal number was also proposed. The Strouhal number definition was based on the main frequency f, the square root of the product of p and d ( ) and the edge velocity Ued. The edge velocity is the mean axial velocity measured at the edge of the plates. According to the authors, the results revealed important discrepancies for p/d values greater than 7. For the slot in which p/d ≤ 1.7, periodical traces in the velocity fluctuations were not observed.
In Goulart and Möller [11], the authors succeeded in obtaining comprehensive measurements of the mean axial velocity and the velocity fluctuations of the turbulent flow in a compound channel formed by parallel plates, as observed in figure 1(e). Ten test sections involving three p/dratios—5, 10 and 12.50—were studied. The results suggested the formation of a turbulent mixing layer between the plates. By using self- similarity functions, it was possible to describe the mean axial velocity (at the symmetry lines) using a tangent hyperbolic function.
Pitot and Tavoularis [7], performed flow visualization in an eccentric annular channel with d/D = 0.28. Through calculation the authors observed two mixing layers on either side of the gap with turning points. The onset instabilities was determined by observing the dye streak injected in the gap. The experiments showed the critical Reynolds number increased with increasing eccentricity in the range 0.5< e < 0.8. On the other hand, for smaller eccentricities, e < 0.5, the critical Reynolds number seems to be insensitive to eccentricity. According to them, these findings suggested that the instability mechanism in annular flow is attributed to the instability of the two shear layers on either side of the gap.
In this paper, attention is focused on the mean velocity distribution and the dynamic characteristics of the turbulent flow in two types of rectangular compound channels. The measurements performed herein were an attempt to establish a relationship between mean flow distribution in compound channels and that one found in the mixing layer problems. From the mean flow velocity distribution, velocity and length scales were found. By using both of the scales, the mean velocity profiles and Strouhal number were defined. Despite scattering of the data, the results showed that these scales might be representative ofthis kind of problem, regardless of the channel type.
Experimental procedures and test sections
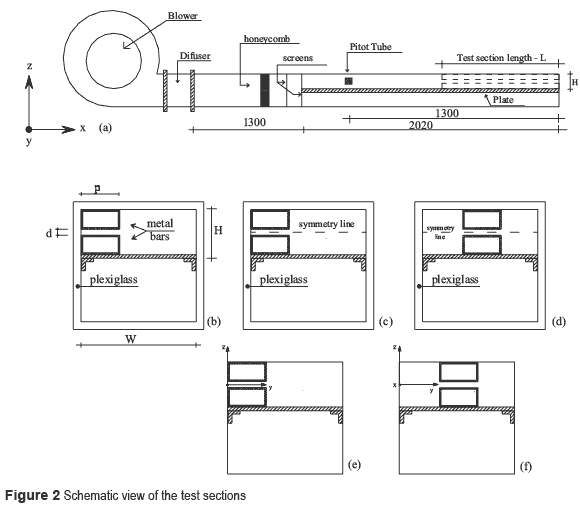
The test section, as observed in figure 2, consists of a 3320 mm long channel in which the width W and the height H are variable. While the dimension H increased over the range of 54 to 60 mm, three different values for W were adopted: 75, 120 and 130 mm. A splitter plate was placed along the longitudinal axis of the channel to reduce the height of the wind channel, as observed in figure 2(a). At room temperature, the working fluid was air, which reached the test section with a turbulence intensity of approximately 1%. A Pitot tube, placed at a fixed position, was used to measure the reference velocity Uref of the experiments. During the experiments, the reference velocity Uref remained almost constant at 13.20 m/s.
Inside the channel, two different topologies of compound channels were built. In the first channel, two rectangular aluminium bars with thickness e = 1.2 mm and length L, were attached to a side wall of the wind channel, as observed in figure 2(b). The main dimensions are the depth p and width d. The other topology consists of moving these bars towards the center of the channel, forming two subchannels connected by a central gap, figure 2(d). The coordinate system was placed as shown in figure 2(e) and 2(f).
The first topology will be hereafter called SS, and the second topology will be called DS. These names are suitable because, in the first case, there is only one main subchannel (single-subchannel), and in the second case, there are two main subchannels (double-subchannel). See figure 2(e) and 2(f).
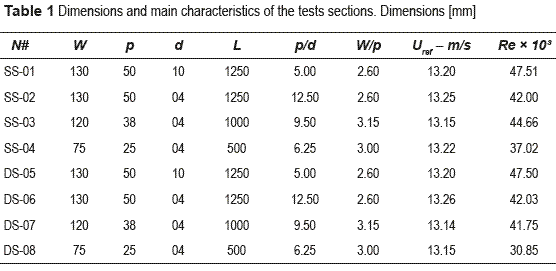
Four different configurations were investigated for each topology, and these configurations are summarized in table 1. The Reynolds numbers were defined using the reference velocity Uref the hydraulic-diameter of the channel Dh and the molecular (kinematic) viscosity v. Using the criteria adopted, the experiments were performed within Reynolds numbers from 30.80 × 10³ up to 47.50 × 10³.
Measurements of the velocity were performed using a hot-wire DANTEC StreamLine system using a single-wire probe. This probe contains a wire running perpendicular to the main flow to perform measurements of the mean and velocity fluctuations in the streamwise direction (x-axis). All the measurements were performed along the symmetry line, as shown in figure 2(c) and (d). Data mean and velocity fluctuation were all acquired 20 mm upstream of the channel outlet.
The method introduced by Collis and Williams [12] was applied for the evaluation of the anemometer signals. The velocity field was previously measured by a Pitot tube.
Data acquisition was performed using a 16bit National Instruments NI USB - 9162 A/D converter board with a sampling frequency of 3 kHz and a low-pass filter set at 1 kHz. The temporal series were each 43.69 s long.
Results and discussion
Velocity Profiles and mixing layer thickness
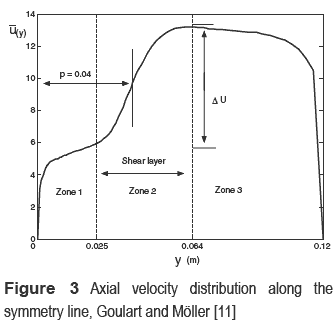
Figure 3 shows the mean axial velocity distribution along the symmetry line from another compound channel previously studied by Goulart and Möller [11]. One can see the flow acceleration towards the main channel followed by a velocity reduction in the narrow gaps. The flow deceleration is caused by the viscous effects and the reduced gap size, which has the dimension d. Another striking characteristic of these profiles is the turning point at the interface of the slot/main subchannel, at y/p = 1. It is known that turning points play an important role in the velocity profile stability, according to Rayleigh's theorem. Thus, flow analysis led the authors to consider this kind of flow as a bounded spatial mixing layer that begins in the narrow gap region and extends towards the main subchannel.
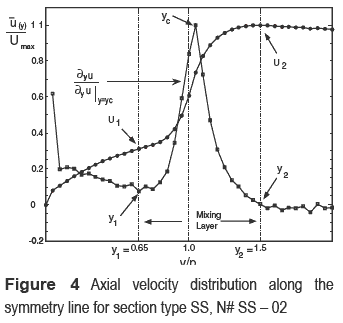
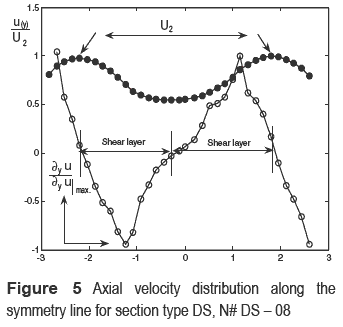
Figures 4 and 5 show the mean axial velocity distribution along the symmetry line; the derivatives of the velocity distribution form both types of compound channels, SS and DS, respectively. In both cases, the mean axial velocity and its gradient values are presented in a dimensionless form using their respective maximum values.
It should be noted that the same features discussed above are presented in figures 4 and 5, and the mixing layer formation and a turning point can be observed. Moreover, when the DS-type test section is analysed, two mixing layers can be observed on the right and left sides of the main subchannels. This fact can be clearly observed in Figure 5. It is also important to note that the turning point appears near both interfaces: y/p ~ 1 and y/p ~ -1.
The mixing layers are characterized by the presence of two main streams with different velocities: the highest one U2 and the lowest, U1. Between them, the velocity profile can be established as a self-similarity function. Thus, it is necessary to know the velocity difference ΔU, the convection velocity Uc and the mixing layer thickness δ(x ).
By examination, the mean axial velocity profile was divided into three zones (figure 3). In zones 1 and 3, the velocity profile suffers from the influence of the lateral walls, while zone 2 represents the mixing layer itself. In zone 2, the mean velocity characteristics are ruled by the gap dimensions (p, d and L). In this zone, the main information about the flow can be determined. For U1, evaluation is necessary to determine the position where the wall influence ends and, therefore, the mixing layer begins. This point is called y1, and it occurs in the narrow gap, see figure 4. By observing the gradient profile in figure 4, one can see that when zone 1 ends, the derivative form of the curve changes completely. At this point, in the narrow gap, the first turning point occurs, implying that mixing layer has begun.
The higher velocity U2 occurs in the main channel at position y1. It is the highest value of the mean axial velocity in the profile. At this location it is possible to state,  = 0..
= 0..
The mean axial velocity profile and its gradient, from test section DS-08, are presented in figure 5. As predicted, two mixing layers are formed on both sides of the channel. A small difference between both sides can be observed, which shows that entrance effects are still present. Another remarkable feature involves the position where U1 occurs. The lower velocity U1 is expected to be found at the central position of the gap. This configuration will be achieved when the entrance length is long enough.
For both types of test sections, the highest values of the derivative of the axial velocity profile, ( ), occur at the dimensionless coordinate y/p ~ 1 and -1, which is the slot/main subchannel interface. In the DS configuration, near the centre of the gap, the value of the derivative of axial velocity is null, showing the location of U1.
Although all of the studied test sections show the same characteristics, symmetry of the velocity profiles was not achieved for all the test sections in the DS configuration. In spite of this fact, the main features discussed before, velocity distributions and mixing layer characterisation, can be observed in all of the tests sections.
Thus, it is possible to describe this problem as a turbulent mixing layer problem. Neglecting the pressure gradient ( ), the 2D form can be written as follows:

where  and
and  are the axial and transverse velocity components, respectively, v is the molecular (kinematic) viscosity and
  is the shear stress caused by the velocity fluctuation.
According to Lesieur [13], the self-similar solution for Eq. (1) leads to an error function for the mixing layer velocity profile; however, a hyperbolic tangent function (tanh) is widely used as an approximation; thus,

where Uc is the convection velocity, ½(U2 + U1), ΔU is the difference between the lower and upper velocities in the mixing layer U1 and U2 and  is the self-similarity parameter given by Prooijen and Uijttewaal [14].
To describe the mean quantities as a self-similarity function is necessary to determine the center of the mixing layer, yc, where Uc occurs and the mixing layer thickness δ(x ) is defined as

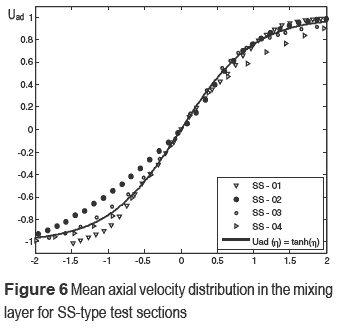
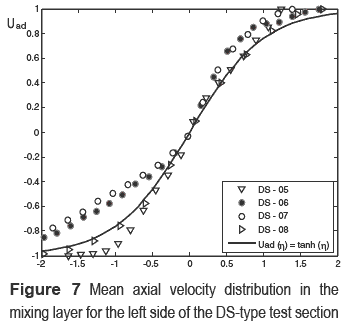
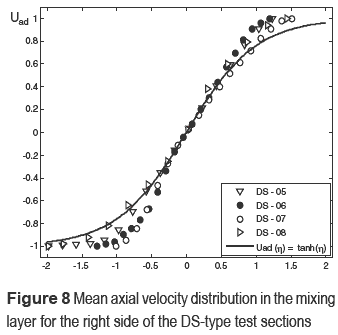
Figures 6, 7 and 8 show the velocity profiles of test section types SS ad DS. Figures 7 and 8 present the mean axial velocity profiles for the left and right sides of section type DS. The experimental data were plotted as a function of the similarity parameter η and were fit using

Eq. (4) demonstrates good agreement with the experimental data for all cases investigated. However, at the edges, discrepancies could be observed. In an attempt to achieve a better fit, an error function was used, but no important improvements were seen.
In figures 7 and 8, the asymmetry of the flow is noticeable in the different main subchannels, as observed in test sections DS 06 and 07. In these sections, the entrance effects are no longer dissipated.
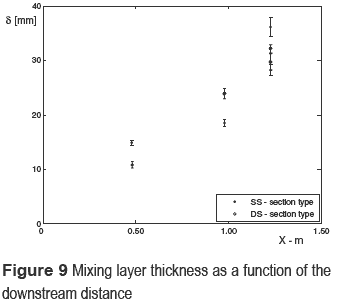
Once self-similarity has been attained, the flow quantities are only dependent on the local variables [15]. In this state, increasing the mixing layer thickness δ(x ) is expected to be a linear function of the streamwise position. Using Eq. (3), the mixing layer thickness is stressed as a streamwise position function, as observed in figure 9. It can be observed that a linear function seems to be adequate for the data fitting. Despite the linear behaviour, the scattering of the data does not allow us to state that self-similarity has been attained for the flow. However, this scattering may be explained by a different growth rate of the mixing layer thickness. A different growth rate of the mixing layer has already been observed by other researchers as Yang et al [16] and Bell and Metha [17]. Both groups studied the characteristics of the developing mixing layer caused by a splitter plate. According to these groups, the growth rate difference could be attributed to the streamwise vortex development. These large-scale structures would be responsible for the momentum thickness increasing.
It is also important to note that the rms of the velocity fluctuations and Reynolds stress distributions were not obtained in this work. Further works should be dedicated to measuring the Reynolds normal stresses ( ) and the shear stress (
 ) distribution.
Dynamic features of the flow
Streamwise vortex formation plays an important role in compound channels. Large structures are responsible for the mixing during natural processes. These structures diffuse mass, momentum and energy between subchannels.
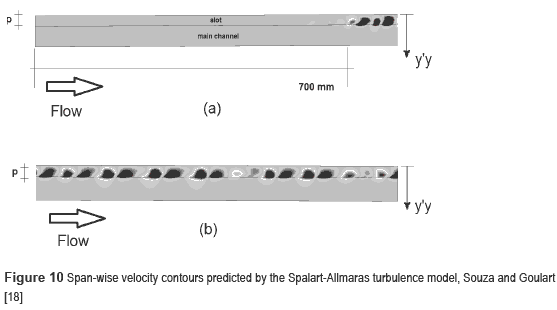
Using URANS and an isotropic Sparlat-Allmaras as turbulence model Souza and Goulart [18] performed numerical calculations in a compound channel quite similar to test section SS-04. The instantaneous span-wise velocity contours were depicted in the longitudinal slice at the middle height of the channel, as shown in figure 10. The main results revealed stable vortexes travelling in the x-y plane, rotating in opposite directions inside the slot and holding a constant spacing between them. These coherent structures were found travelling at a certain velocity Uc, known as the convection velocity. However, the ''vortex train'' [1] formation only appeared 700 mm after the channel's entrance. This information is in contrast with our experimental investigation that demonstrated periodical traces of velocity for shorter downstream distance from inlet's channel.
Recently, Chang and Tavoularis [ 19] have performed URANS calculation in a rectangular channel containing a cylindrical rod. The computational length domain was L = 108D and the narrow gap was 0.10 D. Result of mean axial velocity distribution, on the symmetry plane, was quite similar to that one found in figure 5. There we can see the difference velocity increasing with downstream distance. As regards the onset flow instabilities, the effect of inlet velocity was investigated. A fully-developed inlet velocity distribution was set, as entrance condition, rather than uniform velocity. This modification shortened significantly the downstream distance for the onset of flow instabilities in the gap but a Strouhal number decreasing was observed. This result led to the authors to state that the uniform velocity at the entrance is preferable to a fully- developed velocity distribution.
In the present work, investigations on coherent structures in the flow were also performed for every test section through velocity fluctuation series. Velocity fluctuation series were taken throughout the symmetry line 20 mm upstream channel's outlet.
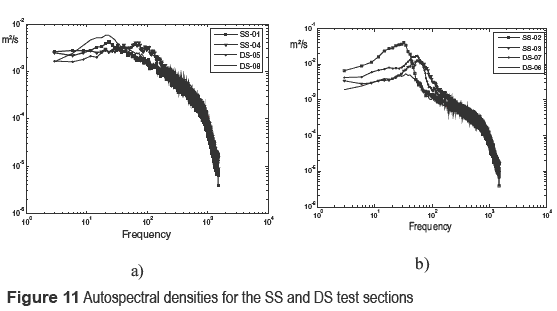
Figures 11(a) and 11(b)) show the spectral analysis of the temporal series of the axial velocity. Although many autospectral densities had been produced, the authors decided to show the ones obtained at the dimensionless position y/p = 1, at interface slot/main channel. At this position are present the maximum production of turbulent kinect energy.
In figure 11(a), the autospectral densities functions were computed for all series data from test sections SS-01, SS-04, DS-05 and DS- 08. In these sections, no important peaks were observed throughout the symmetry line, unlike those shown in the next test sections, as observed in figure 11(b). In sections SS-02, SS-03, DS- 06 and DS-07, pronounced peaks in the spectra of the velocity fluctuation can be observed at frequencies of 32.22, 58.29, 35.16 and 57.73 Hz, respectively. Peaks were not only observed in the dimensionless position η = 0 but also in and near the slot. However, periodical traces of the velocity fluctuations seem to vanish for the dimensionless distance η > 1 in both configurations.
In this work, large-scale structures only appeared for deeper sections, such as at p/d ratios of 9.50 and 12.50, Table 1. Despite the geometry of the compound channel, the main frequency in the spectra was found to decrease with the depth of the slot, as already seen in Meyer's work [4]. It is also noticeable that the peaks produced are wider than those found in a viscous wake behind a circular cylinder, regardless of the section type. The broadening of the peaks suggests that large vortices of different scales are responsible for flow pulsation between the subchannels. This fact was already noted by Rehme [20].
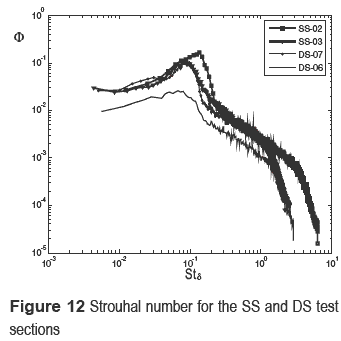
In figure 12, the autospectral density functions from figure 11(b) are presented in dimensionless form. Energy (y-axis) and frequencies (x-axis) were made dimensionless using each measure's own mean flow scale. The Strouhal number was formed with the convective velocity Uc, the main frequency f and the mixing layer thickness δ(x). Thus,

while the power density energy in dimensionless form is given by Eq. (6).

In Eq. (6),  is the variance of the axial velocity fluctuation.
Based on the bandwidth Be = 2.92 Hz and the series length, uncertainties about the autospectral results and Strouhal numbers ranged from 6% up to 10%.
It is important to note that when frequencies are represented in a dimensionless form using Eq. (5), peaks in the spectra tend to collapse near Strouhal number of 0.10, regardless of the section type. This fact implies that the Strouhal number definition, as shown in Eq. (5), seems to be suitable for problems involving closed compound channels.
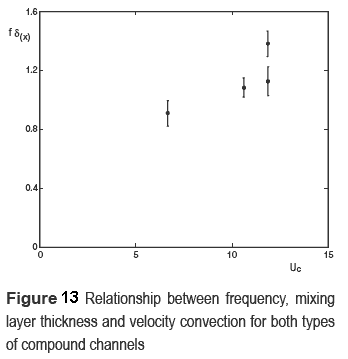
Some scattering of the data was observed. Strouhal numbers Stδ ranging from 0.094 up to 0.136 were found. Figure 13 shows the relationship between the frequency, mixing layer thickness and convection velocity. The frequency and the mixing layer thickness seem to present a linear relationship when shown as a convection velocity function.
In this work, the dependency between the Strouhal number and the type of channel was not observed.
Concluding remarks
In this paper, an experimental study of the mean velocity distribution and the dynamic behaviour of turbulent flow in a compound channel was performed. The main purpose of this study was to investigate the flow characteristics in two different compound channels and to attempt to describe the mean quantity distribution using self-similarity variables.
The results of the velocity measurements showed the presence of a mixing layer in both configurations investigated. All mean velocity profiles were characterized by a turning point at the slot/main subchannel interface. Despite some scattering of the data, the mean quantity distribution could be described using local scales δ(x), Uc and ΔU; through the self-similar state for this type of flow deserves further investigation.
Spectral investigations revealed that coherent structures were not present in all test sections but only in deeper structures with a p/d ratio > 9.50. As observed by Meyer and Rehme [4], the main frequencies of velocity fluctuations were found to decrease in the case of the deep slot. This behaviour was found to be quite similar in both test sections, regardless of the geometry.
The Strouhal number, as defined by the main frequency, the convection velocity and the shear layer thickness, was general enough to describe frequencies from two different kinds of compound channels. Although frequencies ranged from 30 to 60 Hz, when represented in the dimensionless form, the Strouhal number collapsed at St ~ 0.10.
Despite the acceptable results that have been shown in this paper, the scales from the velocity profiles are not considered easy to manage. Obtaining these scales involves additional work. Thus, it is still necessary to obtain general rules for the mean quantity distributions based on the geometrical characteristics of the channel or narrow gap.
References
1. L. Meyer. ''From Discovery to Recognition of Periodic Large Scale Vortices in Rod Bundles as Source of Natural Mixing Between Subchannels—A review''. Nuclear Engineering and Design. Vol. 240. 2010. pp. 1575-1588. [ Links ]
2. D. Knight, K. Shiono. ''Turbulence Measurements in a Shear-layer Region of a Compound Channel''. Journal of Hydraulic Research. Vol. 28. 1990. pp. 175-196. [ Links ]
3. L. Soldini, A. Brocchini, M. Mancinelli, R. Bernetti. ''Macrovortices-Induced Horizontal Mixing in Compound Channels''. Ocean Dynamics. Vol. 54. 2004. pp. 333-339. [ Links ]
4. L. Meyer, K. Rehme. ''Large-scale Turbulence Phenomena in Compound Rectangular Channels''. Experimental Thermal and Fluid Science. Vol. 8. 1994. pp. 286-304. [ Links ]
5. X. Wu, A. Trupp. ''Spectral Measurements and Mixing Correlations in a Simulated Rod Bundle Subchannels''. Int. J. Heat Transfer. Vol. 37. 1994. pp. 1277-1281. [ Links ]
6. M. Guellouz, S. Tavoularis. ''The Structure of the Turbulent Flow in a Rectangular Channel Containing a Single Rod - Part 1: Reynolds-Average measurements''. Exp. Thermal and Fluid Sci. Vol. 23. 2000. pp. 59-73. [ Links ]
7. E. Pitot, S. Tavoularis. ''Gap instability of laminar flows in eccentric annular channels''. Nuclear Engineering and Design. Vol. 241. 2011. pp. 4615-4620. [ Links ]
8. D. Rowe, B. Johnson, J. Knudsen. ''Implications Concerning Rod Bundle Crossflow Mixing Based on Measurements of Turbulent Flow Structure''. Int. J. Heat Mass Transfer. Vol. 17. 1974. pp. 407-419. [ Links ]
9. S. Möller. ''On Phenomena of Turbulent Flow Through Rod Bundles''. Experimental Thermal and Fluid Science. Vol. 4. 1991. pp. 25-35. [ Links ]
10. L. Meyer, K. Rehme. Periodic Vortices in Flow Through Channels with Longitudinal Slots or Fins. Proc.10th Symposium on Turbulent Shear Flows. The Pennsylvania State University. Pennsylvania, USA. August 14-16, 1995. [ Links ]
11. J. Goulart, S. Möller. Shear flow in compound channels. Proc. 19th International Congress of Mechanical Engineering - COBEM. Brasilia, Brazil. November 5-9. 2007. [ Links ]
12. D. Collis, M. Williams. ''Two-dimensional Convection from Heated Wires at low Reynolds Numbers''. J. FluidMech. Vol. 6. 1959. pp. 357-384. [ Links ]
13. M. Lesieur. Turbulence in Fluids. 3rd ed. Ed. Kluwer Academic Publishers. Dordrecht, The Netherlands. 1997. pp. 91-107. [ Links ]
14. B. van Prooijen, W. Uijttewaal. ''A linear Approach for the Evolution of Coherent Structures in Shallow Mixing Layers''. Physics of Fluids. Vol. 14. 2002. pp. 4105-4114. [ Links ]
15. A. Townsend. The structure of turbulent shear flow. 1st ed. Ed. Cambridge University Press. Cambridge, England. 1976. pp. 188-230. [ Links ]
16. W. Yang, H. Zhang, C. Chan, K. Lau, W. Lin. ''Investigation of plane mixing layer using large eddy''. Computational Mechanics. Vol. 34. 2004. pp. 423-429. [ Links ]
17. J. Bell, R. Mehta. ''Two-Stream Mixing Layer from Boundary Layers''. AIAA Journal. Vol. 28. 1990. pp. 2034-2042. [ Links ]
18. S. Souza, J. Goulart. ''Numerical Analysis of Developing Turbulent Flow in a Closed compound Channel.'' Thermal Engineering. Vol. 10. 2011. pp. 81-87. [ Links ]
19. D. Chang, S. Tavoularis. ''Numerical Simulation of Developing Flow and Vortex Street in a Rectangular Channel with a Cylindrical Core.'' Nuclear Engineering and Design. Vol. 243. 2012. pp. 176-199. [ Links ]
20. K. Rehme. ''The Structure of Turbulence in rod Bundles and the Implications on Natural Mixing Between Subchannels''. Int. J. Heat Transfer. Vol. 35. 1992. pp. 567-581. [ Links ]


