Services on Demand
Journal
Article
Indicators
-
 Cited by SciELO
 -
 Access statistics
Related links
-
 Cited by Google
 -
 Similars in
SciELO
 -
 Similars in Google
Share
Revista Facultad de Ingeniería Universidad de Antioquia
Print version ISSN 0120-6230
Rev.fac.ing.univ. Antioquia no.74 Medellín Jan./Mar. 2015
ARTÍCULO ORIGINAL
Low complexity demodulator for BFSK waveforms based on polygonal approximation
Demodulador de baja complejidad para formas de onda BFSK con base en la aproximación poligonal
Jorge Torres-Gómez1*, Fidel Ernesto Hernández-Montero2, Joachim Habermann3
1 Departamento de Telecomunicaciones y Telemática, Instituto Superior Politécnico José Antonio Echeverría. Calle 114 e/ Ciclovía y Rotonda, Marianao. C.P. 11500. La Habana, Cuba.
2 Grupo de investigación Teoría de la Señal y Comunicaciones, Universidad de Mondragón. Loramendi 4, C.P 20500. Gipuzkoa, España.
3 Department of Electrical Engineering and Information Technology, University of Applied Science Technische Hochschule Mittelhessen (THM). WiesenstraΒe 14, 35390. GieΒen, Germany.
* Corresponding author: Jorge Torres Gómez, e-mail: jorge.tg@electrica.cujae.edu.cu
(Received May 5, 2014; Accepted September 11, 2014)
Abstract
The present article relates in general to digital demodulation of Binary Frequency Shift Keying (BFSK waveform). The objective of the present research is to obtain a new processing method for demodulating BFSK-signals in order to reduce hardware complexity in comparison with other reported. The solution proposed here makes use of the theories of matched filters and curve segmentation. The article describes the integration and configuration of a Sampler Correlator and polygonal segmentation blocks in order to obtain a digital receiver for properly demodulating the signal received. The proposed solution is shown to reduce dramatically the complexity in hardware and has a better performance regarding noise in comparison with other reported. Theoretical details concerning limits of applicability are also given by closed-form expressions. Simulation experiments are illustrated to validate the overall performance.
Keywords: BFSK, digital demodulation, polygonal approximation
Resumen
El presente artículo está relacionado con la demodulación digital de la señal Binary Frequency Shift Keying (BFSK). El sistema propuesto hace uso de la teoría de filtros macheados y de la segmetación de curvas. El artículo describe la integración y configuración de un bloque de correlador por muestreo con un bloque de segmentación poligonal con el objetivo de obtener un receptor digital para demodular apropiadamente la señal recibida. La solución propuesta reduce considerablemente la complejidad en hardware y presenta un mejor desempeño con respecto al ruido en comparación con otros demoduladores. Aspectos teóricos en relación con los límites de aplicabilidad se ilustran mediante expresiones analíticas. Se muestran además resultados de experimentación que validan el desempeño del sistema.
Palabras clave: BFSK, demodulación digital, aproximación poligonal
Introduction
Frequency Shift Keying (FSK) is a digital modulation with applications in wireless technologies [1, 2] and also in satellite communications [3]. Various configurations of circuitry have previously been reported for BFSK demodulators. Some of them, especially those based upon correlator receiver, are particularly interesting because they perform signal to noise ratio maximization [4] and do not use symbol sychronization blocks. As a case in point, such a detector is the Balanced Quadricorrelator [5], with modifications depending on the modulation employed in [6-8].
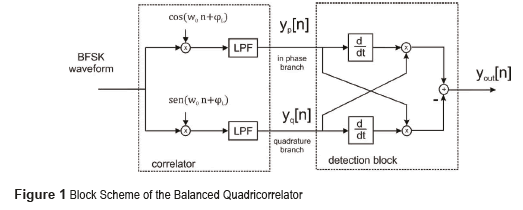
These types of detectors are implemented in a two-part structure; the first one is an analogue correlator [9]. In the second part, the instantaneous frequency is extracted by performing proper derivation, addition and multiplication procedures, Fig. 1 depicts the case of the Balanced Quadricorrelator. However, due to the large number of adders and multipliers needed, such digital implementations demand a high cost.
Although the low pass filter and the multiplication procedure could be obtained through a flip-flop element, as in the digital logic quadricorrelator scheme [10], and the differentiator can be accomplished by flip-flop blocks followed by AND-gates, this scheme is prone to instabilities under conditions of low signal to noise ratio, causing total interruption of the counting process at the system output, despite its low hardware consumption.
The method discussed in this paper outperforms all previous schemes based upon a correlator implementation, in terms of hardware complexity. New BFSK detection schemes based upon correlator elements are devised, which consider the recognition of a slope instead of an instantaneous frequency at the output of the correlator. In this paper, new slope detection algorithms are derived based upon techniques for curve segmentation.
Receiver Conception
General Conception
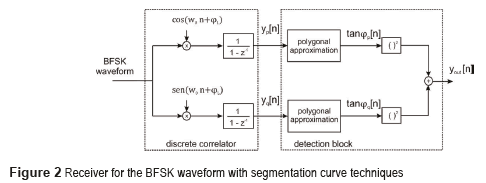
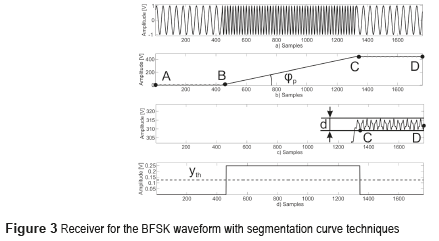
In the proposed scheme a Sampler Correlator [11] is employed in order to reduce complexity. It is comprised of only 2 adders and 2 multipliers, as depicted in Fig. 2. The main idea of the proposed receiver is to identify the approximately linear ramp observed at the output of a correlator for a sine-wave input [4]. Fig. 3 b) shows the correlation operation for the BFSK signal shown in Fig. 3 a) when the reference is the higher frequency tone. The general procedure is to find the changes of slope at the output of the correlator and then to estimate the slope of each segment. Finally, from this information the symbols transmitted are determined.
The change of slope in the curve of Fig. 3 b) is directly related to the value of the symbol transmitted. Methods for recognizing these changes can be employed for demodulation purposes. The curve in Fig. 3 b) is comprised, in average, by the linear segments  and
and  , and the split of a curve into linear segments is a task deeply studied in the field of curve segmentation by means of two categories [12]: feature point approach and error tolerance approach. This paper addresses those methods of error tolerance approach through polygonal approximation, which comprises the techniques for adjusting a curve with the least number of segments or partitions given a maximum error [13].
The polygonal approximation is implemented by means of several methods: Split, Split-and-Merge and Merge [13]. The main drawback for the methods Split and Split and Merge is the need of multiple iterations and the approximation results may be far from the optimum if a poor initial segmentation is used [14]. On the other hand, the technique of Merging makes the performance of the algorithms more efficient [15], regarding the number of iterations, and has the advantage of small finite memory and high speed [16]. That is why the technique of Merge is addressed in this work.
The adjustment of segments to a curve is based on several measures of error, for instance: Cone Intersection [17], Strip [17], Perpendicular distance of points to a fitted line [18], Least Square Method [19] and Minmax approximation [20]. Here, Cone Intersection method is investigated, since it is fast, practical and simple [21].
The slope estimation of segments in Fig. 3 b) can be accomplished by means of two steps: The determination of points of change (B and C) through the cone intersection method, and the estimation of the average slope between such points; both procedures are described in the subsequent Subsections.
In case that the higher frequency is received, the average slope at the output of the discrete correlator, for the in phase branch, is described by  , where φp is the angle conformed by the segment,
  and the x axis, as indicated in Fig. 3 b). The terms Ac, φ0 and φL represent the amplitude of the carrier, the phase of the received symbol and the phase of the local oscillator, respectively. For the quadrature branch the average slope is
  . The effect of the phase can be neglected when both results are squared and added, yielding
 , resulting in the receiver depicted in Fig. 2. In case that the lower frequency is received, the output will be approximately zero. With these levels the demodulation can be accomplished by means of a proper threshold as illustrated in Fig. 3 d), and described in Data Recovery.
Cone intersection Method
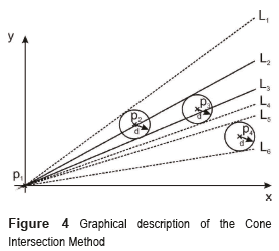
The method of Cone Intersection clusters several points into a linear behavior regarding the possibility of passing a line through circled areas defined around each point. Fig. 4 depicts an example of such a case with 4 points. Taking into account the initial point P1, the method finds the intersection of the cones, which is conformed by the initial point P1 and the circles around each point. By way of example, the cone defined by the lines L2 and L3 is the intersection of two cones, the one conformed by L1 and L3 and the one conformed by L2 and L4. In this case, the cone intercepts the area conformed by the circles around P2 and P3, but this is not the case for the circle of P4. In this case, the points P1, P2 and P3 are considered to be aligned, since it is possible to find a line that intercept P1 and the areas defined by the circles of P2 and 3. However, it is not possible to find the interception between the cone defined by L2 and L3 and that one of L5 and L6. In such case, the point P4 is not aligned with the previous point, and the method restarts again with P4.
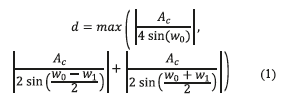
This procedure is applied to the signal at the output of the correlator in Fig. 2. The distance d is defined by also taking into account the amplitude of the oscillation at the output of the correlator, as depicted in Fig. 3 c). This can be determined as indicated in (1), w0 and w1 indicate the higher and the lower frequencies of the modulation. The dotted line in Fig. 3 b) shows simulation results where the change of slope occurs with the measure for d according to (1).
With the method described, the key points are obtained where a change of slope happens. The second step is to determine the slope between such key points, which is described in Slope Estimation.
Slope Estimation
In the method described in [22], the samples between B and C in Fig. 3 b) are replaced by the line that merges both. However this method represents a disadvantage since the optimal solution, for the line that fits the set with the less error, shouldn't be restricted to be the one conformed by B and C [20]. Here the slope between these points is estimated by averaging the results for each point. Let the line  represents the ramp behavior described by the segment
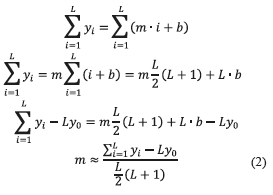
  in Fig. 3 b), the slope m can be estimated after averaging as indicated in (2) between the points B and C, where L represents the length in samples of the segment in the x axis. Here, the term Ly0 is subtracted in order to cancel the term L•b on the third step, where y0 denotes the ordinate of the point. The algorithm presented in (2) is characterized by its simplicity and ease of implementation.
The final result is then obtained by squaring the output of the in phase and quadrature branch adding both terms; the result is shown in Fig. 3 d). The high level corresponds to the transmission of data with high frequency, the low level to the transmission of symbols with low frequency.
The average slope at the output of the correlators, for the in phase and quadrature branches, are described by  and
and  respectively when the frequency received is equal to that of the local oscillator, and 0 otherwise. In this case, after squaring and adding, as indicated in the scheme of Fig. 2, the result is
  and 0 on each case.
A reasonable level for the threshold can be determined by  , this quantity represents the half of the output of the proposed receiver. This is needed for identifying the high from the low levels in Fig. 3 d) in order to recover de bits transmitted. This choice for the threshold increases the margin noise and the imperceptible oscillations at the output are not considered.
Hardware Complexity
For each point of curve, the method of cone intersection determines the quantities given in equation (3). Taking into account the in phase and quadrature branch, the number of floating adders and multipliers required is. Besides, adding to this result the elements required in the expression (2) for the slope estimation algorithm, the number is increased to. Finally, considering the elements for the discrete correlator and the square procedure in Fig. 2, the total number of adders and multipliers results in.

Data Recovery
The recovery of the binary levels from a BFSK waveform using the scheme in Fig. 3 has been described. Here the discussion about the performance of digital information associated with the binary data is presented.
After the high and low levels have been recovered, as indicated in Fig. 4, it is needed to obtain the total amount of ''1's'' and ''0's'' represented under each level. The length in time of a ''1'' or a ''0'' is given by the time-symbol parameter and is denoted by Ts. The comparison of the length of the level and Ts will introduce the quantity of ''1's'' and ''0's'' under each level. However, this comparison is prone to errors since the transition of each level is not abrupt; in this case there is an upper bound on the total of bits to be analyzed. Here this situation is analyzed giving a closed form expression for determining the quality of the reception.
The algorithm for recovery the data is as follows:
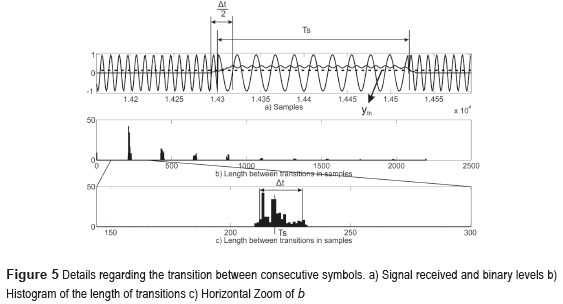
- Sketching a histogram where the abscissa represents the length of a transition in samples; the amplitude is given by the number of occurrences of these lengths. An example is given in Fig. 5 b), the abscissa represents the duration of the interval in a). This histogram is used for the estimation of the symbol duration.
- The histogram is comprised of maximal as indicated in Fig. 5 b) and the maximum closer to zero is related to the symbol duration, leading to the Ts estimation as indicated in Fig. 5 c). The estimation of Ts is obtained with Eq. (4), in which N1 and N2 represent the interval of the x-axis (e.g. N1=200 and N2=200 in Fig. 5 c), where the histogram has values unequal to zero), Tm represents the sample period, and h[k] represents the values of the histogram obtained.

The length of the high levels in Fig. 5 are established by the intersection of the output of the system with the threshold  determined in Slope Estimation. In this case, the length of this measure is modified from symbol to symbol by the smooth transition between levels. The accuracy in the determination of Ts, denoted by Δt, could be estimated by calculating the deviation as indicated in Fig. 5 c). The parameters Ts and Δt are related to the binary levels just as indicated in (5).

- Once  is obtained, the transmitted digital information is recovered by dividing the length of each level, obtained by the interceptions between the output of the system and the threshold
  with the time-symbol parameter estimated. The total of bits represented is recovered by rounding the result towards the nearest integer.
The accuracy to be obtained on the third step depends on the variance Δt. If k identical symbols are supposed to be transmitted sequentially, then the level in the output of Fig. 2 will have a duration given by k•Ts plus the variance Δt. If this resulting duration is divided by Ts plus the same Δt, then the total bits to be recovered can be described by the expression (6). Using Laurent expansion and considering  we obtain:

Expression (6) considers the addition of the variance instead of substraction because the linear components in the system of Fig. 2 tends to expand the transitions and not to contract. Besides, the same variance is also considered on each transition as a simplification in the determination of accuracy. This considers that the system responds in the same way no matter the total symbols received.
An error in the estimation of k occurs when the second term in (6) is higher than 0.5. In such a case, the estimated value will be superior to  =k+1 and the correct value is k. Hence, in the absence of noise the occurrence of consecutive symbols is limited in order to perform an error reception free.
Equation (7) represents the upper bound for k when Ts and Δt are substituted by  and
and  respectively, since both values are obtained via the histogram. Expression (7) gives an idea about how many bits the system in Fig. 2 might be received without errors in the absence of noise. Indeed, the probability of transmitting kbits comprised of repetitive sequences of ''1's'' and ''0's'' is
  so an error could happen once in 2k+1 transmitted bits. This is why the receiver is upper bounded in the total of bits to be processed. The relation (7) is a closed form expression that represents a figure of merit for the receivers analyzed, and its values are analyzed in Precision.

Results
Three key aspects are considered for comparing the proposed solution with the systems reported:
- Hardware Complexity
- Precision through relation (7)
- Bit Error Rate (BER) performance.
Hardware Complexity
In regard to hardware complexity, the Balanced Quadricorrelator is implemented with four filters, two for the lowpass filter and two for implementing the discrete time differentiator. The differentiator can be implemented by means of a FIR filter with fifth order [23], each one with 6 multipliers and 6 adders. This requires the use of 22 floating adders and multipliers when considering both branches. Besides, taking into account the adders and multipliers in the system of Fig. 1 the total is increased to 27, without considering the lowpass filters.
On the other hand, the total of adders and multipliers for implementing the scheme proposed in Fig. 2 is 27 without the use of filters, while in case of the Balanced Quadricorrelator, the elements needed are 27 and two additional filters. A reduction is obtained in the sense that the uses of digital filters are avoided.
Precision
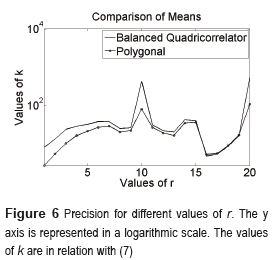
Regarding precision, obtained by means of (7), the quantity depends on the parameters of the modulation format. The BFSK waveform is driven by three parameters, ƒ0, ƒ1 and Ts, which are related to each other by ƒ1= ƒ0+m/Ts. Simulations are made by keeping ƒ0=1000 [Hz] constant and varying Ts and m as indicated in (8).
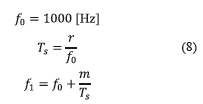
family of curves for the k parameter in (7) can be obtained when r is the independent variable and m is evaluated for several values. The simulations show that precision is not to much affected with changes in m but with changes in r, these curves are almost the same when m≥4. Figure 6 shows in average the results for both systems, the Balanced Quadricorrelator and the Polygonal approximation. The graphic is conformed by averaging the different values given by the variation of m when r is fixed, m is considered in the interval 2 to 20.
The curves depicted in Fig. 6 show that the Balanced Quadricorrelator is superior for almost every value of r, where r is defined as indicated in (8). This can be explained by the fact that the Quadricorrelator performs the operations locally, mainly with the use of discrete-time differentiators, while the proposed scheme determines transitions with the information of several points, which in turns smooth the transitions between levels making it more inaccurate.
BER Parameter
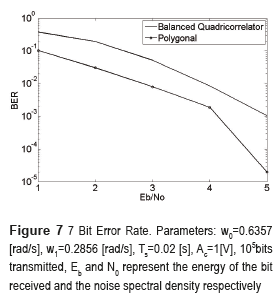
The Bit Error Rate of the proposed receiver is compared with the Balanced Quadricorrelator in Fig. 7. Simulation results indicate that they have similar performance. The range analyzed is below an  of 5 [dB] since up to this value error correcting codes are usually employed [24], Eb and N0 represent the energy of the bit received and the noise spectral density respectively.
Conclusions
In this paper a new low complexity demodulation scheme is given, which shows similar error performance as the Balanced Quadricorrelator. High-order filters are avoided thanks to one important matter: the symbol detection is accomplished through an algorithm based on slope recognition at the output of Sampler Correlator. This element represents the bridge between digital demodulation and curve segmentation techniques. Based on this procedure, new digital demodulators for BFSK waverform can be developed by means of curve segmentation techniques with reduction in complexity.
References
1. M. Lont, D. Milosevic, G. Dolmans, A. Roermund. ''Implications of I/Q Imbalance, Phase Noise and Noise Figure for SNR and BER of FSK Receivers''. IEEE Trans. Circuits Syst. Regul. Pap. Vol. 60. 2013. pp. 2187-2198. [ Links ]
2. K. Peng, C. Lin, C. Chao. ''A Novel Three-Point Modulation Technique for Fractional-N Frequency Synthesizer Applications''. Radioengineering. Vol. 22. 2013. pp. 269-275. [ Links ]
3. I. Vertát, J. Mráz. ''Hybrid M-FSK/DQPSK Modulations for CubeSat Picosatellites''. Radioengineering. Vol. 2. 2013. pp. 389-393. [ Links ]
4. B. Sklar. Digital Communications, Fundamentals and Applications. 2nd ed. Ed. Prentice Hall. New Jersey, USA. 2001. pp. 124-125. [ Links ]
5. K. Farrell, P. McLane. ''Performance of the cross-correlator receiver for binary digital frequency modulation''. IEEE Trans. Commun. Vol. 45. 1997. pp. 573-582. [ Links ]
6. H. Kang, D. Kim, S. Park. Coarse frequency offset estimation using a delayed auto-quadricorrelator in OFDM-based WLANs. Proceedings of the 3rd International Congress on Ultra Modern Telecommunications and Control Systems and Workshops (ICUMT). Budapest, Hungary. 2011. pp. 1-4. [ Links ]
7. G. Ordu, A. Kruth, S. Sappok, R. Wunderlich, and S. Heinen. A quadricorrelator demodulator for a Bluetooth low-IF receiver. Proceedings of the IEEE Radio Frequency Integrated Circuits (RFIC) Symposium, Digest of Papers. Forth Worth, USA, 2004. pp. 351-354. [ Links ]
8. R. Yang, S. Chen, S. Liu. ''A 3.125-Gb/s clock and data recovery circuit for the 10-Gbase-LX4 Ethernet''. IEEE J. Solid-State Circuits. Vol. 39. 2004. pp. 1356-1360. [ Links ]
9. P. Egau. ''Correlation systems in radio astronomy and related fields''. IEE Proceedings F, Commun. Radar Signal Process. Vol. 131. 1984. pp. 32-39. [ Links ]
10. T. Ahn, C. Yoon, Y. Moon. An adaptive frequency calibration technique for fast locking wideband frequency synthesizers. Proceedings of the 48th Midwest Symposium on Circuits and Systems. Vol. 2. Ohio, USA. 2005. pp. 1899-1902. [ Links ]
11. Y. Lee, T. Cheatham, J. Wiesner. ''Application of Correlation Analysis to the Detection of Periodic Signals in Noise''. IRE. Vol. 38. 1958. pp. 1165-1171. [ Links ]
12. J. Iñesta, M. Buendí, M. Sarti. ''Reliable polygonal approximations of imaged real objects through dominant point detection''. Pattern Recognit. Vol. 31. 1998. pp. 685-697. [ Links ]
13. Y. Zhu, L. Seneviratne. ''Optimal polygonal approximation of digitised curves''. IEE Proc. Vis. Image and Signal Process. Vol. 144. 1997. pp. 8-14. [ Links ]
14. P. Yin. ''Ant colony search algorithms for optimal polygonal approximation of plane curves''. Pattern Recognit. Vol. 36. 2003. pp. 1783-1797. [ Links ]
15. C. Fahn, J. Wang, J. Lee. ''An adaptive reduction procedure for the piecewise linear approximation of digitized curves''. IEEE Trans. Pattern Anal. Mach. Intell. Vol. 11. 1989. pp. 967-973. [ Links ]
16. J. Sklansky, V. Gonzalez. ''Fast polygonal approximation of digitized curves''. Pattern Recognit. Vol. 12. 1980. pp. 327-331. [ Links ]
17. D. Eu, G. Toussaint. ''On Approximating Polygonal Curves in Two and Three Dimensions''. Cvgip Graph. Models Image Process. Vol. 56. 1994. pp. 231-246. [ Links ]
18. K. Ku, P. Chui. ''Polygonal approximation of digital curve by graduate iterative merging''. Electron. Lett. Vol. 31. 1995. pp. 444-446. [ Links ]
19. B. Ray, K. Ray. ''Determination of optimal polygon from digital curve using L1 norm''. Pattern Recognit. Vol. 26. 1993. pp. 505-509. [ Links ]
20. Y. Kurozumi, W. Davis. ''Polygonal approximation by the minimax method''. Comput. Graph. Image Process. Vol. 19. 1982. pp. 248-264. [ Links ]
21. K. Wall, P. Danielsson. ''A fast sequential method for polygonal approximation of digitized curves''. Comput. Vis. Graph. Image Process. Vol. 28. 1984. pp. 220-227. [ Links ]
22. C. Williams. ''An efficient algorithm for the piecewise linear approximation of planar curves''. Comput. Graph. Image Process. Vol. 8. 1978. pp. 286-293. [ Links ]
23. A. Oppenheim, R. Schafer. Discrete-time signal processing. 3rd ed. Ed. Prentice Hall. Upper Saddle River, USA. 2010. pp. 550-553. [ Links ]
24. A. Carlson, P. Crilly, J. Rutledge. Communication Systems: An introduction to Signals and Noise in Electrical Communication. 4thed. Ed. McGraw-Hill. New York, USA. 2002. pp. 555-556. [ Links ]


