


Serviços Personalizados
Journal
Artigo
 Inglês (pdf)
 Artigo em XML
 Referências do artigo
 Enviar este artigo por email
Indicadores
-
 Citado por SciELO
 -
 Acessos
Links relacionados
-
 Citado por Google
 -
 Similares em
SciELO
Similares em
SciELO -
 Similares em Google
Compartilhar

 Permalink
Revista Facultad de Ingeniería Universidad de Antioquia
versão impressa ISSN 0120-6230
Rev.fac.ing.univ. Antioquia no.75 Medellín abr./jun. 2015
https://doi.org/10.17533/udea.redin.n75a09
ARTÍCULO ORIGINAL
DOI: 10.17533/udea.redin.n75a09
Performance of a Genetic Algorithm applied to robust design in multiobjective systems under different levels of fractioning
Desempeño de un Algoritmo Genético aplicado a diseño robusto en sistemas multiobjetivo bajo diferentes niveles de fraccionamiento
Enrique Canessa-Terrazas1*, Héctor Allende-Olivares2
1 Facultad de Ingeniería y Ciencias, Universidad Adolfo Ibáñez. Av. Padre Hurtado 750. C.P. 2540201. Viña del Mar, Chile.
2 Departamento de Informática, Universidad Técnica Federico Santa María. Av. España 1680. C.P. 2390123. Valparaíso, Chile.
* Corresponding author: Enrique Canessa Terrazas, e-mail: ecanessa@uai.cl
(Received July 31, 2014; accepted November 19, 2014)
Abstract
This paper studies the performance of a Genetic Algorithm (GA) to find solutions to problems of robust design in multiobjective systems with many control and noise factors, representing the output vector in a single aggregation function. The results show that the GA is able to find solutions that achieve a good adjustment of the responses to their corresponding target values and with low variability, even with highly fractional experimental designs, which provide a limited number of data points to be fed to the GA. This conclusion is important for the practical application of the GA to robust design studies. Generally, such studies are carried out using scarce resources and dealing with other limitations, which force the engineer to use few experimental treatments and gather a limited amount of data. Thus, knowing that the GA performs well under such situation expands its applicability.
Keywords: Taguchi methods, parameter design, genetic algorithms, performance analysis
Resumen
Este trabajo estudia el rendimiento de un Algoritmo Genético (AG) para encontrar soluciones a problemas de diseño robusto en sistemas multiobjetivo, con muchos factores de control y ruido, representando el vector de salida en una sola función de agregación. Los resultados muestran que el AG es capaz de encontrar soluciones que entregan un buen ajuste de la media de las respuestas a sus respectivos valores objetivo y con baja variabilidad, incluso con diseños experimentales altamente fraccionados, los cuales proveen de un número limitado de datos que se ingresan al AG. Esta conclusión es importante para la aplicación práctica del AG a estudios de diseño robusto. Generalmente, dichos estudios son llevados a cabo usando recursos escasos y lidiando con otras limitaciones, lo que obliga al ingeniero a usar pocos tratamientos y recoger una cantidad limitada de datos. Por eso, saber que el AG se comporta bien bajo esas situaciones, expande su aplicabilidad.
Palabras clave: métodos de Taguchi, diseño de parámetros, algoritmos genéticos, análisis de rendimiento
Introduction
Robust design (RD) is a methodology developed by Genichi Taguchi [1] that tries to adjust the mean of the responses of a system as close as possible to their corresponding target values and simultaneously attempts to achieve low variability in those responses, even in the presence of noise factors. To do so, Taguchi proposes a two stage methodology labeled Parameter Design (PD). First, an engineer identifies and sets values of controllable factors of the system to achieve mean adjustment and then, he/she sets other control factors to get low variability under different noise conditions [1]. The application of PD has had a profound worldwide effect on enhancing the quality of products and services in many industries [1-6]. To facilitate parameter design studies, the work presented in [7, 8] developed a tool based on Genetic Algorithms (GA), which automatically finds the levels of control factors that achieve mean adjustment and low variability in all responses. Given that other researchers have also explored the application of GA to robust design (e.g. [2, 9, 10] to name just a few), it was sensible to apply the same optimization algorithm for developing such tool. Some newer optimization algorithms might also have been applied, but there is no evidence that they could always and consistently outperform GAs [11, 12]. Moreover, the GA developed in [8] is readily generalizable to multiobjective systems with many outputs, control and noise factors, and uses the parameter design approach, which is frequently applied in real studies of robust design [3-6]. In following Taguchi's idea that many quality problems may be tackled using simple methods [1], the GA handles multiobjective systems by collapsing the mean and variance of the outputs in a single aggregate fitness function (similar to what Taguchi does in PD by using the so called Signal to Noise Ratio (SNR) [1]). Although this approach is simple, it is a valid one and the GA has been applied to different real RD problems at many firms with good results [6, 8]. Examples range from adjusting the width of the painted strip of a car painting system to enhancing copper-mining operations [6, 8]. However, one main concern regarding the application of the GA to robust design is that an engineer will normally have limited time and economic resources to conduct the study [1, 5, 6]. Thus, generally, the engineer uses highly fractional experimental designs to gather the data for the analyses [1, 5, 6]. Hence, as the fractioning level increases, the amount of collected data decreases, which might lessen the performance of the GA. Therefore, the main focus of this paper is to analyze the ability of the GA to find good solutions to problems of robust design under different fractioning levels of the experiments used in gathering the data. In line with Taguchi's quality approach [1], we acknowledge that this work addresses rather specific type of problems, leaving out more encompassing issues, which are much harder to solve [11, 12]. However, to the best of our knowledge, such analysis has not been elsewhere conducted and still for many developing countries, enhancing specific production and/or service processes is worthwhile doing. Finally, a secondary objective of this paper is to experiment with some parameters of the GA, which might also impact its performance, but keeping the original mechanisms implemented in the GA.
Some details of the Genetic algorithm used in robust design
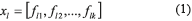
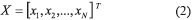
This part of the paper introduces some aspects of the developed GA necessary for understanding the analysis that was performed in the present study. More details of the GA may be found in [7, 8]. The GA developed in [8] represents the combinations of k control factors that may take s different levels (values) of a robust design experiment using an integer codification. One chromosome will be composed by a combination of different levels for each factor, which corresponds to a particular treatment of the experiment. Let flj be the factor j of chromosome l, with j = 1, 2, …, k and l = 1,2, …, N. Each flj can take the value of a given level of the factor j, that is 1, 2, …, s. One chromosome (or solution) is expressed as a row vector (see Eq. 1). The matrix representing the total population of solutions X will be composed of N chromosomes (see Eq. 2).
Each of the chromosomes (solutions) xl will generate a different response y of the system when the control factors are set to the corresponding levels specified in the chromosome xl. The GA searches through the space of possible treatment combinations, finding the combinations that minimize the variance of the responses and adjust their means as close as possible to their corresponding target values. The fitness function used to guide the GA for each response is the following (Eq. 3):

where T is the target value for Nominal the Better (NTB) quality characteristic, and `y(xl) and s2(xl) are the corresponding mean and variance of the solution represented by chromosome xl,
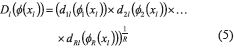
A multiobjective system will have more than one response (in general, r = 1,2, …, R responses) and hence, one fitness function for each of them. Following the work presented in [13, 14], the total fitness function for multiobjective systems will be expression (4), which consists of a desirability function D(f(xl)) and a penalty function Pl((y(xl)):

where y(xl) is the generic form of designating all the responses of the treatment combination xl. Thus, the penalty function will depend on all the replications of all the responses of the system. Each element of expression (4) can be decomposed into expressions (5) and (6) according to [14]:

Moreover, each element of the penalty function (6) can be expressed as expression (7) shows [14]:
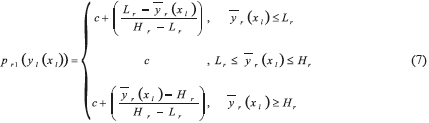
Each response yr has a target value Tr and a lower and upper limit given by Lr and Hr respectively, in which Lr<Tr<Hr ∀r , r = 1, 2, ..., R. For chromosome xl to be feasible, the corresponding response must be within those limits ( ). The constant c avoids pr from becoming zero if infeasible cases arise, and thus ensures that a non-zero P is calculated for a non-feasible solution (see (6)). A value of 0.0001 is assigned to c, which does not influence the value of the final solution (see [14]).
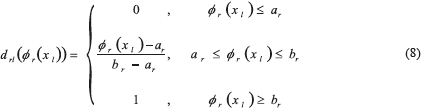
The desirability function must also have a lower and upper limit for each of the elements drl(fr(xl)) (see expression (5)), called the desirability limits [14]. Expression (8) presents the desirability function, where br corresponds to the most desirable case and ar to the least desirable case:
Parameter br may be expressed by equation (9), using the minimum variability attained in the treatment combinations of the initial experiment performed and assuming that response r is at its target value Tr:

The value of ar corresponds to the least desirable case, where the variance of the response is a maximum and the mean of it is at any of the two limits (Hr or Lr). Thus, parameter ar may be calculated using expression (10):

From expressions (3) through (8), one can see that in the fitness calculation, the GA needs to know the responses corresponding to the experimental treatment, which each chromosome represents. However, some of those treatments might not have been part of the experiment that the engineer conducted to gather the data. Thus, the GA needs to estimate those responses. For estimating the mean of a response for a non-tried chromosome (treatment), the GA calculates the main effect of each of the treatment levels on the response and a grand mean using all the observations corresponding to the experiment that was carried out. Then, the GA adds to the grand mean, the corresponding main effects of the levels indicated by the chromosome. For estimating the variance of the response for a non-tried chromosome (treatment), the GA uses a similar procedure. The GA first computes a global variance considering all the replications of all the treatments tried in the original experiment. Then the GA calculates the main effect of each control factor on the variance. Finally, the GA sums the main effects of the levels indicated in the chromosome to the global variance. Those procedures correspond to a linear estimation usually applied in the Taguchi method [1]; for a worked out numerical calculation, see e.g. [1] page 16. In the search process, the GA uses roulette selection, a uniform crossover and a bit by bit (factor by factor) mutation operator. The GA employs a stopping criterion of reaching 3000 chromosomes in the population, a crossover probability of 0.3 and a mutation probability of 0.05.
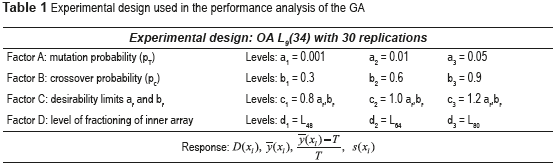
Experimental design for the GA's performance analysis
The main objective of this study was to evaluate the performance of the GA under different fractioning levels of the experimental design used to gather the data. However, one can also change the value of other parameters of the GA that were kept constant in previous studies [7, 8]. That entails identifying the most relevant factors to be manipulated, and the experimental design and performance measures to be used.
Identification of experimental factors
A previous analysis suggested that the performance of the GA may be influenced by the experimental design that the robust design study uses [7]. Specifically, the level of fractioning in such design will determine the number of data points that the GA will have for beginning the search process. Since a GA's long-term performance is also influenced by population size [15, 16], which depends on its initial size, one may conclude that the level of fractioning should impact the GA's ability to find good solutions. Moreover, remember that the GA developed for robust design needs to estimate missing values and thus, the number of missing values that the GA will need to estimate depends on the number of data points fed to the GA. Since those missing values are only approximate estimates of the true unknown ones, it is reasonable to think that the more missing values the GA has to estimate, the lower its performance will be. Thus, the higher the fractioning level of the experimental design, the larger the number of missing values that the GA will need to estimate and, the poorer its performance may be. The level of fractioning is also an important parameter to be considered, since in robust design, the experimenter generally tries to use highly fractional designs to lower the cost of the experiments [1, 5, 6]. Thus, from a practical point of view, assessing how well the GA behaves under different levels of fractioning will set a limit on the experimental designs that may be used with the GA in robust design studies. With regard to other parameters of the GA, a revision of relevant literature shows that there exist many studies that consistently find that the crossover probability (pc) and the mutation probability (pT) have an important effect on a GA's performance [15-21]. Thus, it is sensible to include both parameters in the experiment. Additionally, the same above-mentioned studies found that values of parameters associated to the calculation of the fitness function were also relevant, because they allow to more finely or coarsely discriminate among solutions. In the present study, since the desirability limits ar and br play an important role in the calculation of the value of the desirability functions, the experiment should consider them.
Finally, one should note that there exist other parameters and mechanisms that might influence the performance of the GA [15-19, 21], but some of them are not applicable to the present situation (e.g. size of generation gap) and other would substantially alter the GA (e.g. parent selection strategy, cross-over and mutation mechanisms), which if changed, would not permit the comparison with previous results.
Experimental design and levels of factors
Having identified the four factors that will be used in the experiments, the study needs to establish the experimental design and the levels of the factors. To be able to appreciate whether non-linearity exists in the effects, the experimental design will correspond to an Orthogonal Array (OA) L9(34). This OA allows analyzing main effects using a convenient number of experimental conditions. However, it omits interaction effects. Given that in preliminary experiments with the GA, no interaction effects were found, it is more important to focus the analysis on non-linearity of main effects. The OA L9(34) specifies three levels for each factor. In order to be able to use previous studies [7, 8] as a base scenario, one of the levels of the identified factors will be the same values used in those research papers. Regarding the fractioning levels, in [7, 8], the authors applied an inner OA L64(410) for the 10 control factors and an outer OA L16(45) for the 5 noise factors. Thus, the product array has 64 times 16, 1024 design points. This study will keep the outer OA, since robust design literature suggests that a small number of noise factors and levels for them be considered [1, 5, 6]. Regarding the inner array, a L48(410) and a L80(410) were selected as alternatives for the present analysis. Using those OAs, each experiment will have 768 treatment combinations (L48(410) x L16(45)), 1024 combinations (L64(410) x L16(45)) and 1280 combinations (L80(410) x L16(45)). That implies a percentage difference in data points among experimental designs of - 40% when comparing the extreme cases (1280 with 768), - 20% (1280 with 1024) and – 25% (1024 with 768). Note that we selected OA's with high fractioning levels, given that in robust design that is a common practice [5, 6]. As robust design interventions are normally carried out in a short time, due to restrictions in the downtime of processes and economic resources to conduct experiments, only a limited number of treatments is tried [5, 6]. Though using lower levels of fractioning in this work might have better allowed exposing the effect of fractioning level on the performance of the GA, that would have been irrelevant from a practical viewpoint, i.e. we would have used low fractioning levels that are almost never used in robust design interventions.
In the case of crossover and mutation probability, the study will employ the values used in previous analyses [7, 8], which are pc = 0.3 and pT = 0.05. The other two levels will correspond to values similar to the ones used in previous studies [15, 22], pc = 0.9 and 0.6, and pT = 0.01 and 0.001. For parameters ar and br, the analysis will consider a value equal to the one used in [7, 8], and the other two levels will be equal to 0.8 and 1.2 times ar and br.
Responses to be measured
In previous studies of the GA, the analysis has used different case studies. One of such case studies involved the optimization of the four responses of a system simulator independently from each other. Thus, the GA was dealing with four different single objective systems, each with ten control factors and four noise factors. Additionally, a second case study used the same simulator, but the GA simultaneously optimized the four responses, which means that the GA was handling a four-dimensional multiobjective system. The present study will use the same two case studies. More details of the simulator and case studies may be found in [7, 8]. Note that these simulated systems are representative of real processes subject to robust design studies, and thus our conclusions are applicable to such situations [3-6]. For the single objective systems, the experiment will measure the desirability function of each response D((xl)) for the chromosomes delivered by the GA (see Eq. (4)), since that function aggregates both mean adjustment and variance reduction. Additionally, the analyses will consider the value of the mean of the response and its corresponding adjustment to its target value and the standard deviation of the response. In the case of the multiobjective system, the study will analyze the overall aggregated desirability for the four responses (see eqs. (4), (5) and (6)), and also mean adjustment and standard deviation for each of the four responses. Table 1 shows the experimental design. Each treatment combination will be run 30 times in the GA, so that the ANOVA may achieve a statistical power of around 80% to 85%, which was calculated using the table provided in [23], and data collected in previous work.
Experimental results and analysis
Given that this study needs to conduct controlled experiments with specific levels of fractioning, to test the GA a simulator was built, which is described in detail in [7, 8]. This simulator has four responses, ten control factors and four noise factors and interactions among the factors. Thus, compared with real studies of RD, this simulator represents difficult to optimize systems [1, 4-6]. It should also be noted that we have applied the GA to solve RD problems in real systems, ranging from adjusting the width of the painted strip of a car painting system to enhancing copper-mining operations [6-8], which lends credibility to the application of the GA to real systems.
Results obtained for the single objective systems
For the following case studies, the four responses of the simulator are optimized independent from each other, so that the GA deals with four single objective systems. For each experimental treatment shown on Table 1, the algorithm was run 30 times. Table 2 presents the results for response one of the single objective system. This table shows the experimental design corresponding to OA L9(34), along with the average value of the desirability function and the average value of response y1, the average percentage difference of y1 with regard to its corresponding target value (T = 200) and the average standard deviation of y1. These averages were calculated using the results of the 30 runs for each experimental treatment and considering the best five solutions delivered by the GA in each run. Additionally, Table 2 presents the statistically significant effects of the factors on those outputs. The effects were calculated using the following contrasts: effect F1 = (average of the corresponding response for level 3 of factor F) - (average of the corresponding response for level 1 of factor F), and effect F2 = (average of the corresponding response for level 2 of factor F) - (average of the corresponding response for level 1 of factor F). For example, for the effect of factor C on the average desirability function (DF) of y1: C1 = (.95 + .97 + .97) / 3 - (.91 + .90 + .92) / 3 = 0.0533, and C2 = (.95 + .95 + .94) / 3 - (.91 + .90 + .92) / 3 = 0.0367. Note that in the case of the effects on average percentage difference with regard to the target value, these were calculated using the absolute value of such percentages. That was done, since the percentage difference may be positive or negative, thus the positive values might be cancelled out by the negative ones. The results presented on Table 2 indicate that there are no large differences in the performance of the GA under the nine different treatments. Only effects C1 and C2 on the value of the desirability function (DF) are partially statistically significant. Figure 1 (a) also shows that factor C has the most important impact on DF. Remember that level C1 corresponds to 0.8 ar and br, C2 is equal to ar and br, and C3 represents 1.2 ar and br. Thus, the larger the values of ar and br, the less strict the calculation of DF will be. Hence, from a practical point of view, although DF might be larger, that does not mean that the adjustment of the response to its target value will necessarily be tighter and/or that the standard deviation of the response will be smaller. Figure 1 (a) also suggests that factor D (level of fractioning) may affect DF and that its effect may be non-linear. However, the corresponding ANOVA does not confirm the visual conclusion (for effect D, p-value = 0.70).
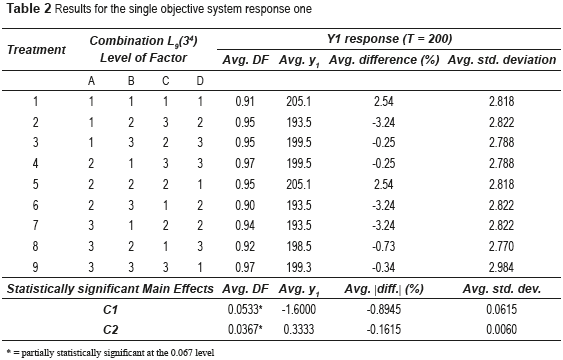
Table 3 shows the same figures, but for response two of the single objective system. The treatment combinations are not repeated in this table, since they are the same already presented in Table 2. For response two, Table 3 indicates that factor D significantly impacts the average standard deviation attained by response two. In general, for level d3 (L80) the GA obtains a larger average standard deviation of response two than for level d1 (L48). This means that the GA obtains a good variance reduction even for high levels of fractioning, which is a positive aspect for robust design studies.
Turning to Figure 1 (b), though the lines representing factors C and D might indicate that the effects of those two factors on DF may be important, the ANOVA indicates that the corresponding effects on DF are not statistically significant (p-value = 0.70).
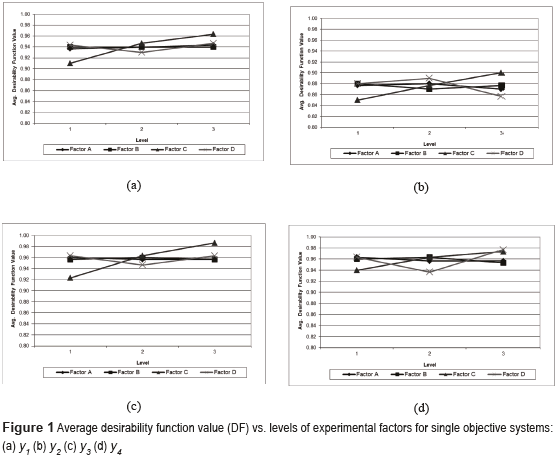
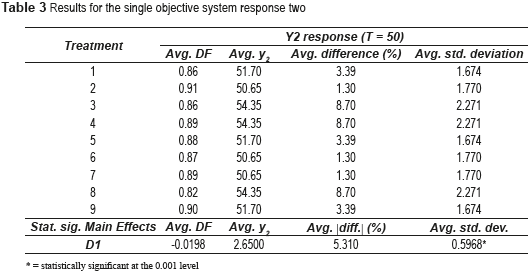
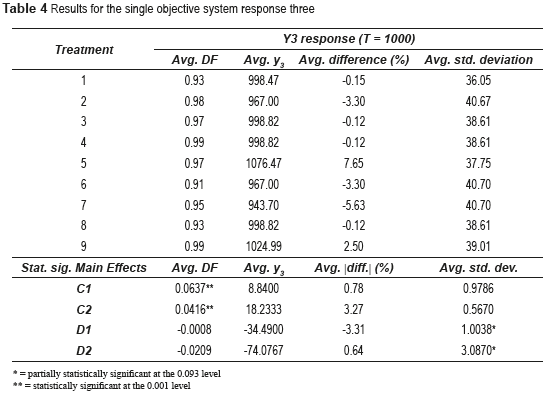
Table 4 shows the results for response three, which reveals that factor C has a significant effect on DF and factor D a partially significant effect on the average standard deviation. Although the effects of those two factors on the average response y3 seem to be also important, the ANOVA shows the contrary, reaching p-values equal to 0.438 and 0.110 respectively. The effects of the factors on DF are visually shown on Figure 1 (c). Inspection of Figure 1 (c) shows the significant effect of factor C on DF. As with response one, this effect is attributed to the looser desirability bounds that those larger values of ar and br bring about. Regarding the effect of factor D on the average standard deviation, it can be concluded that higher levels of fractioning may not be detrimental to variance reduction.
Finally, Table 5 and Figure 1 (d) present the averages and statistically significant effects for response four. Table 5 shows that for response y4, the effects of factor D on all of the outputs are statistically significant. For factor C, the effect C1 on DF is partially significant and C2 is significant. As before, a larger value of ar and br augments DF. This can be clearly seen on Figure 1 (d). Regarding factor D, Figure 1 (d) visually corroborates that the effect D1 on DF is positive, which means that comparing level d3 with d1, DF increases as the level of fractioning decreases. However, effect D2 on DF indicates that the contrary happens for levels d2 and d1. A negative effect D2 implies that DF diminishes as the level of fractioning decreases.
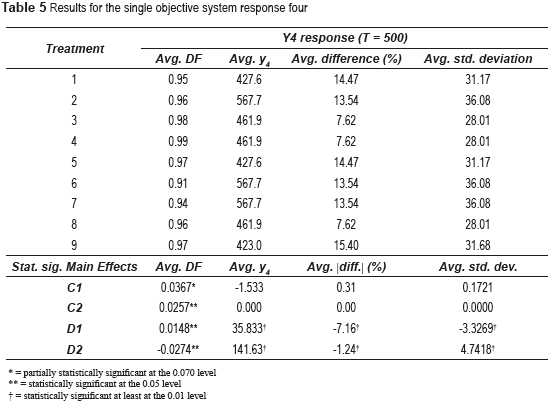
Thus, the effect of the level of fractioning on DF seems to be highly non-linear. The effects of factor D on the average response y4 and mean adjustment imply that as the level of fractioning decreases, mean adjustment gets tighter. This conclusion seems intuitively correct. However, since it is not the same for each of the four responses, it must be treated with caution. Regarding variance reduction, the effect D1 is negative, which at first might imply that the smaller the fractioning level, the smaller the standard deviation that response y4 gets. Nevertheless, a positive effect D2 shows that the effect of factor D on standard deviation is highly non-linear. The standard deviation of response y4 increases from level d1 to d2 and then decreases from level d2 to d3. Thus, one cannot say that a higher level of fractioning is necessarily detrimental to variance reduction.
In summary, for the four single objective systems as a whole, the previous analyses show that there are no big effects of crossover and mutation probability on the performance of the GA. On the other hand, the desirability limits impact DF. As ar and br increase, DF also augments. The other factor that influences the value of DF is the level of fractioning of the experimental design. However, there is no clear conclusion regarding whether high levels of fractioning necessarily decrease DF. This is a positive conclusion, since it indicates that the performance of the GA is not strongly influenced by high levels of fractioning.
Results obtained for the multiobjective system
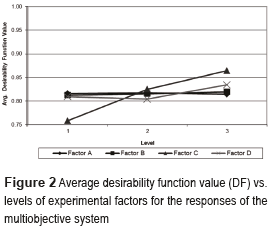
This case study used the same simulator and the same experimental design as before, but the GA optimized the four responses at the same time. This means that the GA is optimizing a four–dimensional multiobjective system. As in the previous analysis, 30 runs were carried out for each of the nine experimental treatments. Table 6 shows the figures for the multiobjective system, where only the statistically significant effects are displayed. The results shown in Table 6 are almost the same as the ones shown on the tables corresponding to the single-objective systems. However, Table 6 presents the average DF, which corresponds to the aggregation of the DF's of each of the four responses of the multiobjective system (see expression (4)). Additionally, the average response, percentage difference with regard to the corresponding target value and standard deviation is presented for each response. The same is done for the corresponding effects. Here again, those averages are computed using the 30 runs for each treatment and taking into account the best five solutions delivered by the GA in each run. A first point to note is that the DF's are generally smaller than the ones of the one-objective systems (to easily appreciate that, compare the levels of DF on Figure 1 with those on Figure 2. This is expected, since the GA has a tougher task when trying to simultaneously adjust the mean of the four responses and decrease their variances. Regarding the effects of the factors on DF, only the effect C is significant. As with the single objective systems, the larger the desirability limits, the larger DF becomes. This can be clearly seen on Figure 2.
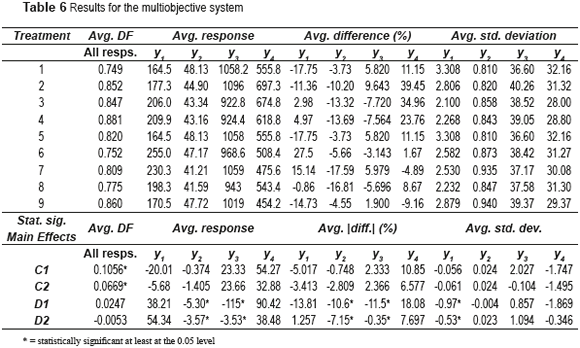
Table 6 and Figure 2 also show that the effects D1 and D2 on the average response of y2 and y3 and their corresponding effects on percentage difference with regard to their target values are significant. In both cases, the effects are negative, which implies that a larger level of fractioning entails a tighter mean adjustment. However, note that this conclusion is not consistent among all of the four responses. Regarding standard deviation, those two effects are significant for response y1. Since effects D1 and D2 on the average standard deviation of y1 are negative, it may be concluded that the smaller the level of fractioning, the smaller the standard deviation of y1 will be. Here again, this conclusion must be treated with caution given that it is not consistent among the four responses.
In summary, the previous analyses allow to reach almost the same conclusions that were already mentioned for the single objective systems. Crossover and mutation probability do not significantly influence the performance of the GA and the desirability limits ar and br affect DF. Higher values for ar and br tend to increase DF. Contrary to what happened with the single objective systems, the level of fractioning impacts the average of some of the responses of the multiobjective system and their corresponding standard deviations. In general, a lower level of fractioning entails a tighter mean adjustment and smaller variance. However, those effects are not consistently found for all the four responses, and thus must be treated with caution.
Effect of crossover and mutation probabilities
Regarding the effect of the crossover and mutation probability on the performance of the GA, the results show that they do not significantly affect the capability of the GA to find the best solutions. However, it should be noted that the analysis of all of the solutions found by the GA, not only the five best ones, reveals that pc and pT might influence the diversity of about 20% of the worst solutions found by the GA. From all the solutions delivered by the GA, 80% were consistently found in all 30 runs and correspond to the best ones, i.e. those that achieve a good mean adjustment and low variation for the responses. The other 20% are relatively worse solutions compared with the other 80%. For that 20% of worst solutions, an increase in pc and pT augmented the diversity among them, i.e. the GA found slightly different combinations of treatments among runs. That result is expected and it is consistent with previous findings [15, 16], given that a higher pc and pT generally increases the searched volume of the parameter space. Nevertheless, since the engineer is interested only in the best solutions and all of them were consistently found by the GA, that result is unimportant from a practical point of view. Finally, it should be noted that the average computational time it took the GA to reach the stopping condition was 41.5 [s] with a standard deviation of 3.7 [s], using Matlab v. 6.5.0.180913 and an HP PC with Intel Core i5-2500S CPU @ 2.70GHz, 3.2 GB RAM, running under OS MS Windows 7 Enterprise, v.6.1.7601, SP 1.
Conclusions
The most important result of the performance analysis suggests that high levels of fractioning of the experimental designs used to gather the data for the robust design study do not strongly and detrimentally influence the capability of the GA to find good solutions. In the experimental treatments, the level of fractioning or correspondingly, the number of data points fed to the GA were 768 (L48(410) x L16(45)), 1024 (L64(410) x L16(45)) and 1280 (L80(410) x L16(45)). The percentage difference among those numbers are - 40% when comparing the extreme cases (1280 with 768), - 20% (1280 with 1024) and – 25% (1024 with 768). Thus, it may be concluded that significantly changing the levels of fractioning (within high levels) does not negatively impact the performance of the GA. Though this result may seem rather counterintuitive, it is plausible given that the experimental designs were all highly fractioned to begin with. Thus, decreasing the original level of fractioning by even 40% still entails a high level of fractioning. We must note that the use of low fractioning levels might have allowed us to better assess the impact of fractioning on the performance of the GA. However, as already explained in Experimental design and levels of factors, we did not use low fractioning levels, given that in robust design experiments those designs are almost never used [5, 6].
The practical implication of the above discussion is that an engineer can apply the GA to robust design studies, even when using highly fractional designs. This is an important aspect, since engineers generally face low budget studies and other constraints, such as short periods of time to conduct experiments, need to keep the production and/or service process running when executing the study and short downtime of processes. Hence, generally engineers require running rather small experiments and gathering a small amount of data, which entail using highly fractional designs, like the ones used in this study [5, 6]. Also, the short computational time it takes the GA to find the solutions, makes its application highly practical. It should be noted that the claim regarding the practical application of the GA-based tool applies only to this type of problem, i.e. robust design studies, but there are no guarantees that it will work in all classes of quality improvement studies. However, given that we have applied the GA to a diverse range of real life systems with good results [6-8] and that the simulator used in testing the GA represents difficult to optimize systems [1, 3-6], we consider that the claim is not overly optimistic. In addition, based on the above, this work shows that it is possible to reduce the gap between theory and practice in some evolutionary computation algorithms, such as recommended in [12]. We are aware that we are solving local and specific quality problems and more holistic approaches are still needed to tackle more important and challenging problems [11, 12], but for many developing countries, such restricted efforts are still worth pursuing.
Regarding the value of the desirability limits, ar and br, the analysis shows that they impact the value of the DF. However, this result does not necessarily imply that the solutions delivered by the GA will be better in terms of achieving a tighter mean adjustment and/or a smaller variation in the responses of the system. Thus, varying the desirability limits does not have an important practical application.
Additionally, two other conclusions that may be drawn from the experiments are similar to the ones already found in previous analyses of the GA. In general, the performance of the GA is better for single objective than for multiobjective systems and the best solutions are consistently found by the GA in the runs that were executed [7, 8].
Finally, given that the GA has worked rather well in its application to real and simulated systems, despite its simplicity to treat multiobjective systems, a Pareto GA tool is currently under development and testing. This new algorithm may better reveal the trade-off between mean adjustment and variance reduction, and thus allow a more sensible selection of the levels of control factors to be implemented in the system.
Acknowledgements
The authors are grateful to Gonzalo Ureta for his valuable work in preparing this paper.
References
1. G. Taguchi. Systems of experimental design. 4th ed. Ed. American Supplier Institute. Dearborn, USA. 1991. pp. 16-511. [ Links ]
2. A. Hajiloo, N. Nariman, A. Moeini. ''Pareto optimal robust design of fractional-order PID controllers for systems with probabilistic uncertainties''. Mechatronics. Vol. 22. 2012. pp. 788-801. [ Links ]
3. K. Ballantyne, R. Oorschot, R. Mitchell. ''Reduce optimisation time and effort: Taguchi experimental design methods''. Forensic Science International: Genetics Supplement Series. Vol. 1. 2008. pp. 7-8. [ Links ]
4. S. Maghsoodloo, G. Ozdemir, V. Jordan, C. Huang. ''Strengths and limitations of Taguchi's contributions to quality, manufacturing, and process engineering''. Journal of Manufacturing Systems. Vol. 23. 2004. pp. 73-126. [ Links ]
5. R. Roy. Design of Experiments Using the Taguchi Approach. 1st ed. Ed. J. Wiley & Sons. New York, USA. 2001. pp. 8-513. [ Links ]
6. H. Allende, E. Canessa, J. Galbiati. Diseño de Experimentos Industriales. 1st ed. Ed. Universidad Técnica Federico Santa María. Valparaíso, Chile. 2005. pp. 27-200. [ Links ]
7. H. Allende, D. Bravo, E. Canessa. ''Robust design in multivariate systems using genetic algorithms''. Quality & Quantity Journal. Vol. 44. 2010. pp. 315-332. [ Links ]
8. E. Canessa, C. Droop, H. Allende. ''An improved genetic algorithm for robust design in multivariate systems''. Quality & Quantity Journal. Vol. 42. 2011. pp. 665-678. [ Links ]
9. A. Jamali, A. Hajiloo, N. Nariman. ''Reliability-based robust Pareto design of linear state feedback controllers using a multi-objective uniform-diversity genetic algorithm (MUGA)''. Expert Systems with Applications. Vol. 37. 2010. pp. 401-413. [ Links ]
10. O. Köksoy, T. Yalcinoz. ''Robust design using Pareto type optimization: a genetic algorithm with arithmetic crossover''. Computers & Industrial Engineering. Vol. 55. 2008. pp. 208-218. [ Links ]
11. K. Sörensen. ''Metaheuristics—the metaphor exposed''. International Transactions in Operational Research. Vol. 22. 2015. pp. 3-18. [ Links ]
12. Z. Michalewicz. Quo vadis, evolutionary computation? Proceedings of the 2012 World Congress Conference on Advances in Computational Intelligence. Berlin, Germany. 2012. pp. 98-121. [ Links ]
13. E. Castillo, D. Montgomery, D. McCarville. ''Modified desirability functions for multiple response optimization''. Journal of Quality Technology. Vol. 28. 1996. pp. 337-345. [ Links ]
14. F. Ortiz, J. Simpson, J. Pigniatiello, A. Heredia. ''A Genetic Algorithm Approach to Multiple – Response Optimization''. Journal of Quality Technology. Vol. 36. 2004. pp. 432-449. [ Links ]
15. K. Farhad, D. Hassani. ''The effects of parameter settings on the performance of genetic algorithm through experimental design and statistical analysis''. Advanced Materials Research. Vol. 433-440. 2012. pp. 5994-5999. [ Links ]
16. H. Marziyeh, B. Hossein, K. Farhad. ''Evaluating the effects of parameters setting on the performance of genetic algorithm using regression modeling and statistical analysis''. Journal of Industrial Engineering. Vol. 45. 2011. pp. 61-68. [ Links ]
17. O. Abdul, M. Munetomo, K. Akama. ''An adaptive parameter binary-real coded genetic algorithm for constraint optimization problems: Performance analysis and estimation of optimal control parameters''. Information Sciences. Vol. 233. 2013. pp. 54-86. [ Links ]
18. A. Eiben, S. Smit. ''Parameter tuning for configuring and analyzing evolutionary algorithms''. Swarm and Evolutionary Computation. Vol. 1. 2011. pp. 19-31. [ Links ]
19. M. Kaya. ''The effects of two new crossover operators on genetic algorithm performance''. Applied Soft Computing. Vol. 11. 2011. pp. 881-890. [ Links ]
20. S. Smit, A. Eiben. Parameter tuning of evolutionary algorithms: generalist vs. specialist. Proceedings of the International Conference on Applications of Evolutionary Computation. Berlin, Germany. 2010. pp. 542-551. [ Links ]
21. I. Falco, A. Della, E. Tarantino. ''Mutation-based genetic algorithm: performance evaluation''. Applied Soft Computing. Vol. 1. 2002. pp. 285-299. [ Links ]
22. P. Pongcharoen, D. Stewardson, C. Hicks, P. Braiden. ''Applying designed experiments to optimize the performance of genetic algorithms used for scheduling complex products in the capital goods industry''. Applied Statistics. Vol. 28. 2001. pp. 441-455. [ Links ]
23. K. Hinkelmann, O. Kempthorne. Design and analysis of experiments. 1st ed. Ed. John Wiley & Sons. New York, USA. 1994. p. 177-181. [ Links ]
