


Services on Demand
Journal
Article
 English (pdf)
 Article in xml format
 Article references
 Send this article by e-mail
Indicators
-
 Cited by SciELO
 -
 Access statistics
Related links
-
 Cited by Google
 -
 Similars in
SciELO
Similars in
SciELO -
 Similars in Google
Share

 Permalink
Revista Facultad de Ingeniería Universidad de Antioquia
Print version ISSN 0120-6230
Rev.fac.ing.univ. Antioquia no.75 Medellín Apr./June 2015
https://doi.org/10.17533/udea.redin.n75a17
ARTÍCULO ORIGINAL
DOI: 10.17533/udea.redin.n75a17
Assessment of the RLS 90 calculation method for predicting road traffic noise in Colombian conditions
Evaluación del método de cálculo RLS 90 para la predicción de ruido automotor en condiciones colombianas
Diego Mauricio Murillo-Gómez*, Juan Camilo Gil-Carvajal, Valentina Zapata-Rodríguez, José Julián Téllez-García
Grupo de Investigación en Modelamiento y Simulación Computacional (GIMSC), Universidad de San Buenaventura. Cra 56C N.º 51-110. Medellín, Colombia.
* Corresponding author: Diego Mauricio Murillo Gómez, e-mail: dmmg1c12@soton.ac.uk, diegomurillogomez@gmail.com
DOI: 10.17533/udea.redin.n75a17
(Received October 08, 2014; accepted April 10, 2015)
Abstract
This paper presents an evaluation of the German standard RLS 90 (Richtlinien für den Lärmschutz an Straben) for the estimation of noise levels produced by the traffic flow in Colombian conditions. For this, environmental noise measurements and relevant information required to simulate road noise were taken in two different areas of the City of Medellín. From the collected data, simulations were performed using the commercial package SoundPLAN. The influence of the input data on the accuracy of the noise levels was assessed by means of the total expanded uncertainty of the noise maps. Furthermore, RLS 90 was compared with an alternative approach based on interpolation methods. The results indicate that the use of RLS 90 allows noise levels to be predicted with good precision in areas where road noise predominates. Compared to the interpolation approach, it lets greater accuracy in the output data. Lastly, regarding the input data, the outcomes suggest that the variables related to the source characterization have the highest impact in the uncertainty of the simulation.
Keywords: noise mapping, road noise, RLS 90, interpolation
Resumen
Este artículo presenta la evaluación del método alemán RLS 90 (Richtlinien für den Lärmschutz an Straben) para la predicción del nivel de ruido producido por el tráfico rodado en condiciones colombianas. Para esto, mediciones de ruido ambiental e información de entrada requerida para las simulaciones fueron adquiridas en dos diferentes áreas de la ciudad de Medellín. A partir de la información recolectada en campo, se realizaron simulaciones de ruido utilizando el software comercial SoundPLAN. La influencia de la información de entrada en la precisión de las simulaciones fue evaluada utilizando la incertidumbre total expandida de los mapas de ruido. En adición, RLS 90 fue comparado con una técnica alternativa para la construcción de mapas de ruido basada en el uso de mediciones de ruido e interpolación. Los resultados indican que la implementación del método RLS 90 permite estimar los niveles de ruido automotor con buena precisión en áreas donde el ruido producido por el flujo vehicular es predominante. Comparado con la técnica de interpolación, los hallazgos sugieren que RLS 90 conlleva a una mejor precisión en la elaboración de mapas de ruido. Finalmente, con relación a las variables de entrada utilizadas en RLS90, los resultados apuntan a que los datos asociados con la caracterización de la fuente son las que mayor impacto tienen en la incertidumbre de la simulación.
Palabras clave: mapas de ruido, ruido de tráfico rodado, RLS 90, interpolación
Introduction
Noise mapping is a tool to quantify the impact of the environmental noise in cities by estimating the level of noise pollution in specific areas. From this cartographic information, governmental authorities can develop environmental management plans aimed to mitigate the relevant noise sources in order to ensure healthy acoustic environments. In addition, noise mapping can be used as a tool for territorial planning, supporting decisions regarding the land uses.
Nowadays, two methodologies for noise mapping are usually implemented. The first is based on the measurement of the Equivalent Noise Level (Leq) according to a geographically distributed grid in the area under interest. The measured data serve as an input for the estimation of the noise curves through an interpolation process [1, 2]. The second methodology consists in the implementation of one or several calculation methods that predict the noise levels based on the type of sources and the environment [3, 4].
The use of calculation methods to estimate noise levels has wide application in cities belonging to the European continent [5-9]. This methodology is based on the calculation of the sound propagation from a source to a receiver. According to the type of source (road, railway, industrial or aircraft), a model that calculates the noise emission and the respective propagation considering phenomena such as reflection, absorption and sound attenuation produced by the environment is implemented [10]. The main advantage of this technique lies in the possibility of simulating hypothetical scenarios, in which the assessment of mitigation proposals before their implementation can be supported. In turn, these predictive models can be integrated with GIS acquiring the information required for the calculations from governmental databases [11].
In Colombia, the use of noise measurements and their subsequent interpolation is a common technique implemented by governmental agencies to carry out studies related to noise pollution [12-14]. Furthermore, there have been recently implemented calculation methods to noise mapping [15]. However, since national noise calculation methods have not been established yet, an evaluation in terms of feasibility and accuracy of foreign methods is required. Considering that the road noise is one of the main sources of noise in cities, this paper focuses on the evaluation of the German method RLS 90 to predict road noise.
For this purpose, two areas within the city of Medellin with an approximate area of 5×10⁶ m2 and 1×10⁶ m2 were selected. The input data required for the simulations were acquired based on the recommendations given by the European Commission Working Group Assessment of Exposure to Noise (WG-AEN) [16]. To validate the predictions, the simulations were compared with environmental noise measurements conducted, according to the national standard for environmental noise [17]. Then, different degrees of accuracy in the input variables were implemented to analyze their influence in the total uncertainty of the map. Lastly, a comparison between the RLS 90 and the implementation of interpolation techniques is performed by means of noise maps. The remaining parts of this paper are organized as follows: next section illustrates the methodology implemented to evaluate the RLS 90 and the influence of the input variables on the total uncertainty of the maps. Then, analysis and discussions of the results are addressed. Finally, the last section presents the conclusions of the current work.
Methods
RLS 90 is the national German standard for the prediction of road and parking lot noise. It is composed of two different models; the first corresponds to the determination of emission noise level (Lme) at 25 m distance from the road and 4 m above the ground. Lme is determined taking into account characteristics of the traffic such as the speed of the vehicles, their distribution according to the weight, the surface of the road with its respective inclination, and the addition of energy due to the reflections produced by buildings contiguous to the road (see Eq. 1).

Where L25 is the standardized level assuming a speed 100 km/h for cars and 80 km/h for trucks (see Eq. 2), a road surface composed of non-grooved asphalt, a gradient less than 5% and free field propagation.

In which M is the number of vehicles per hour and P is the percentage of tracks exceeding 2.800 kg. Cs , Crs , Cg and Cr correspond to corrections for speed, road surface, gradient and multiple reflection. Detail on these corrections can be found in [10]. The second model corresponds to the propagation stage, in which, the noise level at a specific position (receiver) is calculated making the energetic addition of all the contributions produced by the sources considering the length of the road, the attenuation due to the distance, the absorption of the air, and the effect on the sound propagation caused by the temperature gradient [10].
Simulations
Baseline scenario
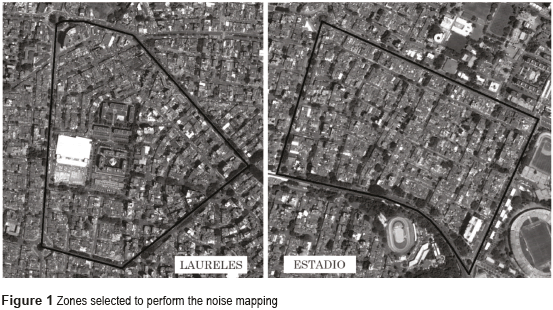
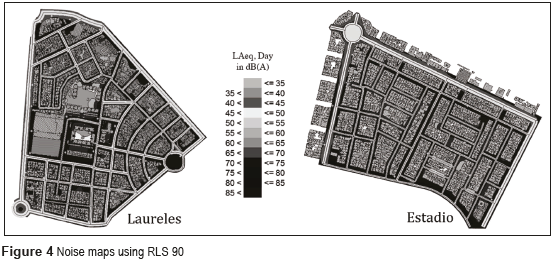
The selection of the zones to conduct the present study was performed according to the Land Use Plan of the city of Medellin, which establishes the areas for residential, commercial and mixed activities, among others. The selection criterion was residential areas where the dominant noise source is road traffic. Based on the above, the first region corresponded to Laureles neighbourhood (1×10⁶ m2) and the second to Estadio neighbourhood (5×10⁶ m2). Figure 1 shows a satellite photo of each area. The scale is different between areas to optimize the visualization.
The first step consisted in the generation of reference noise maps in which the input data were obtained with high level of accuracy. The information required for modelling was collected based on the recommendations given by the European Commission Working Group Assessment of Exposure to Noise [16] within an accuracy range of 0.5 to 1 dB. Georeferenced data related to topography, roads and buildings were provided by the Governmental Planning Department of the city. Subsequently, all the information was structured through a geospatial database in the commercial package ArcGIS. This made easier the organization and edition of the information for its use in the prediction software. The calculations were made using the commercial package SoundPLAN with the following configuration: order of reflection equal to 3, searching radius covering the full area, diffraction enabled and a tolerance level of 0.1 dB.
Validation
The validation process was based on the comparison between environmental noise measurements with their respective point receivers estimated in the prediction software. The noise measurements were performed in accordance with the Colombian regulation for environmental noise assessment [17] using the following configuration: type 1 sound level meters were located at 4 m above the floor and 1.5 m far away from the facades. The measurement time was approximately 60 minutes at each point. This procedure was repeated 4 times at different hours and days in order to characterize the variation in the noise level due to the peaks and valleys of the traffic flow. The sound pressure level was measured using slow and impulse time weighting with A and C frequency weighting. In addition, data related to temperature, relative humidity, barometric pressure, wind speed and its direction were taken as well.
As a condition of validity, it was determined a maximum difference of 3 dB between the simulated and the measured value [18, 19]. Subsequently, the uncertainty of the noise maps was calculated according to the methodology described in [20]. The total uncertainty of the noise map (ut) takes into account the uncertainties introduced by the measurement (um) and simulation (us) process (Eq. 3). The calculation of the measurement uncertainty (um) was performed following the guidelines of the Guide to the Expression of Uncertainty in Measurement [21], which allows the variance of the measured data and the contribution to the uncertainty as a consequence of the measuring instrument to be calculated. Therefore, the uncertainty of the simulation process (us) is calculated from the total uncertainty of the noise map (ut) and the measurement uncertainty (um) (Eq. 4).
The total expanded uncertainty of the map is empirically determined using a coverage factor k=2 based on the probability of dispersion less than 95.45% among data (Eq. 5). Since the expanded uncertainty of the measurement process (Um=um×k) is calculated analytically, and the total expanded uncertainty of the noise map (Ut) is determined empirically using a coverage factor k=2, the expanded uncertainty due to the simulation process Us is determined by Eq. (6):


Where Ut is the total expanded uncertainty of the map (empirically calculated), ut is the total uncertainty of the map, Um is the uncertainty of the measurement (analytically calculated), us is the uncertainty over the simulation process and Us is the expanded uncertainty of the simulation process. The number of receivers used to calculate the uncertainty of the noise maps were 10 in the case of Laureles and 17 for the Estadio. These receivers were selected randomly from a population of environmental noise measurements performed to build the noise maps using the interpolation methodology. This amount corresponds to about 20% of the total number of measurements. It was not analyzed all the measured points since in the case of a noise map made by simulation the use of such a dense mesh of measurements is not required (it would be impractical), and 20% of the samples are a conservative value considering the areas of the maps. Figures 2 and 3 show the total expanded uncertainty ut for both sectors.
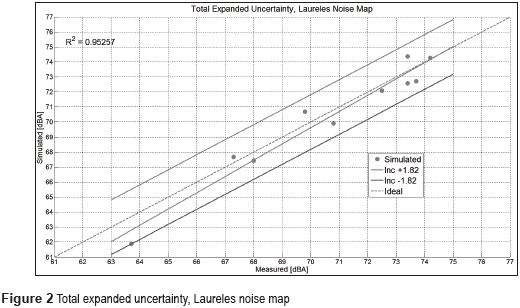
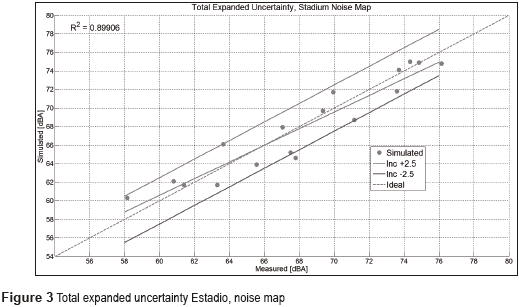
In the case of Laureles, the measurement uncertainty um was 0.6 dB and the expanded total uncertainty of the map Ut was 1.82 dB. The latter value corresponds to the difference between the simulated and measured values covering 95.45% of the analyzed samples. Therefore, the expanded uncertainty of the simulation process US is 1.37 dB. In the case of Estadio the values are 0.93, 2.5 dB and 1.68 dB, respectively. In addition, the correlation index R2 was calculated for the purpose of estimating the correlation between the measured and simulated values. For Laureles the coefficient was 0.95 and 0.90 for the Estadio. Given the expanded total uncertainty values (1.82 dB and 2.5 dB) and the correlation coefficients previously indicated, the simulations were considered as valid. Figure 4 shows the noise maps according to the zone.
Influence of the input variables in the total uncertainty
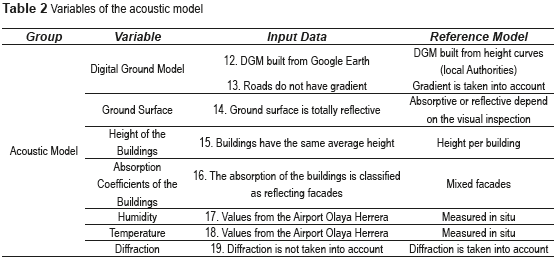
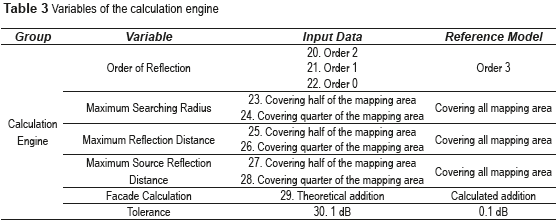
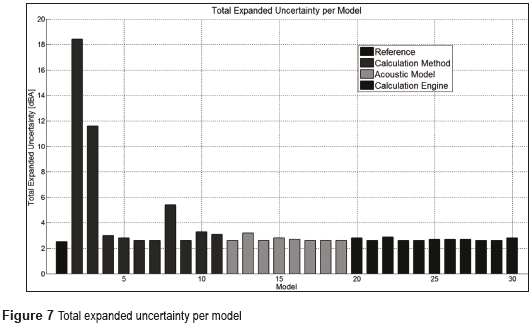
After the calibration of the reference noise maps, the variables required for the simulations were modified using different degrees of accuracy (based on the WG-AEN) to quantify the influence of each of them in the total uncertainty of the noise maps. 30 additional simulations were conducted modifying just one variable per iteration and keeping the others as the reference noise map. Only Estadio was analyzed due to the relevant amount of simulations. The variables were classified into three groups: the calculation method (mathematical representation of the source), the acoustic model (modelation of the environment) and the calculation engine (algorithms used by the software to implement the calculation method). Tables 1, 2 and 3 illustrate the variables taken into consideration based on the classification given above.

Environmental noise measurements and interpolation
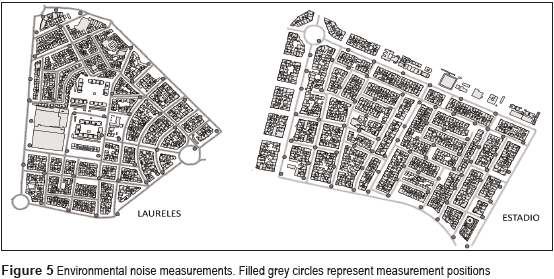
The use of environmental noise measurements to generate a noise map involves the collection of samples at the nodes of the grid, which are then analyzed using a Geographic Information System (GIS). Each noise measurement is geographically referenced for the purpose of creating a continuous surface using an interpolation method. This surface is classified by a colour scale representing the noise level [22]. The implementation of this technique is useful because it enables the integration of the geospatial data with the noise levels in order to determine the compliance of the environmental regulations [23, 24]. Studies focused on the effectiveness of several interpolation methods and their sensitivity to the input information have been also conducted in the scientific literature [25-27]. It was defined 48 and 82 measurement points for Laureles and Estadio to elaborate the noise maps. This number of points corresponded to spacing between measurements of approximately 80 m (see Figure 5).
Continuous Surface Generation
The interpolation process uses known values of the variable at geographically referenced points to estimate the value of the variable at unknown points. This analysis provides two groups of techniques: deterministic and geo-statistics [28]. Although both methods are based on the similarity of the near points to create a continuous surface, the deterministic techniques only use mathematical functions, while geo-statistical techniques are based on both statistical and mathematical analysis.
In order to generate the noise maps, an exploratory analysis was performed to identify biases in measurements and trends in the data. This procedure consists in the comparison of the distribution of the measurements with respect to a normal distribution, evaluating whether it is necessary to discard some information or perform some transformation [29]. Subsequently, a trend analysis was conducted to establish the possible existence of a directional pattern in the data. This method is based on determining the order of the trend using a polynomial of first, second or third order. This directional trend in the data can be removed when the interpolation is implemented. Finally, taking into account the exploratory analysis of the noise measurements, multiple scenarios using the interpolation techniques Kriging and Inverse Distance Weighting IDW were made [26]. For each scenario the power factor, the shape and angle of neighbours, the number of neighbours and the theoretical model used by the semivariogram (in the case of Kriging) were varied.
Validation
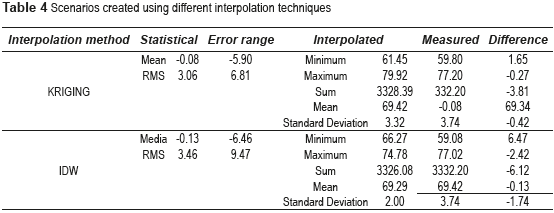
The type of interpolation was selected through the comparison of several scenarios which represent the noise levels in the area. The parameter used to determine the efficiency of the interpolation was the difference between the measured values and the interpolated values (called error). From these differences, the mean and the root mean square values were calculated and the selection criteria were the scenario with the mean and Root Mean Square (RMS) whose error were closest to zero [30]. Similarly, it was established as an additional selection parameter, the comparison between the statistical values of the interpolated data with the statistical values of the measured data (minimum, maximum, sum, mean and standard deviation). Table 4 shows, as an example, two different scenarios for Laureles using Inverse Distance Weighting and Kriging as interpolation methods.
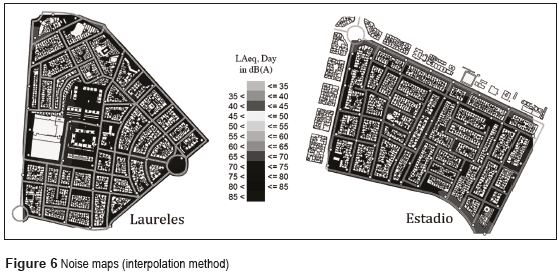
The configuration that presented best results according to the selection criteria for both zones corresponded to Kriging interpolation in connection with a spherical model, and removing the third-order trend. This configuration exposed a high congruence between predicted and measured data. Likewise, the mean and the RMS of the error were closer to zero compared to all the scenarios. Figure 6 illustrates the noise maps using the interpolation approach.
Discussions
The results indicate that RLS 90 is a suitable calculation method to predict the noise produced by roads in Colombia. These findings are consistent with outcomes reported by other studies [31, 32]. The accuracy of the input data required by the model seems to be the most relevant point to ensure the consistence in the simulations. The implementation of different international methods such as NMPB or CNRT could be practical as long as the quality of the input information remains the same.
Figure 7 shows the total expanded uncertainty for each model. From the data, it is possible to determine that the traffic flow and speed have the most predominant impact in the prediction. Others variables related to the calculation method such as the energetic addition due to facades enclosing the roads and the distance of the emission bands also have a relevant effect. Simulations performed with CadnaA under the same conditions indicate the same tendency. For these specific areas, the influence of the digital ground model is minimal due to the homogeneity of the terrain. However, its relevance in zones where the elevation of the ground is not flat has been showed in [33]. Due to the high cost of large scale noise mapping, these outcomes could help local authorities to establish the information that exerts the greatest influence on the accuracy with the purpose of distributing technical and economic resources suitably.
A comparison between RLS 90 and the interpolation approach indicates that the noise maps are different. Figure 4 shows the noise maps made with RLS 90, which indicate noise levels in the range of 45 dBA and 80 dBA. In contrast, the maps elaborated using the Kriging interpolation specify noise levels within the range of 60 dBA to 80 dBA (Figure 6). This difference may be attributed to the consideration of the environment in the RLS 90 calculation, which takes into account the attenuation caused by buildings. This higher resolution helps identifying the roads where the noise levels are exceeded, according to the limits established by the national regulations.
In addition, it was found that the implementation of the calculation method RLS 90 is more consistent with the acoustic phenomenon. This is because the computation of the noise levels is performed based on the calculation of the sound propagation, taking into account aspects such as topography, type of source and the reflection, absorption, attenuation and diffraction of the waves. Otherwise, Kriging interpolation method does not consider these variables, but depends on sound pressure levels obtained by measurements and the geostatistics relation among them.
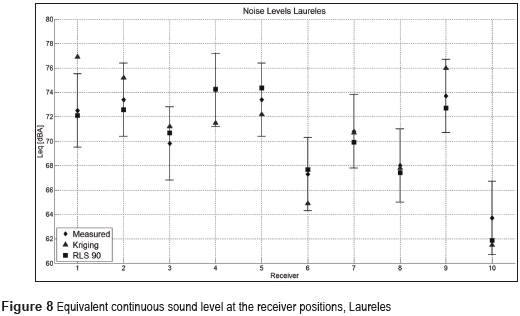
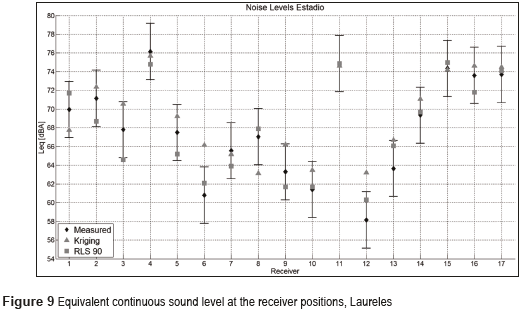
Figures 8 and 9 show the equivalent continuous sound level estimated by the two methods with reference to the measured values. It is observed that using the method RLS 90 the simulated values are within a threshold of + -3 dB with respect to the measurements, while the levels estimated using the Kriging interpolation diverge up to about 5 dB for both sectors. This suggests that the use of the method RLS 90 is more accurate to calculate the noise produced by road sources.
Conclusions
It was conducted an evaluation of the RLS 90 calculation method to predict the road noise in Colombian conditions. The results suggest that if the quality of the input information is appropriate, the method is able to predict the noise levels with good accuracy. Input variables related to the calculation method (neglecting the digital ground model) seem to have the highest influence in the accuracy of the predictions.
A comparison of the RLS 90 and the interpolation approach reveals that the interpolation technique provides a global estimation of the noise levels, but it does not allow the generating sources to be accurately determined. The main reason is because this methodology uses as an input the noise levels at the receiver positions without considering the type of source and its emission. Similarly, in order to obtain a statistical valid representation of the noise levels, it was necessary to make measurements with a resolution of about 80 m among measured points, which makes the approach impractical for large-scale studies.
As opposed, the implementation of the method RLS 90 takes into account the characteristics of the source and its interaction with the environment. In this case, the acoustic condition can be analyzed with more detail supporting the design and evaluation of noise control alternatives. Although this study focused on road noise, it is possible to implement calculation methods for other type of sources expanding the use of this approach. Based on the above, this methodology is more suitable for noise mapping that is intended to be an input for the governmental authorities in order to facilitate the planning of the territory.
Finally, the information displayed in the noise maps must be periodically updated to assess the effectiveness of the actions implemented to reduce the noise levels. For this purpose, the use of calculation methods is more efficient because a significant amount of noise measurements do not have to be updated. In this case, it is possible to feed the calculation model only with updated strategic information (e.g. changes in the traffic flow). This feature also allows for the governmental agencies to evaluate different mitigation proposals by simulation, and select the best according to the characteristics of the sector.
Acknowledgements
The authors would like to thank GSA S.A.S. for its support and collaboration in the current research.
References
1. K. Tsai, M. Lin, Y. Chen. ''Noise mapping in urban environments: A Taiwan study''. J Appl Acoust. Vol. 70. 2009. pp. 964-972. [ Links ]
2. A. Alesheikh, M. Omidvari. ''Application of GIS in Urban Traffic Noise Pollution''. Int J Occup Hyg. Vol. 2. 2010. pp. 79-84. [ Links ]
3. F. Diniz, P. Zannin, ''Calculation of noise maps around electrical energy substations''. J Appl Acoust. Vol. 66. 2005. pp. 467-477. [ Links ]
4. E. Murphy, E. King. ''Scenario analysis and noise action planning: Modelling the impact of mitigation measures on population exposure''. J Appl Acoust. Vol. 72. 2011. pp. 487-494. [ Links ]
5. European Union. ''DIRECTIVE 2002/49/EC Relating to the assessment and management of environmental noise''. Official Journal of the European Communities. L189. 2002. pp. 12-25. [ Links ]
6. P. Bite, M. Bite, I. Dombi. The Budapest noise mapping Project- noise map of the city center of Budapest. Proceedings of the Forum Acusticum Budapest, 4th European Congress on Acoustics. Budapest, Hungary. 2005. pp. 981-985. [ Links ]
7. M. Morretta, A. Iacoponi, F. Dolinich. The port of Livorno noise mapping experience. Proceedings of the 7th European Conference on Noise Control (EURONOISE), Acoustics'08. Paris, France. 2008. pp. 1355-1360. [ Links ]
8. D. Manvell, L. Marcos, H. Stapelfeldt, R. Sanz. SADMAM – Combining measurements and calculations to map noise in Madrid. Proceedings of the Internoise, 33rd International Congress and Exposition on Noise Control Engineering. Prague, Czech Republic. 2004. pp. 1-8. [ Links ]
9. E. King, E. Murphy, H. Rice. ''Evaluating the impact on noise levels of a ban on private cars in Dublin city centre, Ireland''. J Transport Res. Vol. 16. 2011. pp. 532-539. [ Links ]
10. J. Quartieri, N. Mastorakis, G. Iannone, C. Guarnaccia, S. D'Ambrosio, A. Troisi, T. Lenza. A Review of Traffic Noise Predictive Models. Proceedings of the 5th lt, [ Links ]
11. M. Mehdi. ''Modeling of road traffic noise and estimated human exposure in Fulton County''. J Environ Int. Vol. 37. 2011. pp. 1336-1341. [ Links ]
12. D. Yepes, M. Gomez, L. Sanchez, A. Jaramillo. ''Metodología de elaboración de mapas acústicos como herramienta de gestión del ruido urbano - caso Medellín''. J Dyna. Vol. 76. 2009. pp. 29-40. [ Links ]
13. ADA & CO LTDA. Medición de ruido ambiental en la ciudad de Manizales. Corpocaldas Tech. Rep. 200-2008. Manizales, Colombia. 2008. pp. 1-176. [ Links ]
14. E. Gómez. Mapa de Ruido del Municipio de Santiago de Cali. 2010-2014. Departamento Administrativo de Gestión del Medio Ambiente, Alcaldía de Santiago de Cali. Available on: http://www.cali.gov.co/publicaciones.php?id=44086 Accessed: October 1, 2014. [ Links ]
15. Corporación Autónoma Regional de Nariño. Determinantes ambientales para el ordenamiento territorial. CORPONARIÑO Tech. Rep. 738. Pasto, Colombia. 2011. pp. 1-171. [ Links ]
16. European Commission Working Group Assessment of Exposure to Noise (WG-AEN). Good practice guide for strategic noise mapping and the production of associated data on noise exposure. Position paper, Tech. Rep. 004. Brussels, Belgium. 2007. pp. 1-129. [ Links ]
17. Ministerio de Ambiente, Vivienda y Desarrollo Territorial. Resolución 0627 [Norma nacional de emisión de ruido y ruido ambiental]. Imprenta Nacional, Diario Oficial 46239. Bogotá, Colombia. 2006. pp. 1-29. [ Links ]
18. J. Barrigón, M. Mellado, V. Gómez, J. Méndez, R. Vílchez, D. Guzmán, et al. Mapa de ruido de la ciudad de Badajoz mediante la aplicación de métodos matemáticos predictivos. Proceedings of the Tecniacústica (37º Congreso Nacional de Acústica). Gandia, Spain. 2006. pp. 43-50. [ Links ]
19. P. Vukadin, I. Bublic, I. Tudor. Urban noise mapping- an approach to the establishment of standard making procedure. Proceedings of the 7th European Conference on Noise Control (EURONOISE), Acoustics'08. Paris, France. 2008. pp. 303-307. [ Links ]
20. M. Ausejo. Estudio de la validación, errores e incertidumbre en la elaboración de mapas de ruido. PhD Dissertation, Politecnic University of Madrid. Madrid, Spain. 2010. pp. 13-27. [ Links ]
21. International Organization for Standarization. Guide to the Expression of uncertainty in Measurement. ISO. Geneva, Switzerland. 1995. pp. 1-120. [ Links ]
22. D. Cho, J. Kim, D. Manvell. ''Noise mapping using measured noise and GPS data''. J Appl Acoust. Vol. 68. 2007. pp. 1054-1061. [ Links ]
23. H. Doygun, D. Gurun. ''Analysing and mapping spatial and temporal dynamics of urban traffic noise pollution: a case study in Kahramanmaraş, Turkey''. J Environ Monit Assess. Vol. 142. 2008. pp. 65-72. [ Links ]
24. M. Mehdi, M. Kim, J. Seong, M. Arsalan. ''Spatio-temporal patterns of road traffic noise pollution in Karachi, Pakistan''. J Environ Int. Vol. 37. 2011. pp. 97-104. [ Links ]
25. H. Kluijver, J. Stoter. ''Noise mapping and GIS: optimising quality and efficiency of noise effect studies''. J Comput Environ Urban. Vol. 27. 2003. pp. 85-102. [ Links ]
26. D. Murillo, I. Ortega, J. Carrillo, A. Pardo, J. Rendón. ''Comparación de métodos de interpolación para la generación de mapas de ruido en entornos urbanos''. J Ing. USBMed. Vol. 3. 2012. pp. 62-68. [ Links ]
27. J. Li, A. Heap. ''A review of comparative studies of spatial interpolation methods in environmental sciences: Performance and impact factors''. J Ecol Inform. Vol. 6. 2011. pp. 228-241. [ Links ]
28. B. Ripley. Spatial Statistics. 2nd ed. Ed. John Wiley & Sons. New Jersey, USA. 2004. pp. 28-77. [ Links ]
29. J. Cano. Metodología para el análisis de la dispersión del ruido en aeropuertos, estudio de caso: aeropuerto Olaya Herrera de la ciudad de Medellín. MSc Thesis, Universidad Nacional de Colombia. Medellín, Colombia. 2009. pp. 1-111. [ Links ]
30. A. Moreno. Sistemas y análisis de la información geográfica. 2nd ed. Ed. RA-MA. Madrid, Spain. 2008. pp. 1-940. [ Links ]
31. D. Murillo. Simulación de ruido automotor como instrumento de gestión para el rediseño de rutas de transporte público en el valle del Aburrá. MSc Thesis, Universidad de Medellín. Medellín, Colombia. 2010. pp. 1-90. [ Links ]
32. C. Echeverri, D. Murillo, G. Valencia. ''Simulación de ruido de tránsito automotor como herramienta para el rediseño de rutas de transporte público colectivo en el municipio de Medellín''. Rev. Ing. Univ. Medellín. Vol. 10. 2011. pp. 19-30. [ Links ]
33. M. Arana, R. San Martín, I. Nagore, D. Pérez. Uncertainty in noise mapping versus precision in the digital terrain model. Proceedings of the Internoise, 39th International Congress and Exposition on Noise Control Engineering. Lisbon, Portugal. 2010. pp. 1-8. [ Links ]
